For crypto traders following short-term or established trends, it can reveal momentum changes earlier than conventional moving averages. The catch is that faster signals also bring more false reversals, particularly during sideways trading.
Key Takeaways
-
The Hull Moving Average (HMA) combines weighted moving averages to reduce lag while keeping price movements relatively smooth.
-
A rising HMA with price holding above it can support long entries. A falling HMA with price below it can support bearish setups.
-
HMA periods of 9–14 suit faster trading, while 20–34 and longer settings provide different levels of trend smoothing.
-
RSI, volume, price structure, and higher-timeframe confirmation help filter unreliable trading signals.
-
HMA works best in directional markets. Repeated slope changes during consolidation can cause whipsaws and premature exits.
What Is the Hull Moving Average HMA Indicator?
The Hull Moving Average is a technical indicator developed by Alan Hull in 2005. It was designed to reduce the delay found in traditional moving averages without producing an excessively irregular moving average line.
A simple moving average (SMA) gives equal weight to historical price data. An exponential moving average (EMA) emphasizes recent prices. HMA takes a different route, combining weighted moving averages and final smoothing to track price movements more closely.
The result is a smooth curve that can turn before comparable SMA or EMA indicators during directional changes. As Alan Hull's original explanation describes, the goal is to reduce lag while retaining smoothness, not to predict future prices.
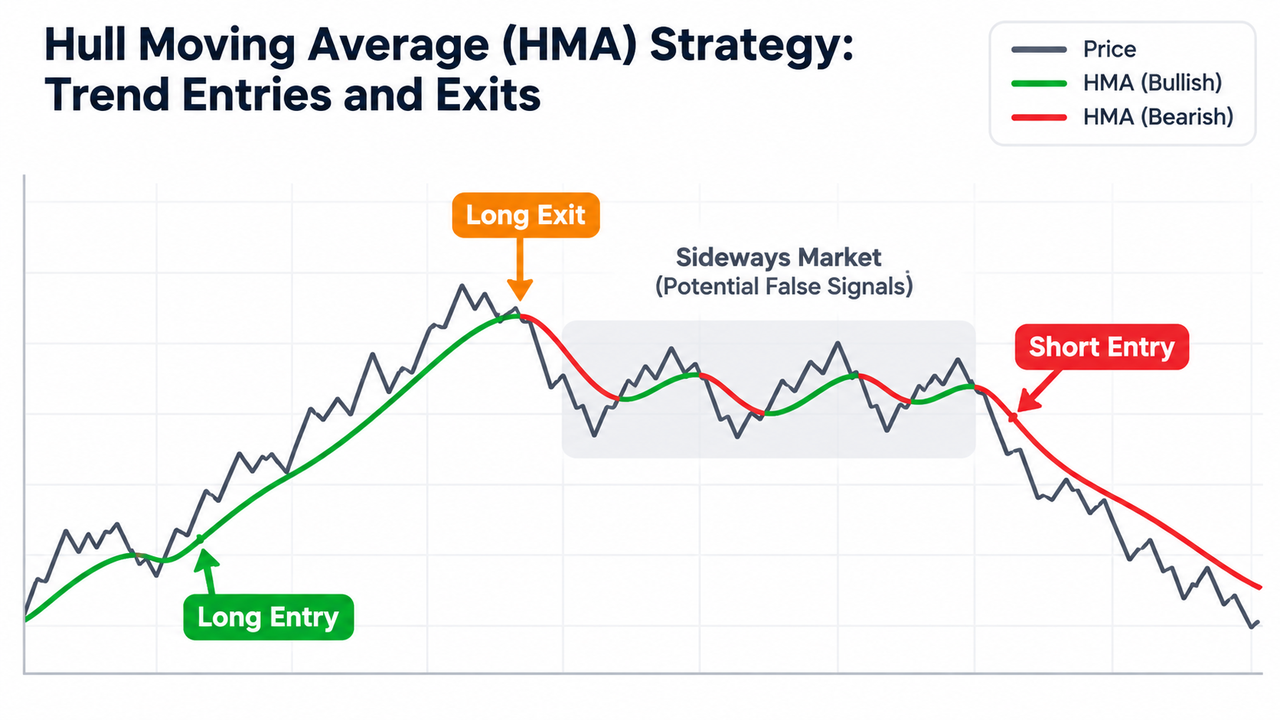
An upward HMA slope suggests bullish momentum. A downward slope suggests weakening prices or bearish momentum. Some charting platforms display these changes as green and red lines, although colors depend on indicator settings.
The Hull Moving Average's lag-reduction mechanism makes it particularly relevant to trend-following trading systems.
The Hull moving average formula uses two weighted moving averages before applying a final smoothing calculation.
HMA(n) = WMA(2 × WMA(Price, n/2) − WMA(Price, n), √n)
Here, n represents the selected number of periods, while WMA gives greater weight to recent prices.
The HMA calculation follows three stages:
-
Calculate a weighted moving average using half the specified number of periods.
-
Double that result and subtract the full-period WMA to produce a raw moving average.
-
Apply another WMA using the square root of the original period for final smoothing.
For HMA(16), the calculation uses WMA(8), WMA(16), and a final WMA(4).
The first two calculations reduce lag by emphasizing recent price activity. The final smoothing helps control market noise.
Implementations may round intermediate periods differently, which can produce slightly different values. The StockCharts HMA calculation reference describes the underlying method.
These calculations greatly reduce lag compared with conventional averages, but they don't eliminate it altogether.
How to Use a Hull Moving Average Strategy for Trading Signals
A practical Hull moving average strategy combines three observations: HMA slope, closing price relative to the indicator, and confirmation from price structure.
Step 1: Identify the Broader Trend
Start with a higher timeframe before interpreting short-term trading signals.
For example, a trader examining a 15-minute BTC chart could use the one-hour chart to establish the overall trend.
A rising higher-timeframe HMA supports bullish conditions. A falling line suggests bearish conditions.
This approach follows the same principle as multiple timeframe trading, where smaller price moves are assessed against broader market direction.
Step 2: Find Long and Short Entry Points
A potential long signal develops when the fast Hull moving average turns upward and price closes above it.
A stronger setup includes:
-
A higher low forming near the HMA.
-
RSI moving above 50.
-
Increasing trading volume during the upward move.
-
Price breaking nearby resistance or confirming a retest.
For bearish setups, the conditions reverse. The HMA slopes downward, price remains below it, and RSI falls beneath 50.
Volume and momentum confirmation matter because an HMA turn alone doesn't establish a genuine trend reversal.
For example, RSI and MACD entry confirmation can help distinguish improving momentum from a temporary price bounce.
Step 3: Use Price Structure Before Entering
Suppose BTC trades at $70,000 in a hypothetical example.
The HMA(21) turns upward, but resistance remains near $70,200. Entering immediately would mean anticipating a breakout that hasn't happened.
A more selective approach waits for price to close above resistance and then hold that area during a retest.
Such breakout confirmation through a retest provides an additional check beyond indicator direction.
On Gate.com, a trader can use the BTC/USDT spot market to examine price bars, trading volume, and nearby support or resistance before evaluating a setup.
Dual Hull MA Trading Strategies and Crossover Signals
Some trading strategies combine a fast Hull moving average with a slow Hull moving average.
A common example uses HMA(20) and HMA(50).
| Market condition |
Possible interpretation |
| Fast HMA crosses above slow HMA |
Potential bullish shift |
| Fast HMA crosses below slow HMA |
Potential bearish shift |
| Both HMAs rise |
Bullish trend alignment |
| Both HMAs fall |
Bearish trend alignment |
| Lines repeatedly intersect |
Sideways conditions or market noise |
Crossover signals may appear earlier than comparable traditional moving average crossovers. But that isn't automatically an advantage.
Alan Hull originally emphasized HMA turning points rather than crossovers, because the indicator was designed to reduce lag. Dual HMA crossover systems are later trading applications that require independent testing.
Waiting for both HMAs to move in the same direction may filter some false signals, although it also delays entry points.
Best Hull Moving Average Settings for Crypto
The ideal HMA setting depends on the specified timeframe, market volatility, and trading style.
| Trading style |
Illustrative HMA periods |
Main tradeoff |
| Scalping |
9–14 |
Fast reaction, frequent whipsaws |
| Intraday trading |
20–34 |
Balance between speed and smoothing |
| Swing trading |
34–55 |
Fewer signals, slower turning points |
| Broader trend analysis |
55–100 |
Smoother trend, later reversals |
HMA(21) is a useful starting parameter for testing crypto intraday swings, not a universally validated optimum.
Shorter periods produce more entry and exit signals because the indicator responds to even smaller price changes. Longer periods smooth price noise but react later.
The selection of moving average settings by trading timeframe should account for trading frequency and volatility rather than relying on one preferred number.
How to Use HMA Exit Signals and Trailing Stops
Exit signals often matter more than finding the earliest possible entry.
A long position may be reassessed when the HMA slope turns downward, price closes beneath the line, or an established support level breaks.
During an uptrend, the Hull MA can behave like dynamic support. Traders sometimes place a trailing stop below the HMA or the latest confirmed swing low.
For example, if BTC advances from $70,000 to $72,000, the trader could trail a protective stop below a recent higher low instead of exiting after the first minor HMA downturn.
The distance must account for volatility. A stop too close to the moving average can be triggered by ordinary intraday fluctuations.
An alternative uses Average True Range (ATR) to determine volatility-adjusted stop distance.
The use of indicators to time trade exits combines directional signals with risk management instead of treating every indicator change as an automatic sell order.
Limitations, False Signals, and Backtesting
HMA performs best when price follows a sustained directional move. During sideways markets, frequent HMA slope changes can generate repeated losing trades.
Price crossing the indicator isn't sufficient evidence of a new trend. A single large candle can temporarily change the HMA slope before the prevailing trend resumes.
Another limitation is parameter sensitivity. Settings optimized for equity markets may behave differently on continuously traded crypto markets.
Some published HMA strategy tests report figures such as an 8.84% compounded annual return on SPY or a 2.31% average gain per trade. Without a verifiable methodology, sample period, trading rules, and transaction-cost assumptions, those figures shouldn't be treated as established performance benchmarks.
Backtesting should compare HMA strategies with SMA and EMA alternatives across identical market conditions. Relevant measures include win rate, maximum drawdown, average gain, fees, and performance outside the optimization period.
The SEC's investor bulletin on performance claims explains why hypothetical backtests cannot establish future profitability.
Conclusion
A Hull moving average strategy helps traders identify trend entries and exits by tracking changes in price direction with less lag than traditional moving averages.
Its strongest application combines HMA slope, higher-timeframe alignment, price structure, and momentum confirmation. Faster reactions can improve timing, but they also increase exposure to false signals.
Treat the indicator as one component of a trading system, not a standalone prediction tool.
Frequently Asked Questions
Is the Hull Moving Average better than EMA for crypto trading?
HMA generally reacts faster to price changes than an EMA using the same period. However, faster reactions can create more false signals in sideways markets. Neither indicator consistently outperforms the other under all conditions.
What is the best HMA setting for day trading?
HMA periods between 20 and 34 are reasonable starting points for intraday testing. Traders using shorter chart timeframes may prefer faster settings, but the appropriate period depends on volatility and the strategy's entry rules.
Can HMA predict trend reversals?
No. HMA identifies changes in historical price momentum rather than predicting future turning points. An upward or downward slope change may occur before a sustained reversal, but it can also be temporary.
Is HMA(21) suitable for Bitcoin trading?
HMA(21) can be used to evaluate Bitcoin's short-term trend direction. Its effectiveness depends on timeframe, volatility, trade execution, and confirmation rules. There is no established evidence that HMA(21) is universally optimal.
Can HMA strategies work in sideways markets?
They can be adapted for mean-reversion trading, but ordinary trend-following HMA signals tend to struggle during consolidation. Repeated slope changes and price crossings increase the likelihood of whipsaws.
Should traders use one HMA or two?
A single HMA emphasizes turning points and trend direction. Two HMAs can provide trend alignment and crossover signals, but they add complexity and may delay entries. The choice should be evaluated through consistent backtesting.
Disclaimer: Technical indicators, historical results, and backtested strategies cannot guarantee future performance. Cryptocurrency trading involves substantial risk of loss.