For crypto day traders and swing traders, using both indicators can filter some weak buy and sell signals before entering a position. The approach works best when indicator readings agree with price action, support and resistance levels, and the broader trend. Agreement doesn't guarantee a profitable trade, however.
Key Takeaways
-
RSI measures momentum between 0 and 100, with readings above 70 traditionally indicating overbought conditions and below 30 indicating oversold conditions.
-
MACD confirms changes in momentum through signal-line crossovers, zero-line positioning, and histogram movements.
-
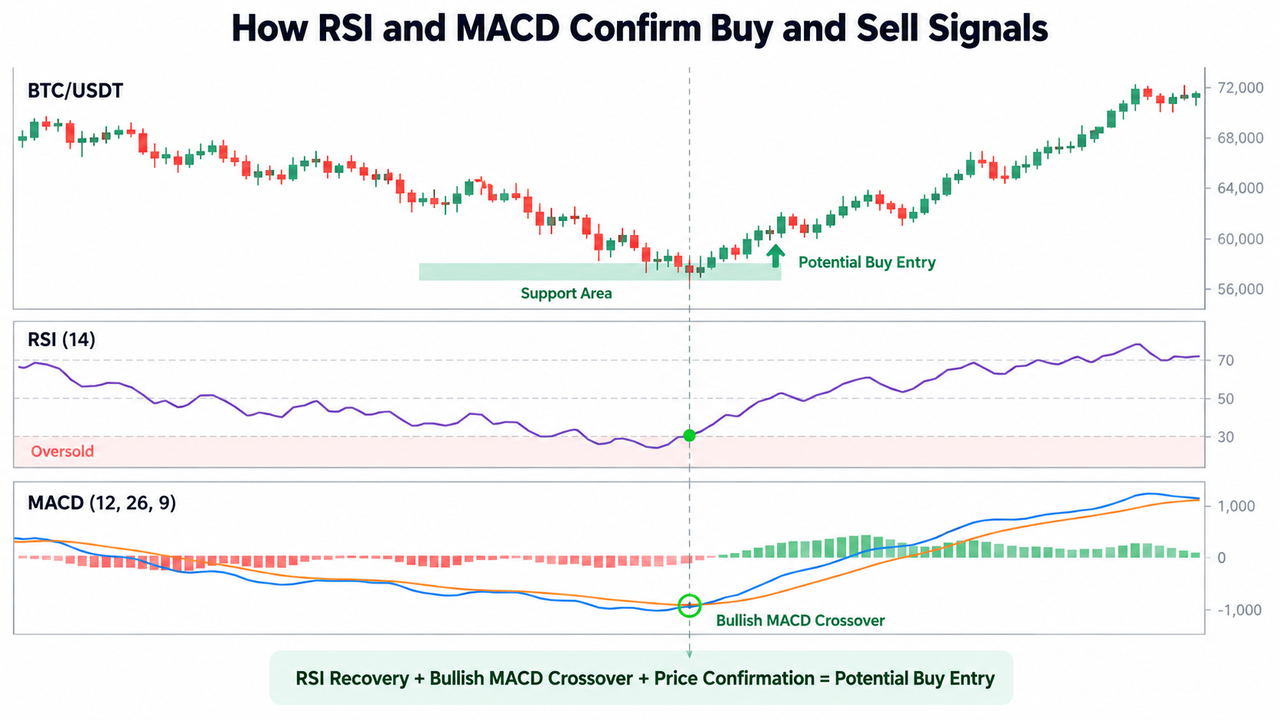
A potential bullish entry occurs when RSI recovers from oversold territory and MACD crosses above its signal line.
-
Combining MACD and RSI can reduce some false signals, especially when price structure and trend direction support the setup.
-
Entry confirmation should include stop-loss placement, position sizing, and historical backtesting.
How Do MACD and RSI Work Together?
MACD and RSI are technical indicators that analyze price momentum differently.
The Relative Strength Index is a momentum oscillator calculated using average gains and losses over a selected period, commonly 14 candles. RSI values range from 0 to 100.
An RSI above 50 generally indicates bullish momentum, while a reading below 50 suggests bearish momentum. Levels above 70 and below 30 identify potentially overbought and oversold conditions.
The MACD indicator measures the relationship between two exponential moving averages, helping traders identify trend direction and changes in momentum.
Together, the indicators answer two questions:
-
RSI: Is buying or selling momentum strengthening, weakening, or reaching an extreme?
-
MACD: Is the movement gaining confirmation from the relationship between shorter- and longer-term moving averages?
As Fidelity's RSI reference explains, RSI can remain at extreme levels during strong trends. An overbought reading alone isn't a sell signal.
Understanding MACD Line Crossovers and the MACD Histogram
The MACD indicator consists of a MACD line, signal line, and histogram.
Standard MACD settings are 12, 26, and 9:
-
MACD line: 12-period EMA minus 26-period EMA.
-
Signal line: A 9-period EMA of the MACD line.
-
MACD histogram: The difference between the MACD line and signal line.
The indicator uses exponential moving averages of an asset's closing price. According to Fidelity's MACD technical reference, these relationships help identify momentum shifts and possible trend changes.
A bullish crossover occurs when the MACD line crosses above the signal line. A bearish crossover occurs when the MACD line crosses below it.
The zero line adds context. MACD above zero means the shorter EMA exceeds the longer EMA, while MACD below zero indicates the opposite.
Meanwhile, a positive, expanding MACD histogram suggests strengthening bullish momentum. A shrinking histogram indicates weakening momentum, although it doesn't automatically confirm a reversal.
RSI and MACD Strategy: Entry Confirmation Rules
Combining MACD with RSI works best when traders establish entry conditions before receiving trading signals.
| Confirmation |
Bullish Entry |
Bearish Entry |
| RSI reading |
RSI rises above 30 or recovers above 50 |
RSI falls below 70 or drops below 50 |
| MACD crossover |
MACD crosses above signal line |
MACD crosses below signal line |
| MACD histogram |
Negative bars shrink or positive bars expand |
Positive bars shrink or negative bars expand |
| Price action |
Support holds or resistance breaks |
Resistance holds or support breaks |
| Broader trend |
Higher highs and higher lows |
Lower highs and lower lows |
These are illustrative trading rules, not universal entry requirements. A trader may prioritize trend continuation over reversals depending on market conditions.
Bullish MACD Crossover Strategy
Consider Bitcoin recovering after a decline.
RSI initially falls to 27, indicating oversold conditions. It subsequently rises above 30, suggesting downward momentum is weakening.
On the MACD chart, the MACD line crosses above the signal line while negative histogram bars contract.
If Bitcoin also forms a higher low near support, the indicators align with improving price action.
The bullish signal occurs when RSI recovery and the MACD crossover support the same direction. A trader might wait for the candle to close before evaluating an entry, reducing the risk of acting on an unfinished crossover.
Bearish MACD and RSI Confirmation
The opposite setup can identify weakening bullish pressure.
Suppose RSI reaches 74 before falling below 70. Meanwhile, the MACD line crosses beneath its signal line and the histogram contracts.
If price simultaneously fails to break resistance, the combination suggests upward momentum may be fading.
This bearish signal can help traders evaluate long-position exit points or potential short entries where permitted. It doesn't prove that a sustained downtrend has begun.
How to Use RSI and MACD for Entry Confirmation: Step by Step
A repeatable MACD RSI strategy separates trend identification, momentum confirmation, and execution.
Step 1: Identify the established trend.
Review market structure and a higher-timeframe moving average. For example, the 50-period EMA can help traders judge whether price is trading within an upward or downward trend.
Step 2: Apply RSI and MACD settings.
Start with RSI 14 and MACD 12,26,9. Shorter settings react faster but may generate more false signals.
Step 3: Check RSI momentum.
Look for RSI recovering from oversold territory, moving above 50, or showing renewed momentum after a pullback.
Step 4: Confirm with MACD signals.
Check whether MACD crosses its signal line in the intended direction. Histogram changes and zero-line positioning provide additional context.
Step 5: Validate price and risk.
Use support and resistance levels to identify meaningful entry areas and invalidation points.
For example, a trader evaluating the BTC/USDT spot market on Gate.com can compare RSI recovery with a bullish MACD crossover before checking whether Bitcoin has reclaimed a previous resistance level.
A stop-loss below the relevant swing low would define a possible exit if that bullish setup fails.
Choosing MACD Settings and RSI Parameters
The default RSI 14 and MACD 12,26,9 configuration is a reasonable starting point for different trading styles.
| Trading Style |
RSI Settings |
MACD Settings |
Main Consideration |
| Scalping |
7–9 |
5,13,5 |
Faster signals, greater noise |
| Day trading |
14 |
12,26,9 |
Balanced confirmation |
| Swing trading |
14–21 |
12,26,9 |
Smoother signals, possible delay |
These are starting configurations, not proven optimal settings.
Short-term traders experimenting with RSI settings for day trading should also test MACD sensitivity rather than adjusting both indicators repeatedly without a clear reason.
When Combining MACD and RSI Generates False Signals
Both indicators rely on historical price data, so combining them doesn't create two entirely independent sources of confirmation.
In sideways markets, repeated MACD line crossovers may occur without a sustained directional move. RSI can also move around its midpoint without producing useful entry signals.
Strong trending markets create another problem. RSI may stay above 70 during a bullish trend, while MACD continues showing positive momentum. Selling immediately because RSI enters overbought territory could mean exiting before the trend ends.
Divergences between price action and RSI or MACD can warn of possible trend reversals, but divergence may persist without an immediate price response.
Traders can improve their decision process by checking indicator combinations that reduce false signals alongside trading volume, market structure, and multiple timeframes.
As Charles Schwab's momentum analysis emphasizes, momentum readings need interpretation within the prevailing trend.
Backtesting the RSI and MACD Strategy
Backtesting helps determine whether a specific combination of RSI thresholds and MACD crossovers has produced usable results under defined market conditions.
Record entry and exit points, transaction costs, maximum drawdown, win rate, and average gains versus losses across different market environments.
Claims that an RSI and MACD strategy achieves a 73% win rate across 235 trades, averaging 0.88% per trade, cannot establish general effectiveness without a verifiable dataset, exact trading rules, timeframe, and testing methodology.
Past performance also doesn't guarantee future results. Slippage, fees, execution delays, and changing volatility can materially affect live trading performance.
Conclusion
An RSI and MACD strategy is most useful when RSI identifies momentum changes and MACD confirms their direction through line crossovers and histogram behavior.
The strongest practical setups combine these readings with an established trend, clear price structure, and predetermined risk limits.
Neither indicator independently predicts market movements. Waiting for confirmation can reduce impulsive entries, but it may also produce later entry prices or miss opportunities entirely.
Frequently Asked Questions
What is the best RSI and MACD strategy for beginners?
A practical starting approach uses RSI 14 and MACD 12,26,9. Traders can look for RSI crossing above 50 alongside a bullish MACD crossover while the broader trend remains upward. These conditions require testing before live use.
Should RSI or MACD confirm an entry first?
RSI sometimes reacts earlier to momentum changes, while MACD may provide later confirmation through its signal-line crossover. The order isn't fixed, and neither reading guarantees a successful entry.
Can RSI and MACD confirm trend reversals?
Both indicators can suggest potential reversals through momentum divergences, RSI extremes, and MACD crossovers. However, confirmation from market structure is needed because indicators can produce premature reversal signals.
Is the RSI and MACD strategy effective for crypto scalping?
It can be used for scalping, but shorter indicator periods often increase market noise. Liquidity, spreads, trading fees, and execution speed can have a greater effect on short-term results.
What happens when RSI and MACD disagree?
Conflicting readings indicate that momentum and trend confirmation aren't aligned under the chosen rules. Traders may wait for clearer price action rather than treating either indicator as automatically correct.
Disclaimer
This content is for educational purposes only and does not constitute financial or investment advice. Cryptocurrency trading involves substantial risk, including rapid price movements and potential loss of capital. Technical indicators and historical backtesting cannot guarantee future performance. Assess market conditions, position sizing, and individual risk tolerance before making trading decisions.