For crypto scalpers and day traders, adjusting MACD settings changes how quickly buy and sell signals appear. Faster signals can improve timing, but they also increase the risk of reacting to temporary price movements. Choosing a configuration means balancing responsiveness, market noise, and confirmation from price action.
Key Takeaways
-
The default MACD settings are 12-26-9, commonly used for trend and momentum analysis.
-
The 8-17-9 and 5-13-5 configurations provide faster responses for short-term crypto trading.
-
Settings such as 3-10-1 generate highly sensitive signals but increase false crossovers.
-
MACD crossovers, histogram movements, and divergences help identify potential momentum changes.
-
Combining MACD with trend lines, volume, and risk management can improve trade selection.
How Does the MACD Indicator Work?
Moving Average Convergence Divergence (MACD) is a trend-following momentum indicator that measures the difference between two exponential moving averages.
The MACD indicator contains three components:
-
MACD line: The difference between the fast and slow EMAs.
-
Signal line: A smoothed average of the MACD line, usually calculated using a nine-period EMA.
-
MACD histogram: The difference between the MACD line and signal line.
The standard calculation is:
MACD Line = 12-period EMA − 26-period EMA
Signal Line = 9-period EMA of MACD Line
Histogram = MACD Line − Signal Line
According to Fidelity's MACD indicator reference, traders commonly interpret signal-line crossovers and zero-line movements as changes in trend momentum.
Unlike the Relative Strength Index (RSI), MACD has no fixed upper or lower boundary. It measures the relationship between moving averages rather than identifying overbought or oversold conditions using a fixed scale.
Default MACD Settings vs Faster Configurations
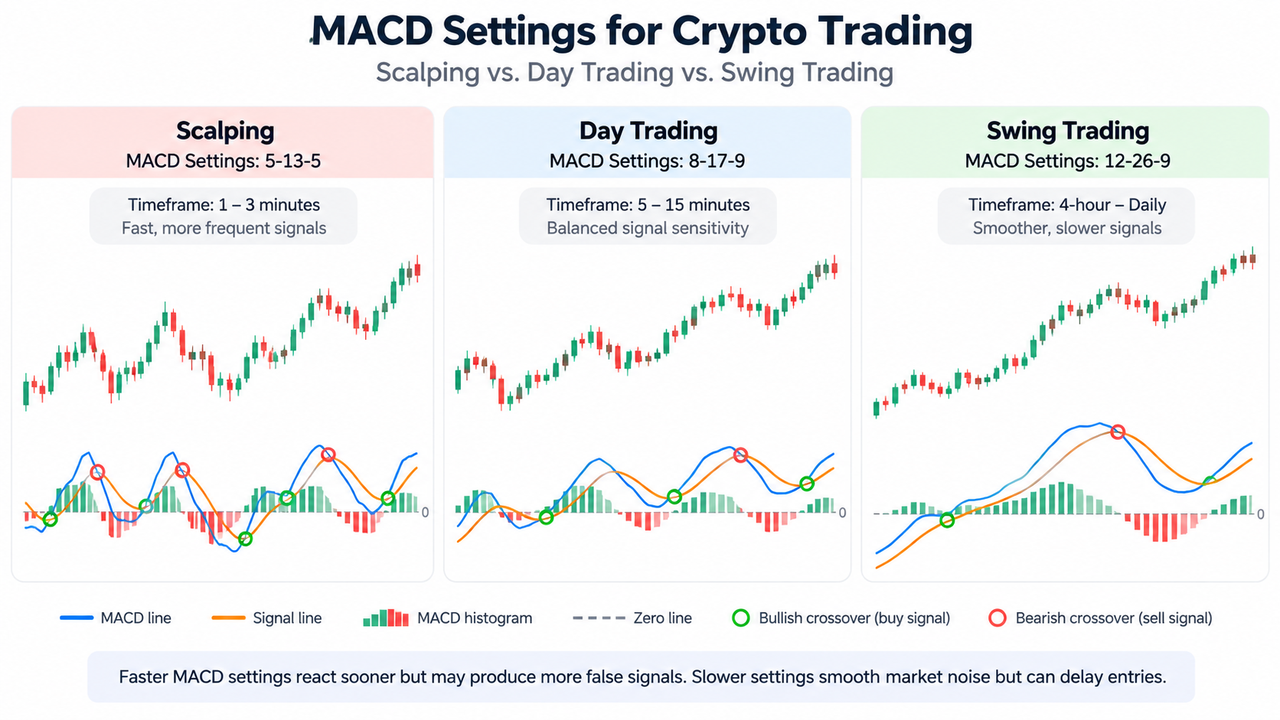
The default MACD settings of 12-26-9 use a 12-period fast EMA, 26-period slow EMA, and nine-period signal line.
These parameters work on daily charts, weekly charts, and intraday charts. However, the standard configuration may respond too slowly for certain scalping strategies.
Shortening the EMA periods increases sensitivity, while extending them generally produces smoother signals.
| MACD Settings |
Typical Application |
Main Tradeoff |
| 12/26/2009 |
Swing trading, daily charts |
Smoother but slower |
| 8/17/2009 |
Day trading, 5–15-minute charts |
Balanced responsiveness |
| 5/13/2005 |
Short-term scalping |
Faster but noisier |
| 5-35-5 |
Scalping with broader EMA separation |
Wider trend lookback, fast signal smoothing |
| 3/10/2016 |
Experienced intraday traders |
Fast oscillator, heavily smoothed signal |
| 3/10/2001 |
Very fast scalping |
Extremely sensitive crossovers |
These are experimental starting points, not universally optimal MACD settings. Their effectiveness depends on volatility, liquidity, trading costs, and the individual market.
The 5-35-5 configuration deserves particular attention. Although sometimes suggested for scalping, its 35-period slow EMA means it isn't uniformly faster than 12-26-9. Likewise, 3-10-16 uses a fast oscillator but a relatively slow signal line.
Best MACD Settings for Intraday Traders
8-17-9 for Day Trading
The 8-17-9 configuration is a practical starting point for intraday traders using five-minute or 15-minute charts.
Its shorter exponential moving averages respond to price momentum more quickly than the default settings, while the nine-period signal line retains some smoothing.
This configuration may suit traders looking for pullback entries or momentum continuation signals.
It works particularly well as a candidate for testing alongside moving average settings for day trading, where the broader price trend helps determine whether a crossover supports the prevailing direction.
5-13-5 for Short-Term Scalping
The 5-13-5 MACD setting uses shorter averages and a faster signal line, making momentum changes visible sooner.
On a one-minute or three-minute chart, the MACD histogram can change direction rapidly.
For example, a trader monitoring BTC/USDT might observe the MACD line crossing above the signal line while price breaks a short-term resistance level.
That combination can suggest potential bullish momentum, but the crossover alone doesn't establish a reliable entry.
The EMA settings used for crypto scalping can help assess whether short-term price direction supports the signal.
3-10-1 and 3-10-16 for Faster Trading Strategies
The 3-10-1 setting produces highly responsive MACD crossovers because the signal line uses just one period.
However, a one-period signal EMA equals the MACD line itself. Consequently, the histogram stays at zero and genuine signal-line crossovers do not occur. This makes 3-10-1 unsuitable for conventional MACD crossover strategies, despite its appearance in some scalping discussions.
The 3-10-16 configuration is different. Its fast MACD line reacts quickly, but the 16-period signal line smooths those changes over a longer period.
Neither configuration guarantees earlier profitable entry and exit points.
How to Adjust MACD Settings on a Crypto Chart
Changing MACD parameters usually takes a few steps.
-
Select the timeframe. Choose a one-minute, five-minute, or 15-minute chart according to the intended holding period.
-
Add the MACD indicator. Open the technical indicators menu and select Moving Average Convergence Divergence.
-
Enter the parameters. Set the fast EMA, slow EMA, and signal-line periods, such as 8, 17, and 9.
-
Compare crossover behaviour. Observe how the MACD line crosses the signal line under the new settings.
-
Check the higher timeframe. Compare short-term signals against the broader market trend.
-
Test before execution. Review historical signals and account for fees, slippage, and unsuccessful trades.
TradingView's MACD documentation identifies fast length, slow length, signal length, moving-average type, and timeframe as configurable inputs.
A trader examining BTC/USDT on Gate.com can compare Bitcoin market data with MACD signals to assess whether momentum changes coincide with meaningful price movements.
How MACD Crossovers and Bearish Divergence Affect Trading Decisions
Reading MACD Crossovers and the Signal Line
A bullish crossover occurs when the MACD line moves above the signal line, suggesting improving upward momentum.
A bearish crossover occurs when the MACD line falls below the signal line, suggesting increasing downward momentum.
The zero line provides additional context. MACD above zero indicates that the fast EMA exceeds the slow EMA, while readings below zero indicate the opposite.
When the MACD histogram rises, the relationship between MACD and its signal line is becoming more positive. That may reflect strengthening bullish momentum or weakening bearish momentum, depending on its position relative to zero.
Bullish and Bearish Divergence
MACD divergences develop when price action and indicator momentum disagree.
Bullish divergence occurs when price makes lower lows while MACD forms higher lows. It may indicate weakening selling pressure.
Bearish divergence develops when price makes higher highs while MACD forms lower highs, suggesting weakening buying momentum.
Divergence can precede a trend reversal, but it may persist while prices continue in their original direction.
Support and resistance levels provide useful confirmation because price structure indicators identify areas where buyers or sellers previously responded.
Combining MACD With Other Technical Indicators
MACD signals become more useful when interpreted alongside independent evidence.
A common approach combines MACD with trend lines, volume, and the relative strength index.
For instance, a bullish MACD crossover becomes more interesting when price holds above an upward trend line and trading volume increases.
Volume indicators for crypto trading help assess whether participation supports the move.
Conversely, traders may avoid crossover-based entries during sideways markets, where MACD frequently switches direction without establishing a sustained trend.
Risks of Adjusting MACD Settings
MACD is a lagging indicator because its calculations depend on historical prices.
Faster MACD settings reduce some smoothing delay but introduce more market noise. A sudden candle can create a bullish signal that disappears before a meaningful trend develops.
Intraday traders should also consider liquidity, trading fees, stop-loss placement, and position sizing.
Risk management techniques matter particularly when trading leveraged products, where small adverse price movements can produce disproportionately large losses.
Testing several market conditions is more informative than selecting parameters based on a few successful historical trades.
Conclusion
Adjusting MACD settings helps short-term crypto traders match momentum signals to their trading timeframe.
The 8-17-9 configuration is a reasonable day-trading starting point, while 5-13-5 reacts faster for scalping. The default 12-26-9 remains useful when traders prefer smoother signals.
No configuration consistently eliminates false signals. MACD works best when crossover signals agree with price structure, trend direction, and appropriate risk controls.
Frequently Asked Questions
What Are the Best MACD Settings for a 5-Minute Chart?
The 8-17-9 and 5-13-5 configurations are useful starting points for testing on a five-minute crypto chart. The former provides more smoothing, while the latter reacts faster to price changes.
Is 12-26-9 MACD Too Slow for Day Trading?
Not necessarily. The standard 12-26-9 MACD can work on intraday charts, although traders seeking earlier momentum signals may prefer shorter EMA periods.
Can MACD Predict Crypto Price Reversals?
MACD can identify weakening momentum, divergence, and potential turning points. However, these signals do not reliably predict when a reversal will occur.
Which MACD Settings Work Best for Swing Trading?
The default 12-26-9 configuration is widely used for swing trading. Traders can apply it to four-hour or daily charts and compare signals with broader trends.
How Can Traders Reduce False MACD Signals?
Traders can combine MACD crossovers with trend lines, volume confirmation, support and resistance, and higher-timeframe direction. Waiting for candle closes can also reduce reactions to unfinished signals.
Disclaimer: This content is for educational purposes only and does not constitute financial advice. Technical indicators and historical market behaviour do not guarantee future trading outcomes. Cryptocurrency trading involves substantial risk, including the potential loss of capital.