For crypto traders dealing with unpredictable price movements, recognizing a sideways market can prevent unnecessary trades and improve entry timing. The challenge is distinguishing genuine range-bound price action from temporary consolidation before a breakout. Combining trend strength, momentum, volatility, and volume indicators helps make that distinction.
Key Takeaways
-
A sideways market occurs when prices fluctuate between relatively stable support and resistance levels without establishing a clear directional trend.
-
ADX readings below 25, tightening Bollinger Bands, and declining ATR often indicate weak trends or market consolidation.
-
RSI and Stochastic Oscillator help identify overbought and oversold conditions near trading range boundaries.
-
Flat On-Balance Volume and weak MACD momentum can support a sideways market interpretation.
-
Indicators work best alongside price action, trading volume, and risk management rather than as standalone signals.
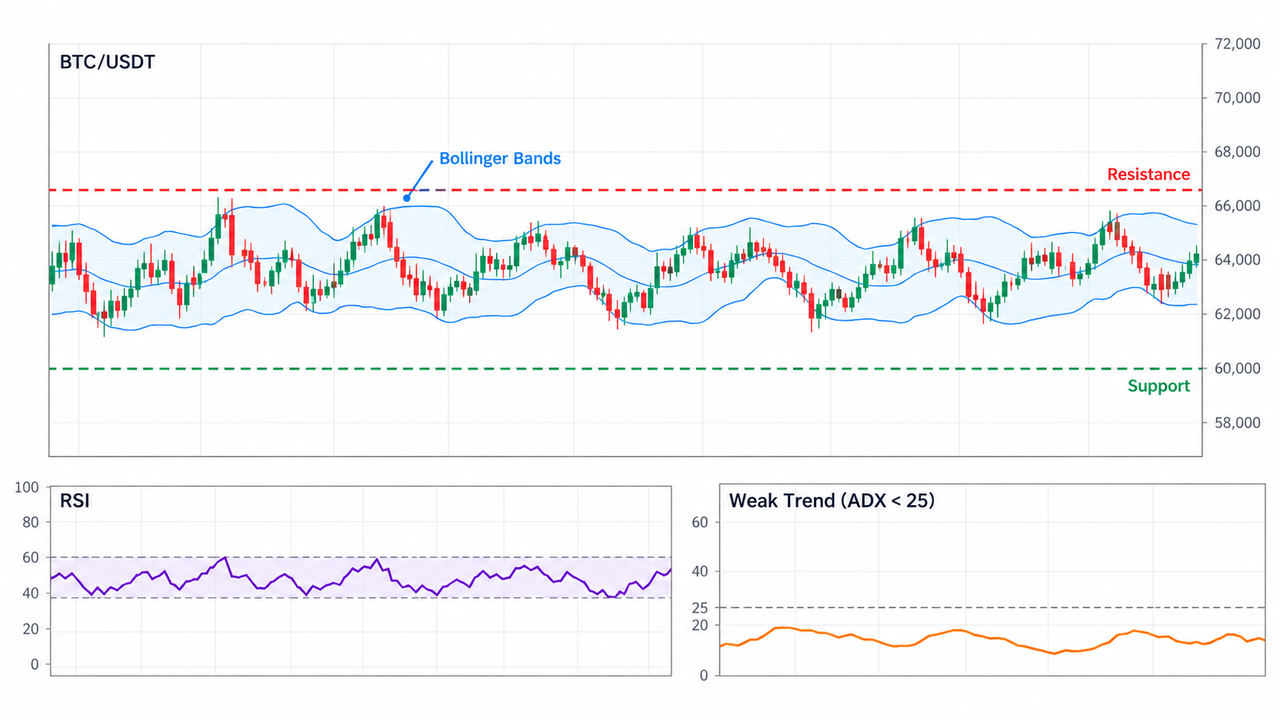
What Is a Sideways Market?
A sideways market occurs when an underlying asset trades within a horizontal range instead of maintaining an upward or downward trend.
Prices repeatedly test support and resistance levels without consistently establishing higher highs and higher lows or lower highs and lower lows.
For example, if Bitcoin fluctuates between $65,000 and $68,000 for several sessions, traders may identify a defined trading range. Buying interest appears near support, while selling pressure increases around resistance.
A range-bound market often features declining volume, low momentum, and relatively narrow price movements. However, consolidation can also occur in highly volatile markets.
Unlike trend-following indicators, which attempt to capture sustained price direction, sideways-market indicators focus on recognizing boundaries, weakening momentum, and possible turning points.
10 Best Indicators for Sideways Market Trading
The following indicators serve different purposes. Some identify whether a trend exists, while others measure volatility, momentum, or participation within a defined range.
-
Bollinger Bands: Identify Range Bound Price Action
Bollinger Bands consist of a middle moving average and upper and lower bands calculated using standard deviation.
The common configuration uses a 20-period simple moving average with bands positioned two standard deviations above and below it.
During a sideways market, price often oscillates between the upper and lower bands. Narrowing bands suggest declining market volatility.
A Bollinger Band Squeeze occurs when the bands contract significantly, indicating high price compression. It can precede a new trend, but doesn't predict breakout direction.
Traders sometimes examine potential reversals near the upper band or lower band, especially when price approaches established resistance or support.
The catch is that band touches aren't automatic signals. Strong trends can keep prices near one band for extended periods.
-
Relative Strength Index (RSI): Measure Overbought and Oversold Conditions
The Relative Strength Index measures the speed and magnitude of recent price changes on a scale from 0 to 100.
Traditionally, readings above 70 indicate overbought territory, while readings below 30 suggest oversold conditions.
In a narrow sideways market, RSI may remain between 40 and 60, reflecting balanced buying momentum and selling pressure.
Wider trading ranges can allow RSI to approach traditional overbought or oversold thresholds.
For example, if price tests resistance while RSI approaches 70, traders may watch for rejection candlestick patterns. RSI alone cannot establish that a reversal will occur.
-
Average Directional Index (ADX): Confirm a Range Bound Market
The Average Directional Index, or ADX indicator, measures trend strength regardless of price direction.
Readings below 25 are commonly interpreted as weak-trend conditions, with values below 20 providing stronger evidence of a non-existent or very weak trend.
An ADX reading above 25 generally suggests strengthening directional movement.
Importantly, a low ADX doesn't prove that a market is sideways. Price action must also show a horizontal range.
The ADX indicator is particularly useful for deciding whether trend-following strategies are appropriate or whether range-based analysis deserves greater attention.
-
Stochastic Oscillator: Identify Range Reversals
The Stochastic Oscillator compares the latest closing price with the asset's high-low range over a selected period.
Readings above 80 traditionally indicate overbought conditions, while values below 20 suggest oversold conditions.
In a range-bound market, traders often monitor crossings between the %K and %D signal lines near these extremes.
A bullish crossover near support may suggest improving buying momentum. A bearish crossover near resistance can indicate weakening demand.
Like other leading indicators, Stochastic can produce false signals if price breaks outside the established range.
-
Average True Range (ATR): Measure Market Volatility
Average True Range measures the average magnitude of price movements, including gaps between trading periods.
A declining ATR often indicates shrinking price swings and a consolidation phase.
For example, if an asset's daily ATR falls from $200 to $80 while prices remain within the same horizontal range, volatility has contracted.
ATR doesn't indicate price direction. Instead, it helps assess whether the trading range provides enough movement to justify transaction costs.
The ATR indicator can also inform stop-loss distances, although low volatility doesn't eliminate sudden breakout risk.
-
Moving Averages: Recognize a Flat Market Structure
Moving averages smooth historical price data to reveal the average price over a selected period.
During sideways markets, shorter and longer moving averages often flatten, converge, or repeatedly cross each other.
For example, a 20-period and 50-period moving average moving horizontally may indicate weak directional momentum.
Repeated crossings generate market noise, making conventional trend signals less reliable.
Traders can compare the SMA and EMA to understand how different smoothing methods respond to small price changes.
-
Moving Average Convergence Divergence (MACD): Detect Low Momentum
The Moving Average Convergence Divergence indicator compares two exponential moving averages to evaluate changes in momentum.
During consolidation, the MACD line and signal line frequently cross near the zero line.
A relatively flat histogram indicates limited momentum separation.
Such conditions suggest neither buying nor selling pressure has established sustained control.
However, repeated crossovers may produce misleading entry signals. MACD becomes more informative when expanding momentum accompanies a break beyond support or resistance.
-
On-Balance Volume (OBV): Check Market Participation
On-Balance Volume tracks cumulative trading volume, adding volume on upward closing periods and subtracting it on downward closing periods.
A relatively flat OBV line suggests limited net accumulation or distribution according to this indicator's calculation.
During consolidation, declining trading activity may show that market participants are waiting for a stronger directional move.
However, OBV cannot establish actual institutional accumulation or distribution by itself.
A breakout accompanied by rising volume and a decisive OBV movement may provide stronger confirmation than price movement alone.
-
Commodity Channel Index (CCI): Spot Price Extremes
The Commodity Channel Index measures how far an asset's typical price deviates from its statistical average.
CCI readings above +100 or below -100 indicate relatively strong positive or negative deviations.
Within a horizontal range, these extreme readings can help traders identify potential exhaustion near resistance or support.
CCI may be more sensitive than slower momentum oscillators, especially over short timeframes.
That sensitivity also creates false signals during abrupt price movements, so confirmation from candlestick patterns remains useful.
-
Bollinger Band Width: Identify Volatility Compression
Bollinger Band Width measures the distance between Bollinger Bands relative to their middle moving average.
Because its calculation incorporates standard deviation, narrowing Band Width reflects declining volatility.
Low readings may identify periods of unusually tight consolidation.
Combining Bollinger Bands with Band Width helps traders distinguish ordinary fluctuations between upper and lower bands from a high-compression squeeze.
A sharp increase in Band Width signals volatility expansion, although price direction requires separate confirmation.
How to Combine Bollinger Bands, RSI and the ADX Indicator
Combining indicators works best when each answers a different question.
| Indicator |
Main Question |
Typical Sideways Signal |
| Bollinger Bands |
Is volatility contracting? |
Narrowing upper and lower bands |
| RSI |
Is momentum reaching an extreme? |
Oscillation around 40–60 or turns near extremes |
| ADX |
Is a meaningful trend developing? |
ADX below 20–25 |
| ATR |
Are price swings shrinking? |
Declining ATR |
| OBV |
Is participation changing? |
Relatively flat volume trend |
For example, a trader monitoring the BTC/USDT spot market on Gate.com might identify a horizontal range, confirm weak trend strength using ADX, and examine RSI when price tests a boundary.
The strongest interpretation comes from agreement between different indicator categories, not from stacking several momentum oscillators.
Risks of Trading Sideways Markets
Range-bound trading strategies face several limitations.
False breakouts: Prices may briefly cross support or resistance before returning inside the range.
Unexpected volatility: Economic announcements, liquidations, or major market developments can trigger rapid directional moves.
Weak reward potential: Narrow ranges may leave insufficient room after spreads, trading fees, and slippage.
Stop-loss orders are often considered slightly outside range boundaries, adjusted for volatility and nearby liquidity. However, stops cannot guarantee execution at the intended price.
Traders should also distinguish a genuinely sideways market from a brief pause in a trending market.
Conclusion
The best indicators for sideways markets combine ADX for trend strength, Bollinger Bands and ATR for volatility, and RSI or Stochastic for potential reversals.
OBV, moving averages, and MACD add confirmation by showing whether momentum and participation remain weak.
No indicator can guarantee that a range will hold. Price structure, risk controls, and awareness of potential breakouts remain essential.
Frequently Asked Questions
What is the best indicator for a sideways market?
ADX is useful for identifying weak trends, while Bollinger Bands help visualize price compression and trading ranges. RSI provides additional information about overbought and oversold conditions. Combining different indicator types generally gives a more complete assessment.
Does an ADX below 25 mean the market is sideways?
An ADX below 25 commonly indicates weak trend strength, but doesn't independently confirm a sideways market. Horizontal support and resistance, subdued volatility, and overlapping price movements provide supporting evidence.
What RSI settings work best in sideways markets?
The standard 14-period RSI is a common starting point. Readings around 40–60 can indicate subdued momentum, while 70 and 30 remain conventional overbought and oversold reference levels. Settings depend on the asset, timeframe, and range width.
Can Bollinger Bands predict a breakout?
Bollinger Band squeezes identify volatility compression, which sometimes precedes a stronger price movement. They cannot reliably predict whether the breakout will occur upward or downward. Volume and price confirmation remain necessary.
Does a Put/Call Ratio near 1 indicate a sideways market?
A Put/Call Ratio between approximately 0.95 and 1.05 may suggest balanced options activity for a particular options market, but it isn't a universal sideways-market threshold. Interpretation depends on the underlying asset, contract type, and historical ratio. Crypto spot markets may not have comparable options data.
Is sideways-market trading profitable?
Some traders attempt to profit from repeated movements between support and resistance. Actual results depend on range width, execution costs, liquidity, position sizing, and unexpected breakouts. Low volatility can reduce opportunities, while sudden price expansion can produce losses.
Disclaimer: This content is provided for educational purposes only and does not constitute financial or investment advice. Technical indicators are based on historical market data and cannot guarantee future trading results. Cryptocurrency markets involve substantial volatility and potential capital loss. Trading products, permissions, and regulatory requirements may vary by jurisdiction.







