For day trading and swing traders, this approach helps distinguish a promising breakout setup from a temporary price jump. The challenge is recognizing momentum early without treating every bullish indicator reading as a buy signal. Strong momentum can develop before a breakout, but it doesn't guarantee one will happen.
Key Takeaways
-
A momentum breakout setup often begins with price consolidation, strengthening buying pressure, and a test of resistance.
-
RSI, MACD, and On-Balance Volume help assess momentum intensity before price breaks out.
-
Bollinger Band compression and declining ATR indicate reduced volatility, although neither predicts breakout direction.
-
A candle closing above resistance with increasing trading volume provides stronger confirmation than an intrabar price spike.
-
Combining indicators with support and resistance, stop-loss planning, and position sizing helps manage false breakout risk.
What Is a Momentum Breakout in Crypto Trading?
A momentum breakout occurs when cryptocurrency price moves beyond an established support or resistance level while the strength of that move increases.
For a bullish breakout, traders look for upward momentum building as price approaches resistance. A bearish breakout involves growing selling pressure near support.
Momentum trading follows an asset's existing price direction. Unlike traditional buy-low, sell-high investing, a momentum trader may buy high with the expectation of selling higher. This trading approach became widely associated with investor Richard Driehaus during the 1980s.
Momentum trading strategies apply across stocks, forex, and crypto. They rely partly on market participation and behavioral forces such as fear of missing out, although momentum can reverse abruptly.
The practical question is whether a rising current price reflects sustained demand or merely a short-lived reaction.
How to Identify Momentum Before a Crypto Breakout
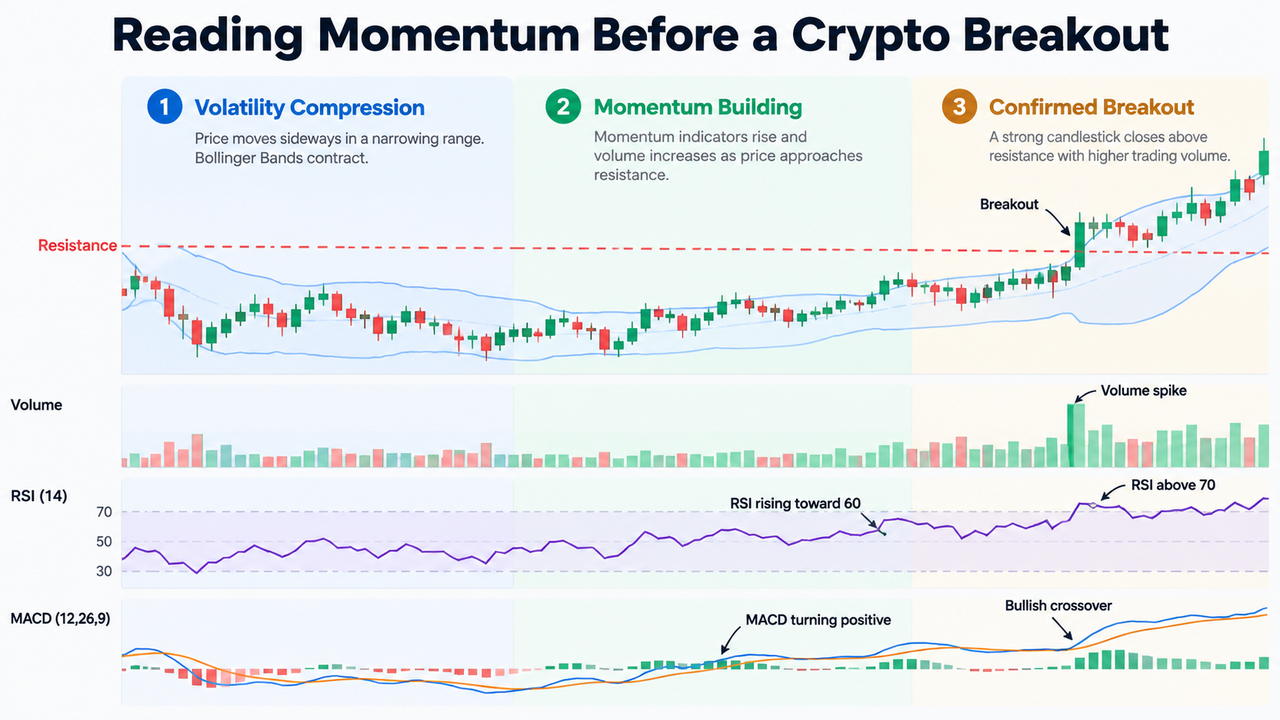
A breakout setup often starts with a narrowing trading range. Buyers repeatedly test resistance, while sellers struggle to push price significantly lower.
Three developments deserve attention.
-
Identify Volatility Compression and Chart Patterns
A Bollinger Band Squeeze occurs when the upper and lower bands move closer together, indicating reduced volatility.
The Bollinger Bands framework explains why narrow bands can precede a sharp move in either direction.
Average True Range (ATR) may also decline during consolidation. Contracting ATR alongside a tightening range suggests smaller recent price movements.
Chart patterns such as ascending triangles, flags, and rectangles can provide additional structure. A bullish engulfing candle near resistance may indicate increasing demand, but candle patterns alone are insufficient confirmation.
Traders should first validate support and resistance levels before interpreting a price move as a breakout.
-
Check Whether Momentum Is Strengthening
Momentum indicators measure changes in price strength, often before a visible trend becomes established.
For example, RSI moving from 45 toward 60 while price remains below resistance may suggest that buyers are gaining momentum.
A rising MACD histogram can provide supporting evidence. However, several momentum indicators may respond to the same underlying price changes, so agreement doesn't necessarily represent independent confirmation.
-
Look for Volume Backing
Trading volume helps assess market participation.
An upward price move accompanied by expanding volume generally carries more supporting evidence than a breakout occurring on unusually low volume.
On-Balance Volume (OBV) can rise while price remains inside a range, potentially suggesting accumulation.
Still, a low-volume breakout isn't automatically false, and a volume spike doesn't guarantee continuation. Both require confirmation from subsequent price behavior.
Best Momentum Indicators for Crypto Breakout Confirmation
The best momentum indicators reveal different aspects of market behavior. RSI tracks momentum strength, MACD measures changes in trend momentum, and OBV estimates directional volume pressure.
| Indicator |
Important reading |
Breakout interpretation |
| Relative Strength Index (RSI) |
Above 70 overbought; below 30 oversold |
Rising RSI suggests strengthening momentum |
| MACD |
MACD line crossing above signal line |
Potential bullish momentum shift |
| OBV |
Rising while price consolidates |
Possible accumulation |
| ADX |
0–100 scale; above 25 commonly indicates stronger trend |
Measures trend strength, not direction |
| Stochastic |
Above 80 overbought; below 20 oversold |
Shows closing-price position within a recent range |
| CCI |
Above +100 |
Indicates unusually strong upward price movement |
| Bollinger Bands |
Narrowing bands |
Signals volatility compression |
| ATR |
Declining ATR |
Indicates contracting recent price ranges |
These readings are conventions rather than fixed trading rules. Timeframe, volatility, and the current market trend can change their usefulness.
Relative Strength Index and Hidden Bullish Divergence
The Relative Strength Index measures the speed and magnitude of recent price changes on a 0–100 scale.
Traditional overbought and oversold levels are 70 and 30. However, an RSI reading above 70 doesn't automatically justify selling. Strong uptrends can remain overbought for extended periods.
Hidden bullish divergence occurs when price forms a higher low while RSI forms a lower low. It may suggest trend continuation after a pullback, though it doesn't predict a breakout by itself.
MACD and Moving Average Momentum
Moving Average Convergence Divergence (MACD) commonly subtracts the 26-period exponential moving average from the 12-period EMA. A nine-period EMA of the MACD line forms the signal line.
A bullish crossover, especially with an expanding positive histogram, can suggest strengthening upward momentum.
The RSI and MACD strategy combines momentum strength with directional confirmation. Traders should still check price structure because MACD may generate repeated buy and sell signals in sideways markets.
OBV, ADX, and Relative Strength
OBV measures cumulative volume flow by adding volume after higher closes and subtracting it after lower closes.
According to Fidelity's OBV explanation, rising OBV during a trading range may indicate accumulation before an upward breakout.
ADX, which ranges from 0 to 100, measures trend strength without identifying direction. Traders generally combine it with directional indicators or price analysis.
Relative strength comparisons against Bitcoin or another benchmark can also reveal whether an asset is outperforming the wider market.
Momentum Trading Strategies: A Practical Breakout Example
Consider a hypothetical cryptocurrency trading between $98 and $100 for several sessions.
Resistance sits near $100, while support remains around $98.
A trader observes:
-
Bollinger Bands narrowing and ATR declining.
-
RSI rising from 48 to 62.
-
MACD crossing above its signal line.
-
OBV trending upward despite sideways price movement.
-
Price closing at $101 with trading volume above its recent average.
The candle close above $100 provides price confirmation, while momentum and volume strengthen the setup.
A trader examining the BTC/USDT market on Gate.com could apply this same sequence to live charts rather than treating the hypothetical numbers as actual market levels.
Some traders enter after the breakout close. Others wait for a retest of previous resistance as potential support.
The second approach may reduce chasing, but price sometimes continues without returning to the breakout level.
The volume and ATR strategy combines participation and volatility measurements when evaluating these conditions.
How to Manage Risk in Momentum Trading
A convincing momentum breakout can still fail.
Price may briefly exceed resistance before returning inside its previous range. Weak volume, bearish divergence, and repeated failed closes are warning signs.
Traders can manage exposure through predefined trading rules:
-
Set invalidation levels: A close back inside the previous range may weaken the breakout thesis.
-
Control position size: Base exposure on risk tolerance and the distance to the stop loss.
-
Monitor volatility: Rising ATR can indicate expanding price swings and greater stop-loss uncertainty.
-
Watch momentum deterioration: Falling OBV or weakening MACD may suggest declining participation.
-
Avoid emotional entries: Jumping into an extended move out of hope or fear can create unfavorable risk-to-reward conditions.
A momentum trading strategy should define exit points before entry. Waiting for a clear trend reversal can sometimes mean surrendering substantial unrealized profit.
For beginners, testing rules with a demo account or paper trading and starting small may help reveal weaknesses without immediate exposure to live trading losses.
As the SEC's investor bulletin on performance claims emphasizes, past performance cannot predict future results.
Conclusion
Reading momentum before a crypto breakout requires evaluating price structure, strengthening momentum, volatility compression, and trading volume together.
RSI and MACD can identify momentum shifts, while OBV adds information about participation. A confirmed price close beyond resistance helps distinguish an actual breakout attempt from early indicator signals.
No indicator combination guarantees short-term gains. The strongest practical approach is to wait for price confirmation, assess conflicting signals, and define risk before entering a position.
Frequently Asked Questions
How do you know when a crypto breakout is coming?
Watch for narrowing price ranges, declining volatility, rising momentum indicators, and increasing OBV near resistance. These conditions can indicate an emerging breakout setup but cannot establish when or whether price will break out.
Is RSI or MACD better for momentum trading?
RSI is useful for measuring momentum intensity and identifying divergence. MACD helps assess changes in trend momentum and direction. Combining both can provide complementary information, although neither should replace price confirmation.
What volume confirms a crypto breakout?
Traders often compare breakout volume against its recent average over the same timeframe. Above-average volume can strengthen confirmation, but there is no universal percentage or multiplier that guarantees success.
Can a breakout happen without high trading volume?
Yes. Breakouts can occur with relatively low volume, particularly in thinly traded markets. However, limited participation may increase uncertainty about whether the move can continue.
Which timeframe works best for momentum breakout trading?
Day traders commonly use 5-minute, 15-minute, or hourly charts, while swing traders often prefer four-hour and daily charts. Shorter timeframes generate more signals but usually contain more market noise. Indicator settings should match the trading period.
Disclaimer
Cryptocurrency trading involves substantial risk, including market volatility and potential loss of capital. Technical indicators and historical performance do not guarantee future results.