This comparison is built for swing traders and crypto investors who use moving averages to read trend direction, time pullback entries, and reduce noise in fast-moving markets. It focuses on how SMA and EMA are calculated, where each performs well or falls short, how traders use EMA 20 vs EMA 50, moving-average crossovers, and combined indicator setups—while also making clear that no moving average should be used without additional tools and risk controls.
SMA can help confirm trend stability, EMA can improve entry timing, and how to choose between them based on trading style rather than treating one as the default.
TL;DR
-
SMA gives equal weight to every price in its calculation, creating a smoother but slower trend line.
-
EMA places greater weight on recent prices, allowing it to react faster to pullbacks, breakouts, and momentum changes.
-
Swing traders often use SMA for broader trend direction and EMA for shorter-term entry timing.
-
EMA 20 vs. EMA 50 compares short-term and intermediate exponential trends rather than comparing EMA with SMA.
-
Both indicators lag price and may produce misleading signals during sideways or highly volatile markets.
| Feature |
SMA |
EMA |
| Price weighting |
Equal weighting |
More weight on recent prices |
| Responsiveness |
Slower |
Faster |
| Primary strength |
Stable trend confirmation |
Earlier reaction to price changes |
| Common swing use |
Directional filter |
Pullbacks and entry timing |
| Market noise |
Filters more noise |
Reacts more strongly to noise |
| Main limitation |
Delayed signals |
More frequent false signals |
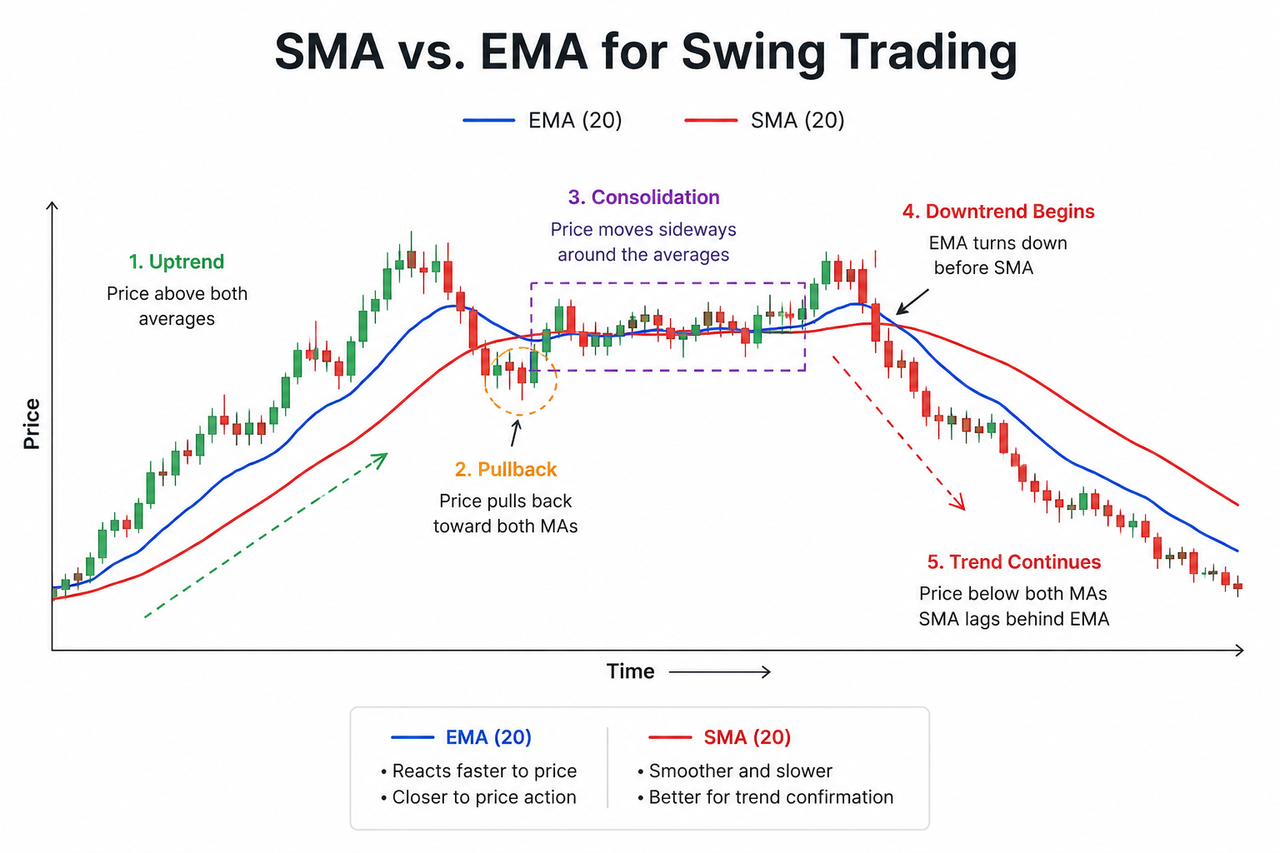
The central difference is responsiveness. EMA follows recent price more closely, while SMA changes gradually and provides a more stable representation of the prevailing trend.
What Is the SMA Indicator?
The Simple Moving Average calculates the arithmetic mean of price across a selected number of periods. Every closing price receives equal weight, so it treats all periods equally, including older values, whether it is the newest observation or the oldest value in the lookback window.
A 20-period SMA adds the latest 20 closing prices and divides the total by 20. When a new candle closes, the oldest value is removed and the newest value enters the calculation.
This equal-weighting method gives the SMA indicator its smooth appearance. A rising SMA generally supports a bullish trend interpretation, while a falling SMA indicates declining average prices. Longer SMAs, such as the 50-day or 200-day SMA, are often used for long-term trend analysis, helping swing traders identify major trends, filter short-term volatility, and assess the broader market structure.
The disadvantage is delay. Because old and new prices carry equal influence, a sudden breakout or reversal may take several periods to change the SMA’s direction meaningfully.
What Is the EMA Indicator?
The exponential moving average EMA assigns greater weight to recent price data and progressively less weight to older observations. This calculation gives it less lag because it reacts more quickly to current price action and recent data.
The EMA 20 indicator is commonly used to track shorter-term trends, momentum, and short term trading setups. During an established uptrend, price may retreat toward a rising EMA 20 before continuing higher. During a weakening trend, the EMA may flatten or turn downward before a comparable SMA reacts, and because it is sensitive to recent fluctuations and recent price movements, it can flag a trend change sooner.
Greater responsiveness does not guarantee greater accuracy, even though active traders often prefer that faster response. A short volatility spike can pull EMA toward price even when the broader market structure remains unchanged. EMA therefore provides faster information, but it may also generate more false signals.
How Do SMA and EMA Calculations Differ?
SMA and EMA use the same underlying price data but apply different weighting methods.
The SMA formula is:
SMA = Sum of closing prices over N periods ÷ N
EMA uses a smoothing multiplier:
Multiplier = 2 ÷ (N + 1)
For a 20-day EMA, the smoothing factor, or multiplier, is 0.0952.
The current EMA is then calculated from the current price, the previous EMA, and the multiplier.
For a five-period SMA, each of the five data points receives 20% weighting, so each one carries the same weight. A five-period EMA gives the newest closing price a substantially larger influence, with the effect of older prices declining over time.
This difference becomes most visible after a sharp price movement. EMA bends toward the new price sooner, while SMA continues to reflect more of the preceding range. Neither indicator predicts future results or future performance. Both describe how historical data and past performance are changing.
Which Is Better for Identifying a Swing-Trading Trend?
SMA is usually more suitable for confirming an established trend, while EMA is generally more useful for identifying shorter-term changes within that trend. In smoother market conditions, SMA can provide stable signals and fewer false signals when the goal is to confirm direction rather than react quickly.
A rising SMA with price holding above it can help filter bearish-looking fluctuations that remain part of a broader uptrend. A falling SMA with price remaining below it can provide similar confirmation during a bearish trend.
EMA reacts sooner when a pullback begins, momentum recovers, or price breaks from a short consolidation. Swing traders may therefore use EMA when entry timing matters more than long-term smoothing, while SMA may miss short-term opportunities in fast-moving markets.
| Swing-Trading Decision |
More Suitable Indicator |
Reason |
| Identify the broader trend |
SMA |
Reduces short-term market noise |
| Monitor an active pullback |
EMA |
Tracks recent price more closely |
| Confirm long-term direction |
SMA |
Can offer more reliable signals in smoother trends |
| Detect an early momentum shift |
EMA |
Responds faster to new prices |
| Reduce frequent whipsaws |
SMA |
Lower sensitivity |
| Prioritize earlier signals |
EMA |
Greater recent-price weighting |
The indicator should match the decision. Using a slow average for exact entry timing may produce excessive delay, while using a fast EMA as the only long-term trend filter may cause overreaction to temporary volatility.
How Does EMA 20 vs. EMA 50 Fit Into the Comparison?
EMA 20 vs. EMA 50 compares two exponential moving averages with different lookback periods. SMA vs. EMA compares two different calculation methods, and traders only apply a same period comparison when contrasting EMA and SMA settings directly.
In an EMA 20 vs. EMA 50 swing-trading setup, the EMA 20 represents the more responsive short-term trend, while the EMA 50 reflects a smoother intermediate trend.
When EMA 20 remains above a rising EMA 50, short-term momentum generally agrees with the broader bullish structure. When EMA 20 crosses below EMA 50, momentum may be weakening. However, one moving average crossover does not confirm that a complete trend reversal has occurred.
A mixed setup can combine a 20-period EMA with a 50-period SMA. Some traders use that pairing to reduce false signals by separating broader trend confirmation from faster entry timing. The EMA provides a faster reference for pullbacks, while the SMA acts as a steadier directional filter.
Which Moving Average Is Better for Pullback Entries?
EMA is often more practical for pullback entries because it stays closer to recent price during an active trend.
A bullish EMA-based pullback may include:
-
Price forming higher highs and higher lows.
-
A short-term EMA rising above a longer moving average.
-
Price retreating toward the EMA without breaking major support and resistance levels.
-
Selling pressure weakening near the average.
-
Price action or momentum confirming renewed buyer control.
These conditions can help refine entry points, but broader SMA levels are often better for identifying major support and resistance.
The EMA is a reference area rather than an exact support level. Price can briefly move below the average and still preserve the trend. A bounce can also fail when market structure, volume, or momentum has already deteriorated.
The MACD indicator can provide additional momentum context because it is constructed from exponential moving averages. However, many traders pair moving averages with other momentum indicators rather than relying on one average alone.
Which Moving Average Is Better for Trend Confirmation?
SMA generally provides clearer long-term trend confirmation because it reacts less strongly to isolated price movements, and it can act as a long term indicator for the broader trend because its equal weighting filters minor fluctuations into a smoother line. A long term SMA is also commonly used by long term traders for broader trend confirmation, while faster averages usually fit shorter-term analysis better. EMA can also confirm trends when several exponential averages remain correctly ordered and share the same direction.
A Moving Average Ribbon places several averages on one chart. An orderly and expanding ribbon may indicate stronger trend participation, while a compressed or tangled ribbon commonly appears during consolidation or a market transition.
Swing traders should examine more than price position:
-
A rising average indicates improving average price over the selected period.
-
A falling average indicates declining average price.
-
Widening separation between fast and slow averages suggests strengthening directional momentum.
-
Narrowing separation can indicate weakening momentum.
-
Flat averages that price crosses repeatedly suggest limited trend clarity, especially outside trending markets and under mixed market conditions.
Slope and separation often provide more context than one price crossing. Price moving above a falling average does not automatically create a sustainable bullish trend.
Are Moving-Average Crossovers Reliable?
Moving-average crossovers are more useful as confirmation than as independent trading instructions. A bullish crossover occurs when a faster average moves above a slower average, while a bearish crossover occurs when the faster average falls below the slower one. A golden cross is a moving average crossover often interpreted as a potential bullish trend reversal.
Crossovers tend to carry more meaning when price is already developing a directional structure, especially when traders are also watching broader ma crosses for context. A bullish crossover supported by higher lows and increasing trend strength provides more context than the same signal inside a narrow range.
The ADX indicator can help evaluate whether the market is developing sufficient trend strength. ADX does not determine bullish or bearish direction, but it can indicate whether a crossover is occurring during stronger expansion or weak consolidation.
The limitation is lag. SMA and EMA crossovers occur after price has already moved. EMA crossovers appear sooner, but their sensitivity also creates more whipsaws, while traders often watch 50-, 100-, and 200-day moving averages for higher-level signals.
Can SMA and EMA Be Used Together?
SMA and EMA can complement each other when each indicator has a defined role, and aligning that mix with your trading style usually leads to a more practical strategy.
A balanced swing-trading framework may use:
-
A 20-period EMA to monitor short-term pullbacks.
-
A 50-period SMA to define the broader trend.
-
Price structure to confirm higher highs, higher lows, lower highs, or lower lows.
-
Momentum or trend-strength tools for additional context.
-
A predefined invalidation level instead of relying solely on the moving average.
For example, bullish setups may receive greater attention when price remains above a rising 50-period SMA. Within that environment, short-term traders may emphasize the 20-period EMA for continuation entries, while long term investors may lean more on longer averages within the same framework. A retreat toward the 20-period EMA may then highlight a possible continuation area. The setup weakens when structural support breaks, the SMA flattens, and momentum deteriorates.
This approach separates trend selection from entry timing instead of expecting one moving average to perform every function, and combining both can produce more reliable signals than forcing a single average to do everything.
Limitations of SMA and EMA
Both SMA and EMA are lagging indicators built from past price data, so within technical analysis they help interpret market behavior rather than predict future moves. Neither can confirm that support and resistance levels will hold, a breakout will succeed, or a trend will continue, and no average alone is enough to validate those zones.
Their main limitations include:
-
Repeated false signals during sideways markets.
-
Delayed confirmation after sudden reversals and slower reaction to price spikes in the case of SMA.
-
Different results across assets and timeframes.
-
Excessive sensitivity from shorter EMA settings.
-
False precision around dynamic support or resistance.
-
Overlapping information when several similar averages are combined.
-
The need for other technical indicators when market conditions shift quickly.
Exit planning may incorporate price structure, volatility, and tools such as the Parabolic SAR indicator. Parabolic SAR can also reverse frequently in sideways conditions, so no indicator removes the need for risk management.
This material is for educational purposes and does not constitute financial or investment advice. Digital assets are volatile, and technical indicators can fail.
Which Should Swing Traders Choose?
Swing traders should choose between SMA and EMA based on trading style and current market conditions: EMA fits best when responsiveness and active entry timing matter most, while SMA is generally more suitable when broader trend stability and noise reduction take priority.
Choose EMA when monitoring pullbacks, momentum shifts, and early trend changes. Choose SMA when filtering trades through a longer-term directional structure. Use both when SMA defines the broader trend and EMA identifies shorter-term opportunities within it; many traders start trading with this framework to align higher-timeframe direction with shorter-term setups.
Neither indicator is dependable when price remains trapped in a narrow range and both averages are flat. In those non-trending conditions, repeated crossovers often describe noise rather than a sustainable trend, which reduces the reliability of the signals.
Educational disclaimer: Technical indicators cannot guarantee trading outcomes. Digital assets are volatile, and indicator signals may fail during rapid price changes, low-liquidity conditions, or sideways markets. Traders should independently evaluate position size, leverage, execution risk, and invalidation levels.
Conclusion
SMA and EMA address different swing-trading needs. simple moving average (SMA) provides a smoother view of the prevailing trend, while exponential moving average (EMA) reacts faster to recent price changes.
EMA is generally more useful for active pullbacks and entry timing. SMA is generally more useful for long-term trend filtering. The EMA 20 vs. EMA 50 combination adds a short-term and intermediate trend comparison, while a mixed EMA-and-SMA setup separates entry timing from broader confirmation.
The strongest interpretation combines moving averages with price structure, momentum, trend strength, volatility, and defined risk limits, because they are tools within technical analysis rather than standalone predictors.
FAQ
Is EMA better than SMA for swing trading?
EMA is often better for active entry timing because it gives more weight to the most recent price. SMA may be more suitable for identifying the broader long-term trend because it gives equal weight to each data point, including yesterday's price, which helps filter short-term noise.
Is the 20 EMA better than the 50 EMA?
The 20 EMA is more responsive, while the 50 EMA provides smoother intermediate-trend context. The better choice depends on whether the trader is evaluating a short-term pullback or the broader directional structure.
Can SMA and EMA generate false signals?
Both SMA and EMA can produce false signals, especially during sideways or volatile markets. EMA generally creates more frequent signals, while SMA may confirm reversals later.
Should moving averages be used alone?
Moving averages should be combined with price structure, volatility, momentum, trend strength, and predefined risk controls. No moving average can guarantee that a trend or trade setup will succeed.







