These technical analysis tools help crypto traders recognize weakening momentum, changing price direction, and potential bullish or bearish trend reversals. For beginners and active traders, the challenge is distinguishing genuine turning points from temporary pullbacks. No trend reversal indicator can predict every market movement, especially in highly volatile cryptocurrency markets.
Key Takeaways
-
Reversal indicators identify potential turning points through momentum shifts, price extremes, volatility, and changes in market structure.
-
RSI and Stochastic Oscillator highlight overbought and oversold conditions, while MACD helps confirm momentum changes.
-
Bollinger Bands, Fibonacci levels, and Donchian Channels identify areas where price may reverse or break out.
-
A trend reversal becomes more convincing when price action, volume, and multiple independent indicators agree.
-
False signals remain common during strong trends, making confirmation and position-size management essential.
What Are Reversal Indicators and How Do They Identify Turning Points?
Reversal indicators are technical analysis tools that help determine when an existing price trend may weaken or change direction.
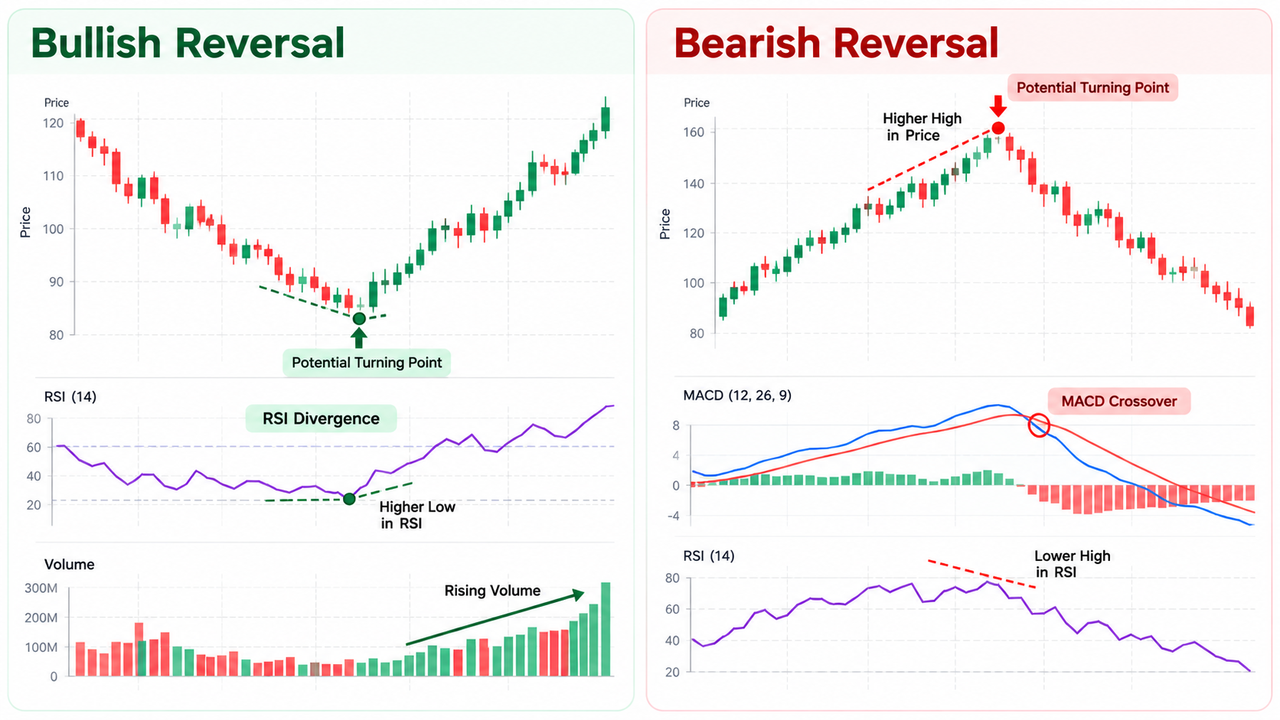
A bullish trend reversal occurs when selling pressure fades and buyers begin establishing higher lows and higher highs. A bearish reversal develops when buying momentum weakens and sellers establish lower highs and lower lows.
Indicators identify these changes differently. Momentum oscillators measure the speed of price movement, while trend indicators evaluate direction using moving averages or volatility.
Price action provides additional evidence through double tops, double bottoms, trendline breaks, and candlestick formations.
A single lower low doesn't confirm a reversal. Two successive lower lows generally indicate a continuing downtrend unless a subsequent higher low or structural break develops.
10 Best Reversal Indicators for Crypto Trading
| Reversal Indicator |
Main Reversal Signal |
Best Use |
| RSI |
Divergence and 70/30 levels |
Momentum exhaustion |
| MACD |
Signal-line crossover |
Momentum confirmation |
| Stochastic Oscillator |
Crossovers near price extremes |
Short-term turning points |
| Bollinger Bands |
Price returning inside bands |
Volatility-based reversals |
| Fibonacci Retracement |
Reaction at retracement levels |
Support and resistance |
| Supertrend |
Directional line flip |
Trend-change confirmation |
| Zigzag |
Changes in swing structure |
Identifying price reversals |
| Donchian Channels |
Channel boundary reversal |
Range and trend analysis |
| Parabolic SAR |
Dots switching sides |
Trailing trend changes |
| OBV |
Volume divergence |
Participation confirmation |
-
Relative Strength Index (RSI)
The Relative Strength Index measures momentum between 0 and 100.
Readings above 70 indicate overbought conditions, while values below 30 suggest oversold conditions. Neither guarantees an immediate reversal.
Bullish divergence develops when price makes a lower low but RSI forms a higher low. Bearish divergence occurs when price reaches a higher high while RSI records a lower high.
These divergences suggest momentum is weakening before a potential change in direction.
-
Moving Average Convergence Divergence (MACD)
Moving Average Convergence Divergence compares two exponential moving averages, commonly the 12-period and 26-period EMAs.
A nine-period EMA of the MACD line forms its signal line.
A bullish crossover occurs when MACD crosses above the signal line. Crossing below generates a potential bearish signal.
MACD divergence can reveal weakening trends before crossovers appear. However, the moving average calculations introduce lag, particularly around sudden price reversals.
Fidelity's MACD technical reference describes its crossover and divergence interpretations.
-
Stochastic Oscillator
The Stochastic Oscillator measures where the current closing price sits relative to a recent high-low range.
Its values range from 0 to 100, with readings above 80 commonly considered overbought and below 20 oversold.
A bullish crossover near the oversold zone can suggest improving momentum. Bearish crossovers near 80 may indicate weakening buying pressure.
Compared with RSI and Stochastic RSI, the traditional Stochastic Oscillator reacts directly to the price range rather than changes in RSI.
-
Bollinger Bands
Bollinger Bands surround a moving average with upper and lower bands based on standard deviation.
A potential bullish reversal develops when price closes below the lower band and subsequently moves back inside. The opposite setup can suggest a bearish reversal near the upper band.
However, price can remain outside a band during strong trends.
As Fidelity's Bollinger Bands reference explains, the bands adjust to changing volatility and should be interpreted alongside other indicators.
-
Fibonacci Retracement
Fibonacci Retracement identifies potential support and resistance based on mathematical ratios of an earlier price move.
Common retracement levels include 23.6%, 38.2%, 50%, 61.8%, and 78.6%. The 50% level is a widely used convention rather than a Fibonacci ratio.
For example, a rally from $80 to $100 has a 61.8% retracement near $87.64.
A bullish rejection near that level may signal recovery, but the level itself doesn't guarantee support.
-
Supertrend Indicator
The Supertrend indicator uses Average True Range (ATR) to construct volatility-adjusted trend boundaries.
A direction change occurs when the indicator switches from its bearish line to its bullish line, or vice versa.
Supertrend works particularly well as a trend confirmation and trailing stop framework. Its disadvantage is sensitivity to price fluctuations during sideways markets.
-
Zigzag Indicator
The Zigzag indicator filters smaller price movements to display significant swing highs and lows.
Traders use these swings to identify double tops, double bottoms, higher lows, and lower highs.
Two successive lower lows still indicate bearish structure. A subsequent higher low followed by a break above a previous swing high provides stronger bullish reversal evidence.
Zigzag is primarily descriptive: its latest swing can repaint until the minimum reversal threshold is reached.
-
Donchian Channels
Donchian Channels track the highest high and lowest low over a selected period.
A 20-period setting is common, while traders sometimes use 20–40 periods to examine shorter-term turning points and breakouts.
Repeated rejection near the upper boundary may indicate resistance, while a lower-boundary rejection can suggest a bullish recovery.
A decisive breakout beyond either boundary can signal continuation rather than reversal. That distinction matters when evaluating volatility indicators.
-
Parabolic SAR
Parabolic Stop and Reverse (SAR) plots dots above or below price to identify changes in trend direction.
Dots moving from above price to below price suggest a bullish shift. The opposite transition generates a bearish signal.
Unlike RSI, Parabolic SAR also creates a dynamic trailing stop reference.
It performs better during directional movement than sideways consolidation, where repeated flips can produce false signals.
-
On-Balance Volume (OBV)
On-Balance Volume tracks cumulative volume by adding volume after higher closes and subtracting it after lower closes.
When price makes a lower low but OBV forms a higher low, selling participation may be weakening.
Similarly, bearish OBV divergence can suggest reduced buying commitment during an uptrend.
OBV doesn't directly measure every buyer and seller. It uses the direction of closing prices to approximate volume flow.
How to Confirm a Trend Reversal With Price Action
A reversal trading strategy works better when different evidence types support the same conclusion.
Consider a hypothetical Bitcoin price chart:
-
Bitcoin establishes a lower low while RSI forms a higher low.
-
A bullish engulfing candle appears near established support.
-
The candle closes with increased trading volume.
-
The next bar breaks above the signal bar's high, suggesting a possible shift in control.
A trader examining the BTC/USDT spot market on Gate.com can compare that setup with live price data, volume, and nearby resistance before making an informed decision.
A bullish engulfing candle reflects strong buying pressure after a decline. Conversely, bearish engulfing patterns and shooting stars with long upper wicks show selling pressure after an advance. Pin bars highlight price rejection, while double tops and double bottoms identify repeated failures to break resistance or support.
These price action trading strategies become more meaningful when confirmed by a trendline break and a change in swing structure.
How to Reduce False Signals From Reversal Indicators
Crypto volatility can generate repeated overbought readings, temporary trendline breaks, and misleading crossovers.
A practical confirmation method combines momentum, price structure, and volume rather than stacking several closely related oscillators.
For example, a bullish RSI divergence accompanied by a higher low and rising volume offers more independent evidence than three momentum indicators producing similar signals.
The volume indicators used for crypto trend confirmation can help assess whether an apparent reversal has broader market participation.
Position size should reflect the distance to an invalidation level. A trailing stop may protect existing gains, although fast price movements and slippage can affect the actual exit outcome.
Extreme Crypto Fear & Greed Index readings can provide sentiment context for larger market turning points, but sentiment extremes aren't standalone trading signals.
Conclusion
The best reversal indicators depend on the type of turning point a trader wants to identify.
RSI and Stochastic are useful for momentum extremes, MACD and Supertrend for confirming directional changes, and Fibonacci, Zigzag, and Donchian Channels for analyzing price structure.
The strongest practical method combines an indicator signal with price action and volume confirmation. Even then, a reversal remains a probability rather than a guaranteed outcome.
Frequently Asked Questions
Which is the best trend reversal indicator?
RSI is a practical starting point because it identifies momentum extremes and divergences. MACD is often more useful for confirming shifts in momentum, although its signals may arrive later.
Can reversal indicators predict exact market tops and bottoms?
No. Reversal indicators analyze historical and current price data. They identify potential turning points but cannot determine the precise price or time at which a market will reverse.
What is the difference between a reversal and a pullback?
A pullback is a temporary movement against the prevailing trend. A reversal involves a more sustained change in direction, generally supported by altered swing structure and additional technical confirmation.
What candlestick patterns suggest bullish and bearish reversals?
Bullish engulfing candles, hammers, and double bottoms may signal upward reversals. Bearish engulfing candles, shooting stars, and double tops can suggest downward reversals, particularly near established resistance.
How many reversal indicators should traders use?
Two or three complementary indicators are usually sufficient for a straightforward trading method. Combining momentum, trend structure, and volume avoids excessive duplication and keeps signals easier to interpret.
Disclaimer: This content is for educational purposes only and does not constitute financial or investment advice. Technical indicators can generate false signals, and historical market patterns do not guarantee future performance. Cryptocurrency trading involves substantial risk, including potential loss of capital.







