For crypto day traders and swing traders, distinguishing a brief pause from a potential trend reversal can improve entry and exit decisions. The eight indicators below assess trend direction, market momentum, trading volume and volatility. None can predict continuation with certainty, particularly during unstable market conditions.
Key Takeaways
-
Moving averages, SuperTrend and VWAP help identify the prevailing trend and potential dynamic support and resistance levels.
-
MACD and RSI measure market momentum, helping traders assess whether a pullback represents a temporary slowdown or weakening trend.
-
ADX measures trend strength, while OBV helps validate continuation through changes in trading volume.
-
Bollinger Bands highlight volatility contractions and potential breakout opportunities following consolidation.
-
Combining multiple indicators with price action and risk management helps reduce reliance on false signals.
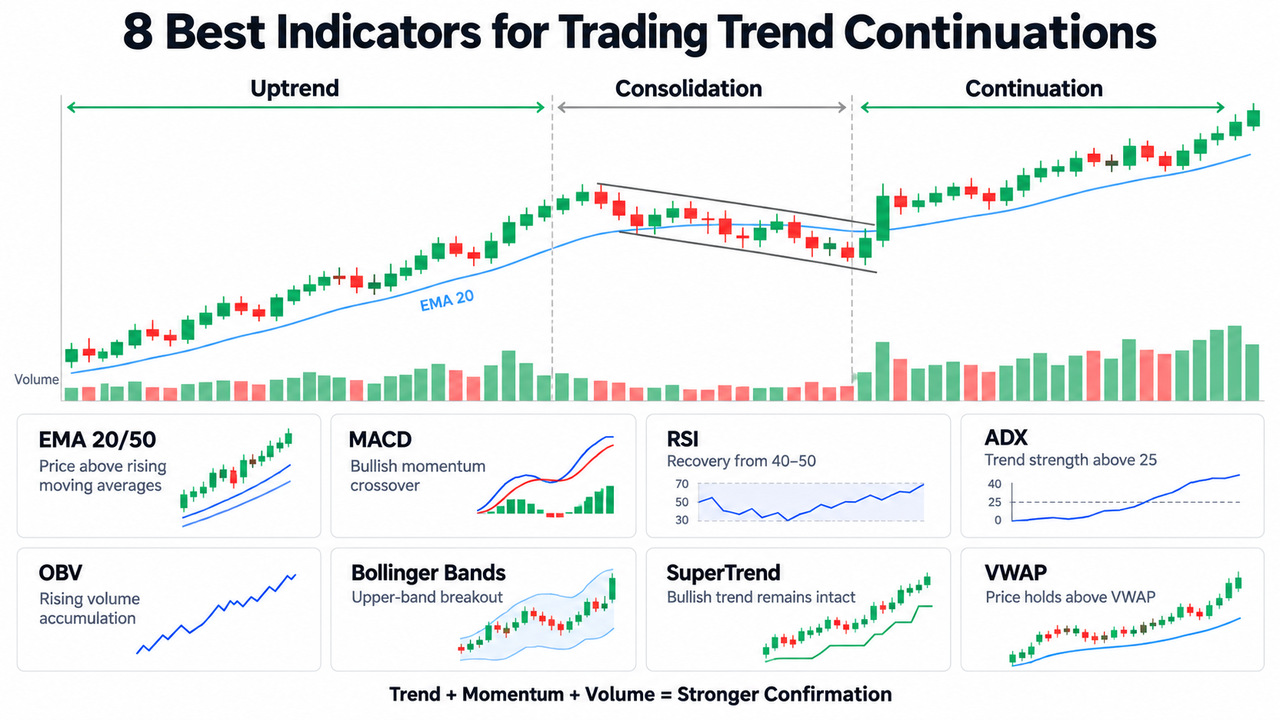
What Are Trend Continuation Indicators?
Trend continuation indicators are technical analysis tools that help traders assess whether existing price trends may continue after a temporary interruption.
A bullish trend typically produces higher highs and higher lows, while a bearish trend forms lower highs and lower lows. During either trend, price movements rarely follow a straight line.
Short-term continuation patterns develop when the market pauses before potentially resuming its previous direction.
Common continuation patterns include:
-
Bullish flags: A brief consolidation or downward-sloping channel after a strong upward movement.
-
Bearish flags: A temporary upward-sloping correction within a downward trend.
-
Triangles: Narrowing price movements between converging support and resistance lines.
-
Rectangles: Consolidation between horizontal support and resistance levels.
-
Pennants: Small converging formations following sharp price movements.
These patterns can develop over minutes, days or months. The CME Group's technical analysis education explains how flags, triangles and rectangles represent temporary market pauses.
A breakout in the prevailing trend direction, preferably supported by expanding volume, strengthens the continuation case. However, patterns can also break against the existing trend.
8 Best Indicators for Trend Continuation Trading
-
Moving Averages: Identifying Market Trends
Moving averages smooth historical price data to identify overall trend direction and potential dynamic support or resistance levels.
A 20-day Simple Moving Average (SMA) calculates the average closing price over the previous 20 trading days. Exponential Moving Averages (EMAs) assign greater weight to recent prices and respond faster.
During an upward trend, price may pull back toward a rising 20-period EMA before recovering. The EMA 20 and EMA 50 combination helps traders distinguish shorter-term momentum from broader market direction.
A bullish golden cross occurs when a shorter moving average crosses above a longer one, commonly the 50-period above the 200-period average.
Continuation signal: Price maintains its position above rising moving averages and rebounds after a pullback.
Limitation: Moving averages are lagging indicators and can produce repeated false signals in sideways markets.
-
Moving Average Convergence Divergence (MACD): Confirming Momentum
The Moving Average Convergence Divergence indicator measures momentum through the relationship between two exponential moving averages.
Its standard configuration uses 12-period and 26-period EMAs, alongside a nine-period signal line.
During a bullish trend, the MACD line crossing above the signal line after a pullback may indicate renewed buying momentum.
The MACD histogram expands when the gap between these lines widens and contracts as their difference narrows.
A rising histogram following consolidation suggests strengthening momentum. However, weakening histogram bars may indicate slowing price movements rather than an immediate reversal.
Continuation signal: MACD turns upward following a temporary decline while price maintains its broader bullish structure.
The MACD and RSI combination can help traders compare trend momentum with overbought or oversold conditions.
-
Relative Strength Index (RSI): Recognizing Momentum Resets
The Relative Strength Index measures the speed and magnitude of price changes on a scale from 0 to 100.
Traditional interpretations identify readings above 70 as overbought and below 30 as oversold.
In strong bullish trends, however, RSI can remain elevated for extended periods. It may fluctuate approximately between 40 and 80, with pullbacks toward 40–50 sometimes preceding renewed upward momentum.
For example, RSI falling from 75 to 45 while price maintains higher lows may represent a momentum reset.
Continuation signal: RSI recovers from its bullish support range as price resumes moving upward.
The catch is that RSI divergence, where price reaches new highs without corresponding momentum highs, can warn of weakening trends or potential trend reversals.
-
Average Directional Index (ADX): Measuring Trend Strength
The Average Directional Index measures trend strength without identifying whether market direction is bullish or bearish.
Its commonly used 14-period setting produces readings between 0 and 100.
Typical interpretations include:
-
Below 20: Weak or absent trend.
-
Between 20 and 25: Developing or uncertain trend.
-
Above 25: Established trend strength.
A rising ADX above 25 during a breakout can support a continuation interpretation.
Directional indicators +DI and -DI provide additional information about upward and downward pressure.
Continuation signal: ADX rises while price breaks consolidation in the prevailing trend direction.
Unlike indicators that measure both direction and momentum, ADX focuses on trend strength, making it useful as a confirmation filter.
-
On-Balance Volume (OBV): Validating Continuation Breakouts
On-Balance Volume measures cumulative buying and selling pressure by adding volume on sessions with higher closes and subtracting it on sessions with lower closes.
Rising OBV alongside rising prices suggests that trading volume supports the trend.
During a healthy bullish pullback, declining prices sometimes occur on relatively light volume. If OBV remains stable or increases during consolidation, accumulation may still be taking place.
Continuation signal: Price breaks resistance while OBV rises and breakout volume expands.
A strong volume spike can provide additional confirmation of market participation, although no fixed spike threshold guarantees continuation.
If price establishes higher highs while OBV declines, the divergence may indicate weakening demand.
The relationship between OBV and volume confirmation helps traders evaluate breakout validity.
-
Bollinger Bands: Identifying Volatility Breakouts
Bollinger Bands visualize market volatility using a middle moving average and upper and lower bands, commonly positioned two standard deviations away.
The bands contract during lower volatility and expand as price movements become larger.
Following a brief consolidation phase, a decisive candle close beyond the upper band, accompanied by expanding volume, may indicate bullish continuation.
Continuation signal: Price breaks above a consolidation boundary, closes outside the upper band and maintains follow-through.
A single close outside the band isn't sufficient confirmation. Strong trends can repeatedly touch or travel along a band, while false breakouts remain possible.
-
SuperTrend: Following the Prevailing Trend
SuperTrend is a trend-following indicator built from price data and the Average True Range (ATR), which measures market volatility.
It plots a dynamic line above or below price depending on the prevailing direction.
During bullish market trends, the line typically remains below price and may serve as a trailing exit reference.
Continuation signal: Price retraces without triggering a bearish SuperTrend reversal, then resumes its upward movement.
The SuperTrend indicator can support trend-following strategies, although volatile consolidations may trigger premature direction changes.
-
Volume-Weighted Average Price (VWAP): Confirming Intraday Continuation
VWAP calculates the average traded price weighted by volume over a specified period, commonly resetting each trading session.
For intraday trend traders, price holding above VWAP may indicate continued bullish positioning relative to the session's volume-weighted average.
Suppose BTC pulls back toward VWAP after a strong opening move. A recovery above VWAP with expanding volume can support a bullish continuation setup.
Traders can examine this behavior on the BTC/USDT spot chart on Gate.com, comparing price structure with available chart indicators and trading volume.
Continuation signal: Price reclaims or successfully retests VWAP while maintaining the established intraday trend.
Session VWAP becomes less directly comparable across multiple trading days unless an appropriate anchored or multi-session calculation is used.
How to Combine Multiple Indicators for Entry and Exit Points
Combining indicators from different categories provides a more balanced view of market behavior.
| Trading condition |
Indicator |
Confirmation |
| Trend direction |
EMA 20/50 |
Price above rising averages |
| Momentum recovery |
RSI and MACD |
RSI rebounds; MACD strengthens |
| Trend strength |
ADX |
Reading above 25 |
| Breakout participation |
OBV and volume |
Rising OBV and expanding volume |
| Entry and exit |
Price structure |
Breakout close and defined invalidation |
For a hypothetical bullish flag, a trader might first identify a rising EMA, then check whether the consolidation occurs on declining volume. A candle closing above the flag's downward-sloping resistance line, accompanied by stronger volume and recovering momentum, provides several independent observations supporting continuation.
Risk management remains essential. Traders can define invalidation beneath the consolidation low or another relevant support level, accounting for volatility, position size and potential slippage.
The Fidelity technical indicator reference categorizes indicators by trend, momentum, volume and volatility, reinforcing why different analytical functions matter.
Limitations of Trend Continuation Indicators
Trend indicators rely primarily on historical data and cannot guarantee future price movements.
Market noise, sudden liquidity changes and unexpected news can invalidate continuation patterns. Multiple indicators may also repeat the same underlying information rather than provide independent confirmation.
A rising ADX doesn't establish bullish direction, an RSI recovery doesn't guarantee buying pressure, and volume expansion can accompany failed breakouts.
Understanding the broader market context, identifying support and resistance levels, and defining exit points before entering a trade can make trading strategies more disciplined.
Conclusion
The eight best indicators for trading trend continuations are moving averages, MACD, RSI, ADX, OBV, Bollinger Bands, SuperTrend and VWAP.
Their strongest practical use comes from combining trend direction, momentum recovery and volume confirmation around recognizable continuation patterns.
An established trend can still reverse. Price action, market structure and predefined risk controls should take priority over individual indicator signals.
Frequently Asked Questions
What is the best indicator for trend continuation?
Moving averages are a practical starting point because they show trend direction and potential dynamic support or resistance. MACD, ADX and OBV can provide additional momentum, strength and volume confirmation.
How do traders confirm trend continuation patterns?
Traders typically look for a breakout in the existing trend direction, a decisive candle close beyond consolidation boundaries and increased trading volume. Supporting momentum indicators may strengthen the interpretation.
What are the most common continuation patterns?
Flags, pennants, triangles and rectangles are common continuation patterns. They represent periods of temporary consolidation but can also produce failed breakouts or trend reversals.
Can RSI identify trend continuation?
Yes. In bullish conditions, RSI recovering from approximately 40–50 can suggest renewed momentum. These levels are observational guidelines rather than reliable entry signals in every market.
Which indicators work best together for trend continuation?
EMA, RSI, ADX and OBV provide complementary information about trend direction, momentum, strength and volume. Using fewer indicators with different functions can be more useful than stacking similar oscillators.
Disclaimer
This content is intended for educational purposes only and does not constitute financial or investment advice. Technical indicators, chart patterns and historical market behavior cannot guarantee future results. Cryptocurrency trading involves volatility, liquidity risk and potential financial losses. Traders should conduct independent research and apply appropriate risk management before making trading decisions.







