For crypto day traders and swing traders, false signals can lead to premature entries, unnecessary exits, and repeated losses. Combining complementary indicators helps filter weaker setups, although no combination can eliminate trading risk.
Key Takeaways
-
Combining trend, momentum, and volume indicators can reduce dependence on misleading individual signals.
-
MACD with ADX helps confirm whether momentum changes occur during a sufficiently strong trend.
-
RSI, Stochastic Oscillator, and Bollinger Bands help identify potential price extremes, but don't guarantee reversals.
-
Volume indicators such as OBV help assess participation behind breakouts and price movements.
-
Using two or three complementary indicators, alongside position sizing and stop-loss planning, is generally more practical than overcrowding a chart.
Why Indicator Combinations Help Reduce False Signals
Technical indicators use mathematical calculations based on historical price data, trading volume, or volatility. They generate trading signals by measuring market conditions, but each indicator captures only part of the picture.
For example, a momentum indicator may show improving buying pressure while the broader price chart remains bearish. Acting on just one indicator could produce an early entry before an ongoing downtrend resumes.
Effective indicator combinations use different indicators for separate decisions:
-
Trend indicators: Identify trend direction and broader market structure.
-
Momentum indicators: Gauge momentum shifts and buying or selling pressure.
-
Volume indicators: Assess market participation and confirm price movements.
-
Volatility indicators: Measure price fluctuations and help establish risk boundaries.
This approach is sometimes called an orthogonal indicator stack. It reduces indicator redundancy by avoiding several tools that respond to essentially the same information.
The Fidelity technical analysis framework similarly distinguishes chart overlays, oscillators, and volume measures.
7 Best Indicator Combinations for Reducing False Signals
| Indicator combination |
Primary purpose |
Suitable market conditions |
| EMA + RSI |
Trend and momentum confirmation |
Trending markets |
| MACD + ADX |
Momentum and trend strength |
Strong directional trends |
| Bollinger Bands + Stochastic |
Price extremes and reversals |
Ranging markets |
| SuperTrend + ATR |
Trend filtering and volatility |
Volatile trending markets |
| OBV + MACD |
Volume-supported momentum |
Breakouts and continuations |
| VWAP + RSI |
Intraday value and momentum |
Day trading |
| Donchian Channels + Volume |
Breakout confirmation |
Range-to-trend transitions |
-
EMA + RSI: Combining a Trend Indicator With Momentum
The Exponential Moving Average (EMA) identifies trend direction, while the Relative Strength Index (RSI) measures momentum on a scale from 0 to 100.
A common setup uses the 20-period and 50-period EMAs with a 14-period RSI.
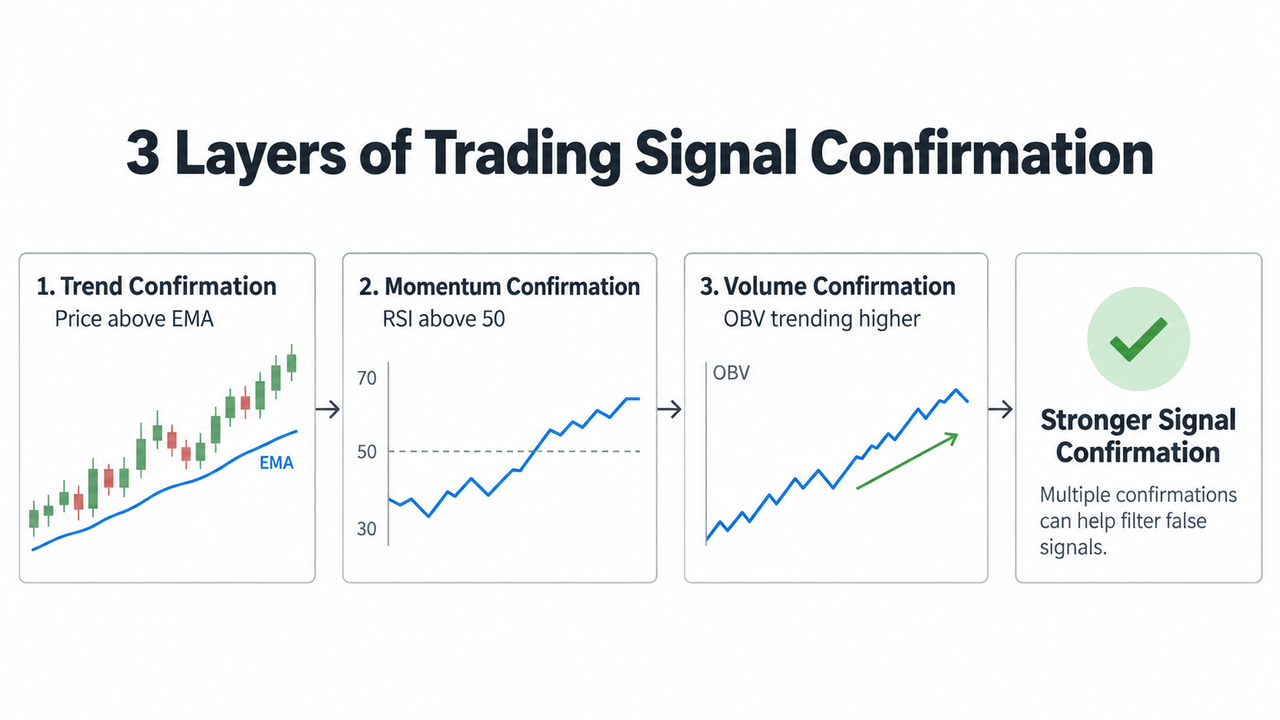
When price remains above both rising moving averages and RSI recovers above 50, the signals suggest improving bullish momentum within an existing upward trend.
Traditionally, RSI values above 70 indicate overbought conditions, while readings below 30 indicate oversold conditions. However, strong trends can maintain extreme readings for extended periods.
The EMA 20 and EMA 50 relationship helps distinguish ordinary pullbacks from potential trend deterioration.
Limitation: EMA signals lag price movements, while RSI can remain overbought or oversold during persistent trends.
-
MACD + ADX: Confirming Momentum and Trend Strength
Moving Average Convergence Divergence (MACD) measures changes in trend direction and momentum through three components: the MACD line, signal line, and histogram.
A bullish MACD crossover occurs when the MACD line crosses above its signal line. However, repeated crossovers during sideways markets can generate false signals.
The Average Directional Index (ADX) provides a second filter. It measures trend strength on a 0–100 scale, without identifying direction.
Common interpretations include:
-
Below 20: Weak or absent trend.
-
Above 25: Potentially established trend.
-
Rising ADX: Increasing trend strength.
These are conventions, not fixed trading rules.
A bullish MACD crossover becomes more meaningful when ADX indicates sufficient trend strength and price action supports the upward direction.
Fidelity's Directional Movement Index methodology explains how ADX measures strength independently of direction.
The MACD and RSI comparison also illustrates why momentum tools shouldn't be treated as identical signals.
Limitation: ADX can rise during strong downtrends, so a high reading alone doesn't confirm a bullish trade.
-
Bollinger Bands + Stochastic Oscillator: Filtering False Reversals
Bollinger Bands consist of a moving average and upper and lower bands, typically positioned two standard deviations from a 20-period moving average.
The Stochastic Oscillator compares the latest closing price with the trading range over a specific period.
Its conventional thresholds are:
In ranging markets, traders may watch for price touching the lower Bollinger Band while Stochastic turns upward from oversold conditions.
A stronger setup requires price to recover inside the bands and the candle to close before considering a potential reversal.
The Bollinger Bands and Keltner Channels comparison demonstrates how volatility envelopes behave differently.
Limitation: During strong market trends, prices can follow the upper or lower bands while Stochastic remains extreme.
-
SuperTrend + Average True Range: Filtering Volatile Signals
SuperTrend is a trend-following indicator that uses Average True Range (ATR) to calculate volatility-adjusted trend levels.
ATR measures the magnitude of price movements without predicting their direction.
A bullish SuperTrend signal becomes more useful when price closes above its trend line and the reversal fits the broader price structure.
ATR also helps estimate whether a stop-loss is unusually close relative to current market volatility.
For example, with an ATR of $100, a $30 stop distance may be vulnerable to ordinary price fluctuations. The actual stop should also respect nearby technical levels.
The SuperTrend and EMA comparison shows how volatility-adjusted signals differ from moving average signals.
Limitation: Because SuperTrend already incorporates ATR, this pairing is best used for trend confirmation and risk sizing, not as two independent directional signals.
-
On-Balance Volume (OBV) + MACD: Confirming Market Participation
On-Balance Volume (OBV) tracks cumulative volume flow by adding volume on higher closing periods and subtracting it on lower ones.
OBV can provide early clues about accumulation, distribution, and possible price changes. It doesn't reliably predict future prices on its own.
Pairing OBV with MACD connects volume participation with momentum shifts.
For example, when MACD turns bullish and OBV breaks above a previous high, the combination suggests volume is supporting the price movement.
If MACD rises while OBV declines, the disagreement calls for caution.
The OBV and Money Flow Index comparison illustrates different methods of assessing trading pressure.
Limitation: OBV may be distorted by unusually large volume spikes, especially in thinly traded markets.
-
VWAP + RSI: Finding Intraday Entry and Exit Points
Volume-Weighted Average Price (VWAP) measures the average traded price weighted by volume, commonly over a trading session.
Combining VWAP with RSI helps day traders evaluate intraday trend direction and momentum.
Consider a trader reviewing the BTC/USDT spot market on Gate.com. Price moves above session VWAP while RSI rises through 50. A candle closing above VWAP provides more evidence than a brief intrabar crossover.
If RSI weakens and price falls below VWAP, the original bullish setup may no longer hold.
The VWAP and EMA day trading comparison highlights their different reference points.
Limitation: VWAP depends on the session definition and can produce repeated crosses in sideways markets.
-
Donchian Channels + Volume: Reducing False Breakout Signals
Donchian Channels identify the highest high and lowest low over a selected lookback period, such as 20 completed candles.
A breakout above the previous upper boundary can suggest bullish continuation. However, low-volume breakouts may lack sufficient market participation and quickly reverse.
Traders can require a candle close beyond the previous channel boundary alongside volume exceeding its recent average.
This filters some temporary price spikes, although it may delay entries.
The Donchian and Keltner Channels comparison clarifies the difference between price-range and volatility-based breakout levels.
Limitation: High-volume breakouts can still fail, particularly during news-driven market volatility.
How Many Indicators Should Traders Combine?
Two or three complementary indicators are a practical starting point. Using multiple technical indicators from the same category often adds redundant signals rather than valuable insights.
A basic decision framework is:
-
Direction: Use an EMA or another trend-following indicator to identify market trends.
-
Confirmation: Use MACD, RSI, or ADX to assess momentum and trend strength.
-
Participation: Use volume or OBV when breakout confirmation matters.
Traders should also compare indicator readings with chart patterns, support and resistance, and relevant fundamental analysis.
The best indicators depend on market conditions. Trend-following combinations may struggle in sideways markets, while reversal oscillators can generate misleading signals during strong directional moves.
Risk Management When Combining Technical Indicators
Even well-confirmed trading signals carry significant risk.
Waiting for candle closes can reduce premature crossover decisions, but also means accepting later entry prices. Historical data should be tested across different market conditions before a strategy is trusted.
Position sizing deserves particular attention. If a trader risks 1% of a $10,000 account, the planned loss budget is $100. With a $200 stop distance per unit, the position would be 0.5 units before accounting for fees and slippage.
Stop-loss orders help manage risk but cannot guarantee execution at the intended price. The U.S. Securities and Exchange Commission's investor guidance explains how stop orders can execute at unfavorable prices during volatility.
Profit targets, liquidity, leverage, and strict risk discipline matter regardless of how many indicators agree.
Conclusion
The best indicator combinations reduce false signals by measuring different market dimensions rather than repeating the same calculations.
EMA with RSI supports trend entries, MACD with ADX filters weak trends, and OBV with MACD adds volume confirmation. Bollinger Bands with Stochastic can be useful in ranging markets.
Ultimately, complementary indicators are decision filters, not guarantees. Price action, position sizing, and disciplined exits remain essential.
Frequently Asked Questions
What is the best indicator combination for reducing false signals?
MACD with ADX is a practical combination for trending markets because MACD measures momentum while ADX assesses trend strength. No combination is consistently best across all market conditions.
How many indicators should traders use together?
Two or three complementary indicators are generally sufficient for a manageable strategy. Adding too many overlapping indicators can create analysis paralysis without improving signal quality.
Can indicator combinations eliminate false trading signals?
No. Indicator combinations can filter weaker setups, but historical price calculations cannot predict every reversal, breakout failure, or volatility event.
Which indicator combination works best in sideways markets?
Bollinger Bands with Stochastic Oscillator can help identify potential reversals near range boundaries. Strong support and resistance levels provide useful additional context.
Should traders combine technical indicators with volume?
Volume confirmation is particularly useful during breakouts. Rising participation can support a directional move, while weak volume may indicate an unreliable breakout.
Disclaimer
This content is for educational purposes only and does not constitute financial or investment advice. Technical indicators are based on historical market data and cannot guarantee future trading performance. Cryptocurrency trading involves substantial risk, including possible loss of capital. Evaluate your financial circumstances and risk tolerance before making trading decisions.