These indicators help short-term traders identify trend direction, momentum shifts, volatility, and potential entry points on one-minute and five-minute charts.
For traders exploring crypto scalping, choosing the right combination matters more than adding numerous indicators. Small price movements leave little room for delayed signals, transaction costs, or poor execution.
Key Takeaways
-
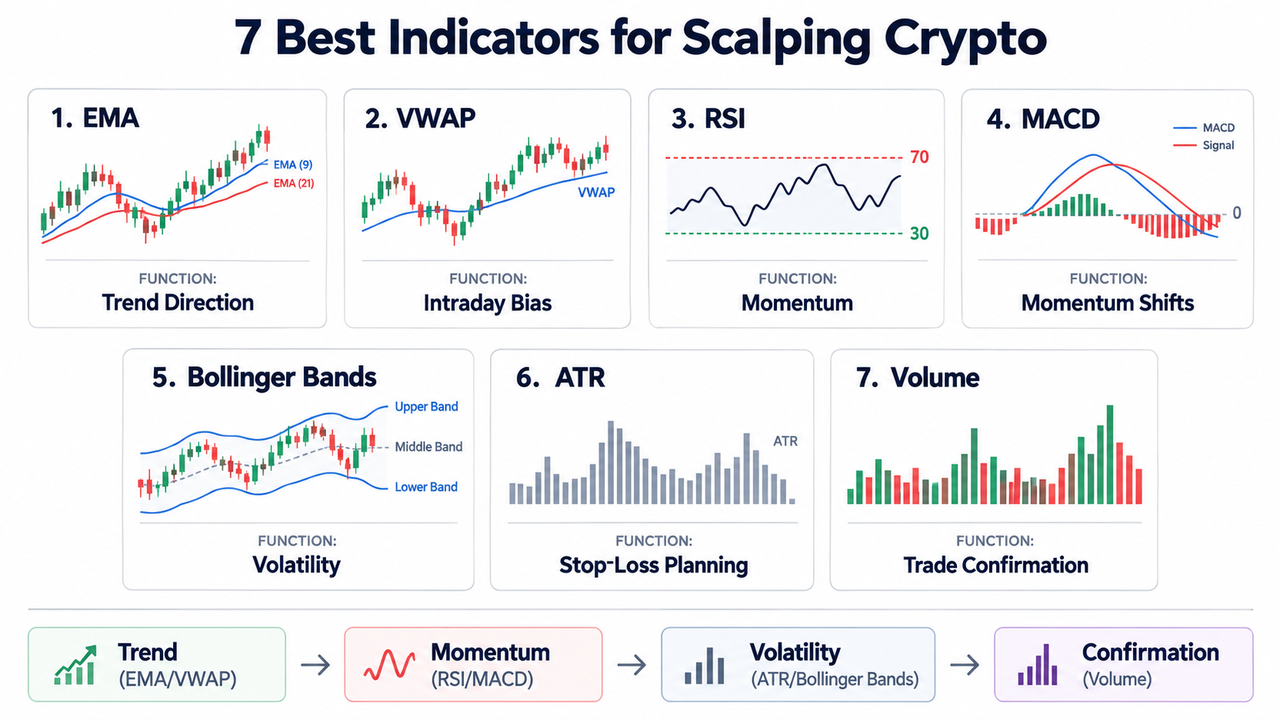
The seven best scalping indicators cover trend identification, momentum, volatility, intraday price positioning, and trading activity.
-
EMA and VWAP help establish trend direction and intraday bias, while RSI and MACD identify momentum shifts.
-
Bollinger Bands and ATR measure market volatility, while volume helps confirm breakouts and price movements.
-
Combining two or three complementary indicators generally produces clearer decisions than stacking overlapping signals.
-
Crypto scalping requires high liquidity, tight spreads, disciplined risk management, and fast execution. No indicator guarantees profitable trades.
What Are Scalping Indicators in Crypto Trading?
Scalping indicators are technical analysis tools used to evaluate short-term price movements and identify potential trading opportunities lasting seconds or minutes.
Scalping involves making frequent trades to capture relatively small price changes. Some active scalpers execute dozens or even more than 100 trades during a trading day, although this isn't a requirement or a reliable measure of profitability.
Unlike swing trading strategies, which may hold positions for several days, scalp trading demands continuous chart analysis and quick decisions.
Most crypto scalping strategies use one-minute or five-minute charts, supported by higher-timeframe market structure. Effective indicators must respond quickly without producing excessive false signals.
7 Best Scalping Indicators for Crypto Trading
The following indicators are selected for their distinct roles in short-term trading rather than any guaranteed profitability ranking.
| Indicator |
Primary Function |
Best Scalping Use |
| EMA |
Trend identification |
Short-term trend entries |
| VWAP |
Volume-weighted average price |
Intraday bias |
| RSI |
Momentum oscillator |
Momentum shifts |
| MACD |
Momentum and trend |
Direction confirmation |
| Bollinger Bands |
Volatility measurement |
Range and breakout setups |
| ATR |
Price-range volatility |
Stop-loss positioning |
| Volume |
Trading participation |
Breakout confirmation |
-
Exponential Moving Average (EMA): Best for Short-Term Trends
The Exponential Moving Average gives greater weight to recent price movements than a Simple Moving Average (SMA).
Popular scalping configurations include EMA 9, EMA 20, and EMA 50.
When EMA 9 moves above EMA 20, it can indicate short-term upward momentum. The opposite crossover suggests downward momentum.
For example, a scalper observing Bitcoin above rising EMA 9 and EMA 20 lines may consider pullback opportunities rather than chasing an extended price move.
The EMA 9, EMA 20, and EMA 50 comparison illustrates how different moving averages identify immediate momentum and broader intraday trends.
Limitation: Frequent price crosses in range-bound markets create overlapping signals and potential whipsaws.
-
Volume Weighted Average Price (VWAP): Best for Intraday Average Price
Volume Weighted Average Price measures the average trading price weighted by transaction volume over a selected period.
Its calculation divides cumulative typical price multiplied by volume by cumulative volume. Typical price commonly equals (high + low + close) / 3.
VWAP provides an intraday price reference. Trading above a rising VWAP may support bullish intraday bias, while trading below a falling VWAP may suggest selling pressure.
Consider a trader monitoring the BTC/USDT spot market on Gate.com. If price crosses above VWAP and holds that level during increasing trading activity, the trader may interpret it as improving short-term strength.
However, VWAP isn't an objective measure of fair value. Its calculation depends on the selected market, trading session, and reset settings.
The VWAP versus EMA approach shows why volume-based price positioning and moving-average momentum serve different purposes.
-
Relative Strength Index (RSI): Best for Momentum Shifts
The Relative Strength Index is a momentum oscillator measuring the relative strength of recent upward and downward price changes on a scale from 0 to 100.
Typical interpretations include:
-
Above 70: potentially overbought conditions.
-
Below 30: potentially oversold conditions.
-
Above 50: stronger upward momentum.
-
Below 50: stronger downward momentum.
Scalpers may use a 14-period RSI or experiment with shorter settings for faster responses.
For example, RSI recovering above 50 while price holds support can serve as a confirmation tool for a bullish setup.
The catch is that RSI can remain overbought during a strong trending market. A reading above 70 isn't automatically a sell signal.
-
Moving Average Convergence Divergence (MACD): Best for Momentum Confirmation
Moving Average Convergence Divergence compares two exponential moving averages to identify changes in momentum and price direction.
The standard MACD indicator uses:
-
12-period EMA minus 26-period EMA.
-
A 9-period EMA signal line.
-
A histogram showing the difference between MACD and its signal line.
A MACD crossover above the signal line may suggest strengthening upward momentum. A crossover below it may indicate weakening momentum.
The zero line separates positive and negative MACD readings, helping traders evaluate trend direction.
MACD can confirm short-term momentum shifts, but its smoothing introduces lag. A signal may appear after a substantial portion of the price movement has already occurred.
The MACD indicator's relationship with RSI helps explain why combining trend-following and bounded momentum indicators can be useful.
-
Bollinger Bands: Best for Volatility and Range-Bound Markets
Bollinger Bands consist of a middle moving average and two outer bands based on standard deviations.
A common configuration uses a 20-period SMA with bands positioned two standard deviations above and below it.
When bands contract, market volatility has decreased. Expansion signals increasing volatility and potentially stronger price moves.
In range-bound markets, scalpers may watch price reactions near the outer bands. During crypto breakout trading, expanding bands can help identify developing volatility.
A touch of the upper band doesn't guarantee that price reverses. Strong trends can carry price along an outer band for extended periods.
-
Average True Range (ATR): Best for Volatility-Based Risk Management
Average True Range measures volatility using recent true ranges, accounting for gaps between consecutive candles.
ATR doesn't predict price direction. Instead, it estimates how much an asset has been moving.
Suppose Bitcoin's five-minute ATR is $40. A trader considering a $10 stop-loss should recognize that ordinary short-term fluctuations could reach that distance relatively easily.
ATR-based stops can adapt to market volatility, although traders must still place them around meaningful price structure.
The ATR indicator is particularly useful when news events or market activity cause volatility to change rapidly.
-
Trading Volume: Best for Confirming Price Movement
Trading volume measures how much of an asset trades during a selected period.
A breakout accompanied by expanding volume may indicate greater market participation. Conversely, a move occurring on declining volume can warrant caution.
Volume indicators such as On-Balance Volume and Volume Profile add context about participation and traded-price distribution.
Advanced scalpers also examine order book depth and volume delta to distinguish aggressive buying from aggressive selling.
However, visible order book liquidity can change or disappear quickly. Volume confirms activity, not the certainty of continuation.
How to Build a Complete Scalping System
A complete scalping system combines market context, entry confirmation, and predefined risk controls.
A practical three-indicator configuration might use:
-
EMA 9 and EMA 20: Identify short-term trend direction.
-
RSI: Confirm whether market momentum supports the setup.
-
ATR: Evaluate volatility and determine whether a proposed stop is reasonable.
For example, consider a five-minute ETH/USDT chart with EMA 9 above EMA 20, RSI recovering above 50, and price forming a higher low.
A trader could wait for price confirmation before considering an entry, with the stop positioned beyond a relevant swing low. Position size would then depend on the distance to that stop and the trader's predefined risk budget.
Multi-timeframe analysis adds context. A bullish five-minute setup aligned with a 15-minute uptrend may be more coherent than one trading directly into higher-timeframe resistance.
Choosing the Best Scalping Indicators for Market Conditions
The best scalping combination changes with the environment.
| Market Conditions |
Useful Combination |
| Trending market |
EMA + RSI + ATR |
| Range-bound market |
Bollinger Bands + RSI |
| Breakout conditions |
Volume + Bollinger Bands + EMA |
| Intraday pullbacks |
VWAP + EMA + Volume |
| High volatility |
ATR + Market Structure |
Forex scalping frequently uses similar indicators on major forex pairs, although crypto scalping must account for continuous trading, fragmented liquidity, and exchange-specific execution.
There is no universal 7–10-pip profit target that transfers meaningfully from forex to crypto. Crypto traders typically evaluate percentage movements, spreads, volatility, and trading fees instead.
Scalping Risks and Common Mistakes
Scalping requires substantial concentration and discipline. Rapid entries, repeated losses, and constant market monitoring can create emotional stress.
High transaction costs are particularly damaging. If a scalp captures 0.20% before costs but incurs 0.08% in combined fees and slippage, only 0.12% remains before other expenses.
Too many indicators can also delay decisions. Three momentum indicators may produce overlapping signals without improving the trading strategy.
The U.S. SEC's investor education resources warn about the substantial financial and psychological risks associated with active day trading.
The CFTC also warns that cryptocurrency volatility and leveraged positions can amplify losses.
Scalpers should define stop-loss levels, limit position exposure, and avoid relying on technical signals during unpredictable news events. There is no universally safe percentage of account capital to risk, and risking 5% on a single trade can be substantial.
Conclusion
The seven best indicators for scalping crypto are EMA, VWAP, RSI, MACD, Bollinger Bands, ATR, and trading volume.
EMA and VWAP help establish price direction, RSI and MACD reveal momentum, Bollinger Bands and ATR measure volatility, and volume confirms participation.
For most scalping strategies, two or three complementary tools are more manageable than seven simultaneous signals. Execution costs, market liquidity, and consistent risk management ultimately matter more than indicator quantity.
FAQ
What is the best indicator for crypto scalping?
EMA is a practical starting point because it responds relatively quickly to recent price changes. VWAP is useful for intraday bias, while RSI adds momentum confirmation. No single indicator consistently outperforms all others.
How many indicators should I use for scalping?
Two or three complementary indicators are usually sufficient. A combination of a trend indicator, momentum indicator, and volatility tool can cover different decisions without excessive duplication.
Is the one-minute or five-minute chart better for scalping?
One-minute charts provide more entry opportunities but contain greater market noise. Five-minute charts often produce smoother signals and allow more time for interpretation. Both require attention to the broader trend.
Can beginners use scalping indicators?
Beginners can study scalping indicators, but live scalping is generally unsuitable without trading experience. Rapid execution, transaction costs, emotional pressure, and leverage can magnify mistakes. Simulated trading can help traders evaluate setups before risking capital.
Is crypto scalping the same as high-frequency trading?
No. Manual crypto scalping involves frequent short-term trades, while high-frequency trading generally uses automated algorithms and specialized execution infrastructure operating at much higher speeds.
Can scalping indicators guarantee profitable trades?
No. Technical indicators interpret historical price and volume data rather than predict future prices reliably. False signals, delayed execution, spreads, fees, and unexpected volatility can turn apparently favorable setups into losses.
Disclaimer: This article is for educational purposes only and does not constitute investment advice. Cryptocurrency trading involves substantial risk, particularly when using leverage or short-term speculative strategies. Technical indicators and historical market patterns do not guarantee future results.







