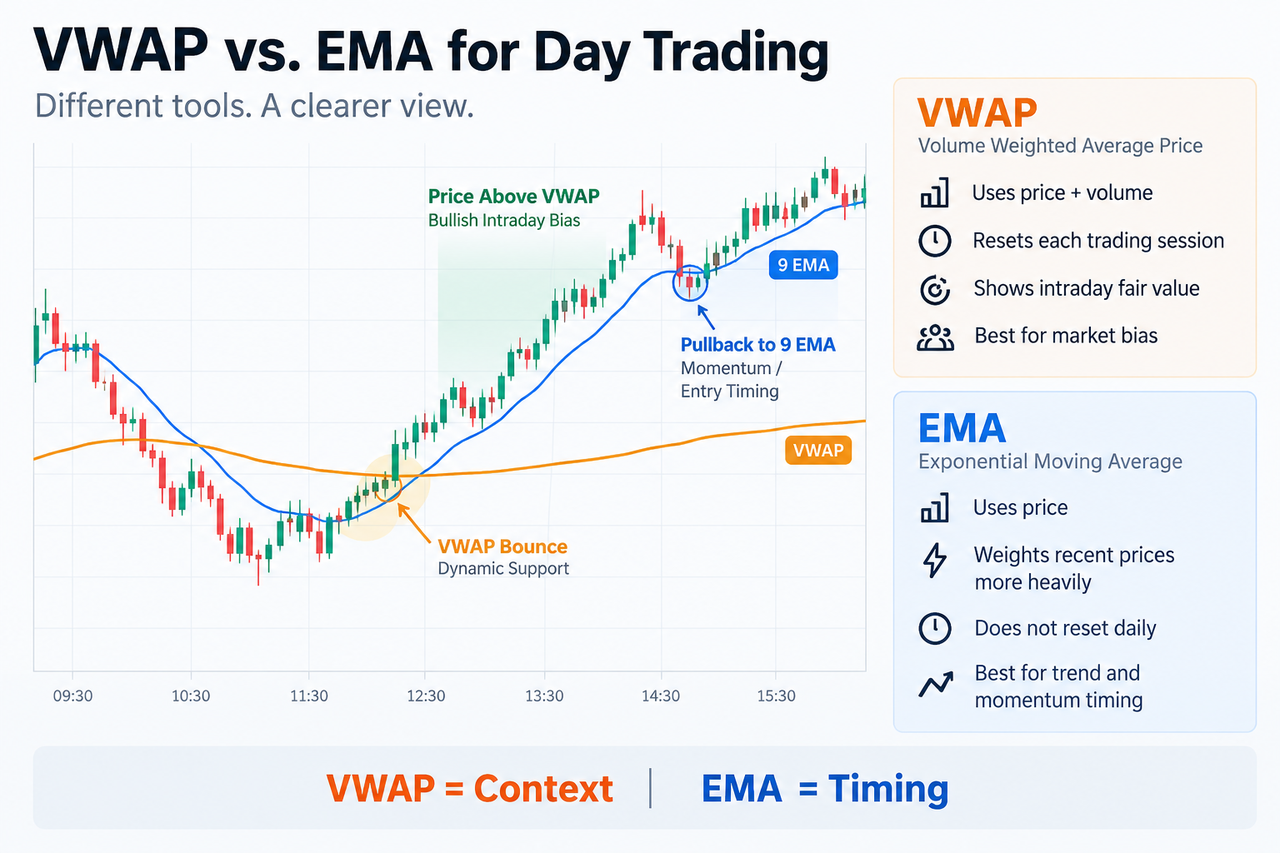
For intraday traders deciding between VWAP vs. EMA, the choice doesn't have to be either-or. VWAP can show whether price is trading above or below the session's volume-weighted average price, while a fast EMA such as the 9 EMA can show whether recent price action is gaining or losing momentum. Using both can give a clearer picture, although neither eliminates false signals or replaces risk management.
Key Takeaways
-
VWAP uses price and trading volume to estimate an intraday volume-weighted average price and normally resets for each trading session.
-
Price above VWAP is commonly interpreted as bullish intraday positioning, while price below it suggests bearish positioning.
-
EMA gives more weight to recent prices and can react more quickly to changing short-term trends than a simple moving average.
-
VWAP is often better for market context; EMA is usually better for momentum and entry or exit timing.
-
Both indicators can become unreliable in sideways, thin, or unusually volatile markets, so one indicator shouldn't determine a trading decision by itself.
VWAP vs. EMA at a Glance
| Feature |
VWAP |
EMA |
| Full name |
Volume Weighted Average Price |
Exponential Moving Average |
| Main inputs |
Price and volume data |
Price data |
| Weighting |
More weight to periods with high volume |
More weight to recent prices |
| Reset |
Usually resets each trading session |
Does not reset daily |
| Main use |
Intraday fair value and market bias |
Trend direction and momentum |
| Typical day-trading settings |
Session VWAP |
9, 20 or 50 periods |
| Dynamic support/resistance |
Often |
Often |
| Best suited to |
Intraday context |
Entry timing and trend filtering |
| Main weakness |
Can lag in strong trends |
Can whipsaw in sideways markets |
The distinction is simple: VWAP asks where most trading activity has occurred relative to price, while EMA asks where recent prices are moving.
What Is VWAP?
VWAP stands for volume weighted average price. It combines price and volume data so that prices associated with greater trading volume have more influence on the final value.
A common VWAP calculation is:
VWAP = Cumulative (Typical Price × Volume) ÷ Cumulative Volume
Typical price is often calculated as:
Typical Price = (High + Low + Close) ÷ 3
That makes VWAP different from a conventional moving average. If one five-minute period records much more volume than another period at the same price, the high-volume interval contributes more heavily to the VWAP calculation.
FINRA's trade-reporting guidance also recognizes VWAP as a transaction-pricing benchmark in securities markets, including transactions priced using an end-of-day VWAP.
The VWAP indicator normally resets at the beginning of a new trading session. This gives day traders a fresh reference for that session rather than carrying yesterday's average into today's market.
How Day Traders Interpret the VWAP Line
When price remains above the VWAP line, traders often interpret the session as having a bullish bias. Price below VWAP can suggest bearish conditions.
VWAP may also behave like dynamic support or resistance. Suppose Bitcoin is trading above VWAP during a strong intraday move. Price pulls back toward the line, holds, and then bounces. That price bounce can strengthen the case that VWAP is acting as potential support.
The reverse can occur during a short trade setup. Price may rally toward VWAP from below and then be rejected, turning the VWAP line into potential resistance.
These reactions aren't guaranteed. In a strong trend, price can remain well above or below VWAP for an extended period. VWAP's cumulative calculation can also make it slow to follow rapidly accelerating price action.
A trader using the BTC/USDT market on Gate.com, for example, can compare intraday price action with volume rather than judging a VWAP reclaim or VWAP break from price alone.
What Is EMA?
EMA stands for exponential moving average. Unlike VWAP, EMA doesn't use real volume as an input. It smooths price while assigning more weight to recent prices than older observations.
The basic smoothing factor is:
2 ÷ (Number of periods + 1)
A shorter EMA responds more quickly. The 9 EMA, for instance, closely follows short-term price momentum, while an EMA 20 smooths more noise. An EMA 50 is slower again and can work as a broader trend filter.
EMA is continuous. A 20-period EMA on a five-minute chart follows the latest 20 five-minute periods, while the same EMA on a daily chart reflects daily price observations. It doesn't automatically restart with each trading day.
The CMT Association describes EMA calculations as allowing older observations to fade gradually instead of dropping abruptly from the calculation, which helps explain why EMA generally responds more smoothly to changing price trends.
VWAP or EMA: Which Is Better for Day Trading?
Neither is universally better. Their usefulness depends on what a trader is trying to measure.
For intraday market context, VWAP has the advantage. It incorporates total volume and shows where the session's volume-weighted average price sits. That makes it useful for judging whether current price is extended above or below an intraday benchmark.
For short-term momentum and trade timing, EMA can be more responsive. A rising 9 EMA or 20 EMA with price repeatedly bouncing from the line may indicate a strong trend. Price crossing below a rising EMA can also warn that bullish momentum is weakening, although a single cross isn't automatically a sell signal.
VWAP is therefore closer to a fair-value and market-bias tool. EMA is closer to a momentum and trend-direction tool.
Combining VWAP and EMA
Combining VWAP with EMA can separate context from timing.
Imagine price is above VWAP, which suggests bullish intraday conditions. The 9 EMA is also rising, and price pulls back toward the EMA before bouncing. A day trader may view the VWAP position as the broader trend filter and the EMA bounce as a potential entry trigger.
For a bearish setup, price might remain below VWAP while a falling EMA repeatedly rejects rallies. The same logic applies in reverse.
A large gap between VWAP and a fast EMA deserves attention too. It can show that recent momentum has moved price far from the session's volume-weighted average. Sometimes price continues trending; in other cases, the distance precedes a snapback toward VWAP. The gap alone can't predict which outcome comes next.
Traders may combine that structure with tools such as SuperTrend for intraday trend confirmation, the relative strength index, or volume indicators. More indicators don't automatically create a better trading strategy, though. Each should answer a different question.
Where VWAP and EMA Can Fail
Both VWAP and EMA are lagging indicators because they are calculated from existing market data.
Sideways markets are especially difficult. Price may repeatedly cross VWAP and a fast EMA without developing a sustained trend, creating multiple potential entry points that quickly fail.
Liquidity matters as well. VWAP is most meaningful where reliable volume data exists. Thin markets or fragmented volume can make the displayed average less representative of broader trading activity.
EMA has its own sensitivity problem. A short EMA reacts quickly, but that also means sudden price fluctuations can produce frequent false crosses. Longer moving averages reduce some noise but react more slowly.
Execution adds another layer. A chart signal doesn't guarantee that a trader's average fill will match the displayed market price. The SEC treats spreads, execution price, price improvement and execution speed as distinct aspects of execution quality, which is why indicator signals and actual trade results shouldn't be treated as the same thing.
Conclusion
For VWAP vs. EMA in day trading, VWAP is generally more useful for understanding intraday fair value and market bias, while EMA is more responsive for identifying trend direction, momentum and possible entry or exit points.
They work especially well together because they measure different parts of price behavior. VWAP can establish whether the market is trading above or below its volume-weighted benchmark, while EMA can help judge whether recent momentum supports that bias.
Neither should be treated as a standalone buy or sell signal. Price structure, liquidity, volume, volatility and risk management still matter, and past performance or repeated historical price bounces don't guarantee future results.
FAQ
Is VWAP better than EMA for day trading?
VWAP can be more useful for establishing intraday market bias because it incorporates both price and volume. EMA tends to be more responsive when traders want to follow short-term momentum. Many day traders therefore use the two for different purposes rather than choosing only one.
What EMA is commonly used with VWAP?
The 9 EMA and 20 EMA are common short-term choices because they react relatively quickly to recent price changes. A 50 EMA moves more slowly and may be used to judge the broader intraday trend.
Does price above VWAP mean traders should buy?
No. Price above VWAP is commonly interpreted as bullish intraday positioning, but it isn't a guaranteed long-trade signal. Price action, volume, trend structure, volatility and risk controls should also be considered before risking real money.
Can VWAP act as support and resistance?
Yes, VWAP can behave as dynamic support or resistance when price repeatedly reacts around the line. A bounce above VWAP may reinforce potential support, while rejection from below can indicate resistance, but either level can break.
Does VWAP reset every day?
Standard session VWAP normally resets when a new trading session begins. Anchored VWAP is different: it starts calculations from a trader-selected event or date rather than automatically resetting each day.
Disclaimer: This content is for educational purposes only and does not constitute financial or investment advice. Technical indicators can produce false signals, and historical market behavior does not guarantee future results.







