Share your thoughts
placeholder
Article
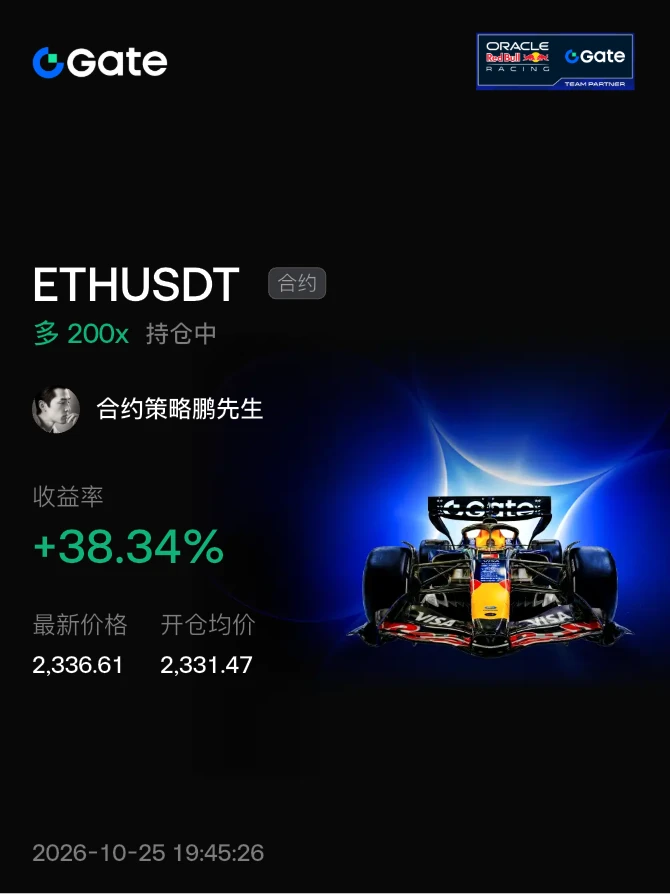
88 didn't make it into the screenshot—it happened too fast. 9999, quick reflexes finally got it in the screenshot! 29999, may we all stay together for a long, long time. Good luck to everyone who sees this. Let's keep moving forward and striving together💪and make progress together
From 15 to 78, from zero to 753 million—what does gStocks’ product evolution tell us?
Guys, RWA perpetual contracts did not emerge overnight. Gate’s gStocks product line is the best “living history.”
Gate’s tokenized stocks expanded from 15 trading pairs at launch to 78 trading pairs, with peak daily trading volume reaching $753 million. From 15 to 78, from zero to $753 million—this was not a burst over a month or two, but sustained, systematic product development.
What does this tell us? RWA is not a short-term trend to “pump and dump,” but a long-term sector supported by real products and su
SNDK-3.93%
solana:6GmAFSYs4gk3FDao5FzzySQpPZaWsa4rUJHacpMpUNgx / @LaunchOnSF
Yesterday we got the news that Apple decided to remove the $PUMP app from their app store. This immediately gave leverage to the STONK market and allowed traders to assume that the PUMP action that we saw previous to that was over.
Are you still confident in PUMP?
SOL+2.21%
AAPL+1.80%
PUMP-5.45%
$ETH Signal】1H volume breakout above the upper band, buy on the pullback
$ETH 1H volume expanded 12x, and the price directly broke through the upper Bollinger Band at 2582.96, with RSI 82.50 hovering at a high level. The 4H MACD formed a golden cross above the zero line, while the histogram at 9.10 continues to expand, and the bullish attack momentum remains intact. The order book buy/sell depth ratio is 0.14, with extremely thick sell orders stacked above, while buy orders absorb them and push prices higher. The funding rate is 0.0081%, OI is stable, and leverage buildup is not overly heated
post-image
ETH+4.09%
BTC+1.09%
SOL+2.21%
$ETH USDT Long Setup
🔴 Entry: 2,470 - 2,500
🎯 TP1: 2,550
🎯 TP2: 2,600
🎯 TP3: 2,660
🟢 SL: 2,420
ETH reversed sharply off the 2,403 low, breaking above MA(7), MA(25) and MA(99) with a massive green candle on huge volume confirming strong buyer interest. Price has snapped out of its downtrend, signaling a fresh shift in momentum. As long as it holds above 2,460, continuation toward the 2,600 zone looks likely.
⚠️ This is not financial advice. Always do your own research (DYOR).
#LearnWithGM
post-image
ETH+4.09%
$QCOM
After reaching the H+S target, it started rising again. It broke 💥 the correction band
post-image
QCOM+3.22%
#BonkGuyBullishOnUSELESS
The meme market is getting interesting again as Bonk Guy shows a bullish outlook on USELESS, putting the token back under the spotlight.
In crypto, attention can move extremely fast. A project can remain quiet for days and then suddenly become one of the most discussed assets on the market after a notable comment, trader reaction or community narrative.
That is exactly what makes meme tokens so unpredictable.
USELESS has already attracted significant attention, and a bullish stance from a recognizable figure within the meme-coin community adds another layer to the cur
$ETH Signal】Long · 1H volume-backed breakout / 4H MACD bullish crossover
$ETH The 1H MACD red bars are expanding, the 4H histogram has turned positive, and the price has moved above the 1H Bollinger upper band at 2496.89, with the 4H upper band at 2513.20 within reach. The 1H volume rose to 1.04 million at 12:00, then shrank to 49,000 at 13:00, indicating that price-chasing activity has paused. The order book depth ratio is 0.14, with denser sell walls; RSI is 62.65 on 1H and 57.25 on 4H—hot but not extreme. The risk-reward ratio is acceptable here, with a clear stop-loss boundary, making buy
post-image
ETH+4.09%
By the time I got back from the restroom, the candlestick chart had already wiped out the losses for me. 💨
A few days ago, before bed, I saw $PTB grinding at high levels. Volume kept dwindling, but it could neither break higher nor fall, making it obvious that the upward push had already run out of steam, as if waiting for someone to take the supply. I shorted based on the logic of a weak rebound, with an average entry price of 0.0008905. When I got up in the morning, it had gone straight down, and the current price was already 0.0006687, with unrealized profit at +610.77%. 😶
Close 70% first
post-image
PTB+6.52%
ZEC-0.69%
DOGE+1.54%
This was purely the market being in a good mood and casually tossing out some gold coins—one just happened to land on my head. During the intraday bottoming phase, I watched so hard my eyes nearly went blind, while $AKE churned around 0.0088431, moving sideways at the bottom without breaking the key level. I had just one thought at the time: someone was quietly accumulating at this level, so why should I hold back? I went straight in long. I just refreshed the page: 0.0142582, +1499.65%. This big bite of profit has me grinning from ear to ear. Panic comes from having no plan, and losses come
post-image
AKE-10.90%
SNDK-2.17%
DOGE+1.54%
$ETH is trending towards a candle close below the trending dots similar to Bitcoin yesterday.
ETHUSDT
Perp
2,499.16
+3.07%
Large liquidation level at $2,200, several reasons for the yellow target box.
How many targets get hit?
post-image
ETH+4.09%
BTC+1.09%
Everyone watching SYMBOL right now is about to regret ignoring this setup.

$SOL /USDT - LONG

Trade Plan:
Entry: 103.80 – 104.30
SL: 101.61
TP1: 105.88
TP2: 107.10
TP3: 108.92

Why this setup?
Why now? The daily trend is bullish, which sets the stage for a continuation move, and the 1h price sitting at 104.05 confirms we are already inside the entry zone of 103.80 to 104.30. The 15m RSI at 69.22 shows momentum is strong but not yet exhausted, while the 1h ATR of 1.01557 tells us the next leg can easily cover the distance to TP1 at 105.88 and extend toward TP2 at 107.10. This trade is inval
SOL+2.20%
Insiders are calling this the exact reversal point for SYMBOL after a grinding bear market.

$SUI /USDT - LONG

Trade Plan:
Entry: 0.7374 – 0.7424
SL: 0.7093
TP1: 0.7629
TP2: 0.7782
TP3: 0.8012

Why this setup?
Why now? The 1h price is sitting at 0.7398 while the 4h trend on the higher timeframe is still bearish, creating a tension that favors a sharp snapback. The 15m RSI at 56.68 shows the asset is neither overbought nor oversold, meaning momentum is neutral and ready to tilt. The 1h ATR of 0.009821 tells us the recent volatility is tight enough that a breakout from the entry zone of 0.73
post-image
SUI-1.92%
ZEC/USDT
ZEC is showing a strong recovery on the 15-minute chart after bouncing from the $1,054.57 low. Price is currently around $1,153, with a sharp bullish candle pushing above the short-term moving averages.
The key point here is the volume-backed breakout. MA5 is around $1,113.59, while MA10 and MA30 are near $1,105.63–$1,105.73, giving the current move a stronger bullish structure as long as ZEC holds above this zone.
Key levels I’m watching:
• Current price: $1,153
• Immediate resistance: $1,177–$1,183
• Major resistance / 24H high: $1,216.52
• Support: $1,113–$1,105
• Stronger support
post-image
ZEC-0.65%
$ETH is trending towards a candle close below the trending dots similar to Bitcoin yesterday.
ETHUSDT
Perp
2,499.16
+3.07%
Large liquidation level at $2,200, several reasons for the yellow target box.
How many targets get hit?
post-image
ETH+4.09%
BTC+1.10%
I keep seeing people say that some market maker blew up and dumped all the project’s tokens. Can you stop speaking in riddles and just say which market maker it is, so retail investors can avoid it?
post-image
$ETH
Major breakthrough!
post-image
ETH+4.04%
The files from Lolita Island were officially decrypted today,
The files show that
70% of Bitcoin was funded by Epstein.
Epstein and his masters control the Bitcoin under Satoshi Nakamoto's name.
post-image
BTC+1.09%
$BTC Today’s News|U.S. August CPI Released, Core Inflation Exceeds Expectations, Rate Hike Expectations Heat Up
The U.S. August CPI data was officially released in the evening Beijing time. Headline CPI rose 0.4% month-on-month and 3.4% year-on-year, in line with market expectations; however, core CPI rose 0.3% month-on-month, above the expected 0.2%, once again highlighting the persistence of inflation and raising market expectations for a rate hike at the Federal Reserve’s September policy meeting. After the data release, U.S. Treasury yields surged in the short term, while the Dollar Index
post-image
BTC+1.09%
Load More

Join 40 M users in our growing community

⚡️ Join 40 M users in the crypto craze discussion

💬 Engage with your favorite top creators

👍 See what interests you

View More