Share your thoughts
placeholder
Article
MARKET ALERT - PEPE/USDT
analysis and trading opportunities.
​4-Hour Timeframe Analysis (TF 4H)
​Market Condition: The price is at 0.000003631, above the 20 EMA (0.000003567) and 50 EMA (0.000003583). This indicates a short-term rebound and positive consolidation above the 200 EMA (0.000003337), which is acting as strong support.
​Trading Opportunity: Potential Long (Buy) if the price holds above the 50 EMA. The nearest resistance target is in the 0.000004153 to 0.000004558 range. Set the Stop Loss (SL) below the 200 EMA, around 0.000003300.
​1-Day Timeframe Analysis (TF 1D)
​Market Condition:
post-image
PEPE+1.43%
BTC+0.17%
ETH+0.89%
  • 3
September 6 $BTC early-morning analysis
The 4-hour chart continues its range-bound recovery, up 0.78%, with net capital inflows of 143 million and buying funds continuing to return. The price has held above the Bollinger middle band at 79465.4, with solid support at the 78618 low below; large sell orders are placed in the order book, indicating clear overhead selling pressure. The Bollinger upper band at 82352.8 is strong mid-term resistance, while the lower band at 76578 serves as a key defense level. The market is experiencing a recovery rebound after the decline and has not yet entered a s
post-image
BTC+0.17%
ETH+0.88%
Everyone’s chasing BNB’s green candle—but the 4h clock just struck midnight for bulls.

BNB/USDT - SHORT

Trade Plan:
Entry: 776.1 – 779.7
SL: 800.0
TP1: 761.3
TP2: 750.3
TP3: 733.8

Why this setup?
- RSI on the 15m is screaming at 73.61—overbought before the daily range even wakes up.
- Price is pinned at 777.9, but the 1D trend is “range,” not rocket fuel.
- ATR (1h) at 7.07 means the next 4h move could slice 30 points off your long.
- Why now? The 77.4 confidence SHORT is waiting at the exact resistance—this is the “sell the news” window, not the “buy the dip” one.

Debate:
Are we
BNB+7.68%
Everyone’s staring at Bitcoin—but ETH just printed a 4h trap that smells like October 2025.

$ETH /USDT - SHORT

Trade Plan:
Entry: 2473.11 – 2478.15
SL: 2499.86
TP1: 2457.46
TP2: 2445.34
TP3: 2427.17

Why this setup?
- 1D is range, not trend—so this is a scalp, not a story.
- RSI (15m) at 67.49 = overheated micro-momentum, fading into the 4h short bias (55.4 conf).
- Entry 2475.63 sits right under invalidation 2460.15—tight risk, asymmetric payoff to TP1 2457.46.
- Why now? The 1h ATR (10.09) is compressing—breakouts are violent, and the range is squeezing toward the lower band.

De
ETH+0.89%
Everyone’s long LTC at 54.78—I’m counting the seconds until the 4h rug pull hits SYMBOL.

$LTC /USDT - SHORT

Trade Plan:
Entry: 54.64 – 54.92
SL: 56.58
TP1: 53.43
TP2: 52.53
TP3: 51.17

Why this setup?
- RSI on the 15m is already overheated at 68 while price sits mid-range—no fuel left for upside.
- 1D trend is *range*, and we’re at the top of that range with a 77% short conviction.
- ATR (0.58) is tight, meaning the breakout is violent when it comes—and it’s pointing to TP1 at 53.43 before you blink.
- Why now? Because the 4h structure is rejecting 54.92, and the waiting game ends w
LTC+7.89%
I only meant to snag a free breakfast, but the market ended up making dumplings out of me for half a year.
When $BE was grinding along around 200.9 intraday, it stayed flat long enough to nearly put me to sleep, but there was clearly buying support below and the low-volume selling couldn’t push it down. I judged that the bottom was solidified and entered a long position directly, without hesitation.
I just checked the chart, and the price has already surged to 265.1, +1537.65%. This bite of meat feels great—those already on board should have woken up laughing.
Take 80% off the table first, an
post-image
BE+7.02%
ZEC-0.74%
SNDK+3.22%
$100K coming soon
post-image
I had just switched the app to the background when it shot up in an instant—is it playing hide-and-seek with me? A few days ago, the last thing I looked at before bed was ZORA. It had been moving sideways at the bottom for several days, with funds quietly entering and buy orders piling up, yet the price remained suppressed—a textbook night before a breakout.
I said it then: don’t hesitate to go long. I entered at 0.00793, and when I woke up this morning, 0.00885 had already given me the answer: +281.6% secured.
Don’t let profits inflate, and don’t let drawdowns cause despair. This gain feels g
post-image
ZORA+1.04%
LAB+1.60%
DOGE+7.09%
Which #MemeCoin will do a 100X in 2026?
post-image
MEME+6.31%
  • 1
Everyone’s staring at H/USDT’s bounce—but the 4H tape just whispered a secret that 95% of traders will ignore.

H/USDT - SHORT

Trade Plan:
Entry: 0.07631 – 0.07705
SL: 0.08024
TP1: 0.07401
TP2: 0.07222
TP3: 0.06955

Why this setup?
- RSI (15m) is pinned at 33.52—weak momentum, not oversold enough to reverse a bearish 1D trend.
- ATR (1h) at 0.001485 means volatility is contracting—perfect setup for a liquidity sweep below 0.07631.
- With TP1 at 0.07401 and TP2 at 0.07222, the path of least resistance is down, not up.
- Why now? The 0.07960 invalidation is miles away, giving shorts ro
Everyone’s chasing longs on $ESPORTS /USDT—here’s why the 4h chart just flipped the script on you.

$ESPORTS /USDT - SHORT

Trade Plan:
Entry: 0.01470 – 0.01478
SL: 0.01515
TP1: 0.01443
TP2: 0.01423
TP3: 0.01392

Why this setup?
The 1D trend is bearish, and the 4h signal is screaming SHORT with 95% confidence.
- Entry zone: 0.01474 (tight range: 0.01470–0.01478)—we’re already inside the kill box.
- RSI on 15m sits at 44.81—weak momentum, no bounce fuel.
- ATR (1h) of 0.00017 means moves are compressed—breakouts are violent, and the path of least resistance is down.
Why now? Price is
ESPORTS+0.07%
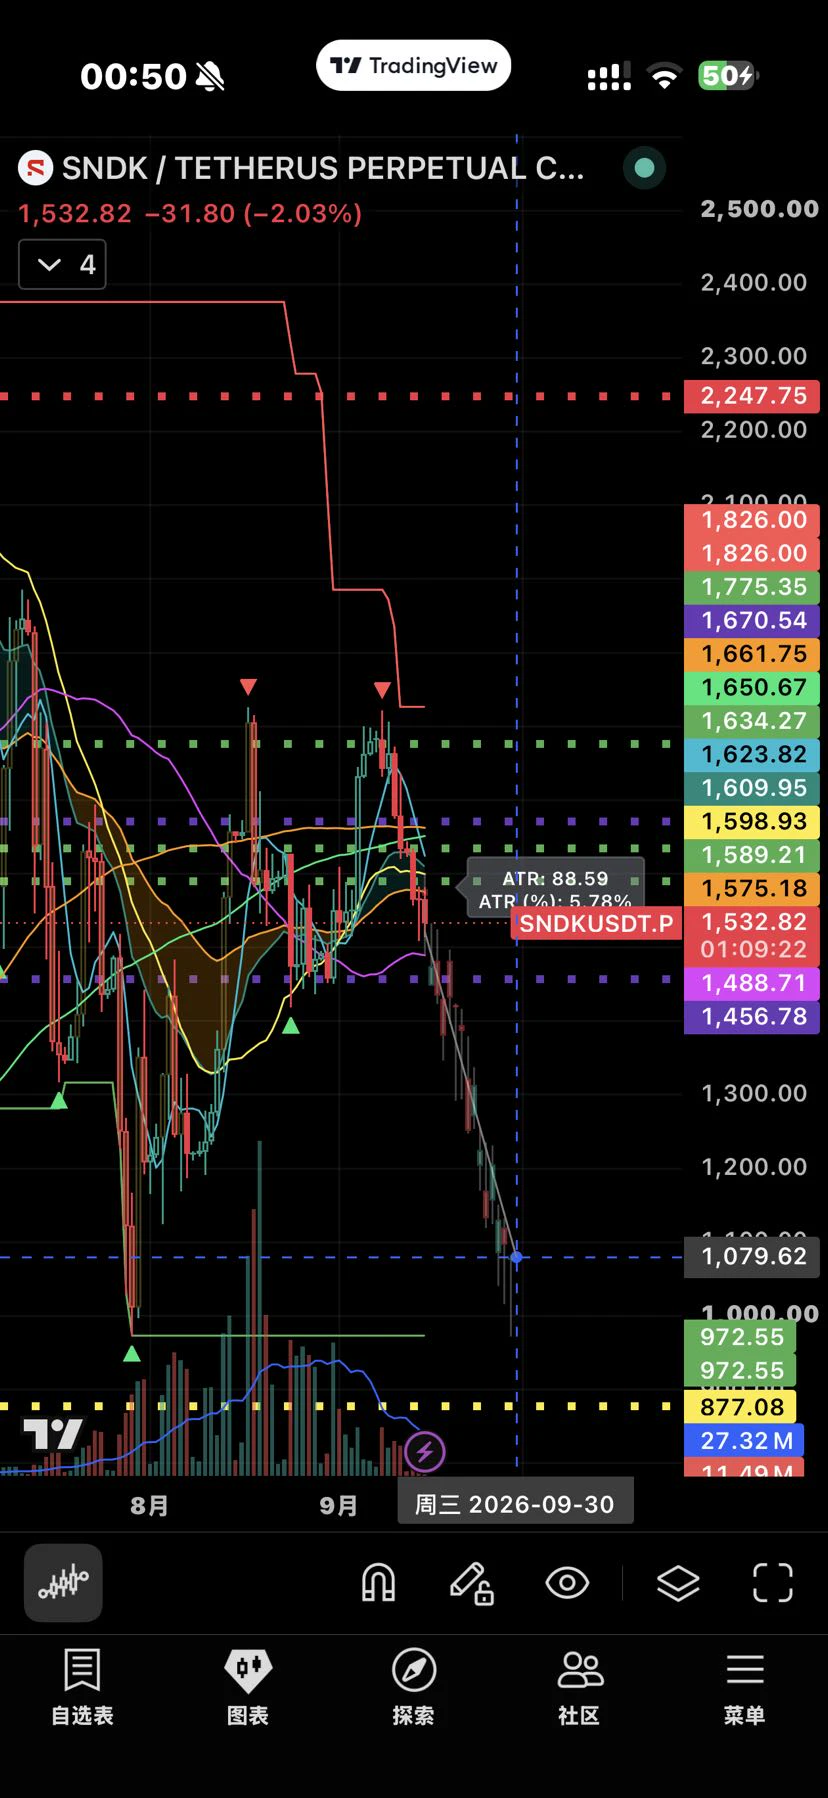
Everyone’s long SNDK, but the 4h chart just whispered a secret the crowd missed.

$SNDK /USDT - SHORT

Trade Plan:
Entry: 1762.72 – 1768.80
SL: 1794.96
TP1: 1743.86
TP2: 1729.26
TP3: 1707.36

Why this setup?
- RSI 15m at 62.25 shows fading momentum, not strength.
- ATR 1h at 12.16 means volatility is tight—waiting to snap.
- Price pinned at 1765.76 with TP1 at 1743.86: a clean 1.2% drop zone, no noise.
- Why now? Range-bound 1D trend + SHORT bias = mean reversion is the only game in town.

Debate:
Is the 1768.80 high the bull trap that sends us to TP1, or do we fade the fade?

⚠️ Pe
SNDK+3.22%
$1000 to $100,000 Crypto Trade Challenge Today
live-cover
LIVE956
While everyone else is fighting for space in the hot-coin pond, I set up a net in the obscure corners of $BULLA USDT. With 10x leverage, an entry price of 0.028293, and the latest price at 0.087742, the return soared to an astonishing +2085.54%!
I didn’t dare use 50x this time—I was afraid I’d need heart bypass surgery—but 10x still sent me to the moon! BULLA had been playing dead for a while, trading sideways like a rock and shaking out countless impatient retail traders. I crouched in the corner silently reciting Wyckoff, while secretly panicking like crazy.
Livermore once said that money is
post-image
BULLA+218.95%
BTC+0.17%
ETH+0.89%
Silver’s 15m RSI is screaming overheated at 68.7—but the 4h chart just whispered a secret no one’s listening to yet.

$XAG /USDT - SHORT

Trade Plan:
Entry: 66.28 – 66.34
SL: 66.63
TP1: 66.07
TP2: 65.92
TP3: 65.68

Why this setup?
Why now? The 4h bias flips SHORT (55% confidence) while the 1D stays range-bound—a classic squeeze setup.
- Price parked at 66.31, with entry tight between 66.28–66.34.
- TP1 at 66.07 is only 0.36% away—low-hanging fruit for scalpers.
- RSI 15m at 68.7 means momentum is stretched; gravity tends to win in ranges.
- SL at 66.63 caps risk at 0.48%, while TP3
XAG+0.20%
The most comfortable stage for shorting is when the market enters a one-way decline immediately after placing the order. With this kind of move, there is no need to keep watching the market—you can simply hold. For this move, $FLORK I waited until it rebounded to 0.028294 before entering, because it had previously broken below a short-term consolidation platform, and after a rebound confirmed the key level, it was more likely to develop into a trending move. After entry, the price did not give me many surprises, gradually declining all the way to around the current price of 0.023933, with unr
post-image
FLORK+20.39%
LAB+1.60%
SOL+1.91%
Most traders think XLM is dead—what if the range itself is the trap?

$XLM /USDT - SHORT

Trade Plan:
Entry: 0.18423 – 0.18501
SL: 0.18837
TP1: 0.18181
TP2: 0.17993
TP3: 0.17712

Why this setup?
- 4h bias is SHORT with 55% confidence—not a slam dunk, but a lean.
- Price sits at 0.18462, right at the range midpoint—no momentum, just indecision.
- RSI 15m at 58 shows weak bounce, but ATR 1h (0.00156) says volatility is shrinking—breakouts will be sharp.
- Targets: TP1 at 0.18181, TP2 at 0.17993—that's a 2.5% drop from here. In a range, the middle is the worst place to be long.

Debate:
post-image
XLM+3.11%
Trumps right hand man..
post-image
During the early morning surge, BTC briefly touched 80150. After rebounding above 80K, it failed to hold and then pulled back slightly again, currently fluctuating around 79900.
After Friday’s nonfarm payrolls sell-off, it has been steadily repairing and rebounding, but after multiple attempts to break through the 80K level, it has still failed to establish a firm foothold. Overhead pressure remains heavy, with further downside still possible.
Short positions above 80K can be held. Reduce the position after a pullback to around 79000. Only a firm hold above 80800 would improve the rebound stru
BTC+0.17%
Crypto Signals and Trding Insights
live-cover
LIVE914
Load More

Join 40 M users in our growing community

⚡️ Join 40 M users in the crypto craze discussion

💬 Engage with your favorite top creators

👍 See what interests you

View More