StacyMuur

vip
Active for: 2.8y
Peak Tier 0
No content yet
HYPE is still king by a mile.
Compared to last week, GMTrade's volume jumped 37% while StandX overtook Pacifica for 9th place. Oof.
Top perps protocols by 7-day volume by @DefiLlama ↓
• @HyperliquidX — $32.911B
Onchain exchange and L1
• @Aster_DEX — $7.181B
Multichain perpetual DEX
• @OfficialApeXdex — $6.802B
Self-custodial multichain perpetual and spot DEX
• @Lighter_xyz — $6.335B
ZK-rollup order-book perpetual exchange
• @edgeX_exchange — $5.568B
Layer 2 perpetual and spot exchange
• @variational_io — $5.091B
Onchain derivatives for crypto, stocks, commodities and indices
• @GMTrade_xyz — $
HYPE0.71%
ASTER-0.15%
LIT1.02%
EDGEX-6.97%
GRVT-1.73%
post-image
  • Reward
  • Comment
  • Repost
  • Share
Bitcoin’s 1+ year HODL Wave is rising again.
This is a metric that shows the percentage of BTC supply that hasn’t moved onchain for at least a year.
Here's how it compares with other timeframes:
→ Last August: ~64%
→ February: ~59%
→ Now: ~61%
A lot of BTC that moved around this time last year has now been sitting still for 12 months, so it gets counted in the 1+ year bucket.
On the other hand, Glassnode shows long-term holders sold a net ~212K BTC over the past 30 days.
So most BTC is still sitting untouched for over a year, even though some long-term holders have started selling recently.
I
BTC-0.30%
  • Reward
  • 2
  • Repost
  • Share
NexaCrypto:
LFG 🔥
View More
Tokenization platforms currently manage billions in onchain assets.
These are the top 10 by RWA value:
1. @Securitize: $4.98B
2. @Ondo: $3.60B
3. @Circle: $3.01B
4. @Tether: $2.66B
5. @FTI_US: $2.54B
6. @Spiko_finance: $2.35B
7. @Paxos: $1.92B
8. @Centrifuge: $1.65B
9. @Ethena: $1.46B
10. @STOKR_io: $1.35B
Securitize’s ~$5B is concentrated across just 25 RWAs, suggesting a smaller number of very large products. Ondo reaches $3.6B through a much broader catalog of 441 RWAs and 212K+ holders.
That works out to roughly $199M in RWA value per asset for Securitize versus ~$8M for Ondo.
Different wa
RWA-0.26%
ONDO1.57%
CRCLG-0.04%
USDT0.00%
  • Reward
  • Comment
  • Repost
  • Share
Bitcoin holders are still selling at substantial losses.
But the worst of the panic appears to be over (for now).
If you look at this Bitcoin realized losses chart, the current bars are generally below the massive spikes recorded during the sharpest sell-offs.
That suggests forced selling and outright panic are starting to cool down.
So, to me, this looks like a late-bear-market or bottom-building phase. But IMO, demand is still too weak to confirm that the bottom is actually in.
During times like these, I usually prefer to zoom out, reflect on Bitcoin’s historical performance, and avoid makin
BTC-0.30%
post-image
  • Reward
  • Comment
  • 2
  • Share
All jokes aside, what's the best & safest cold wallet on the market right now?
  • Reward
  • Comment
  • Repost
  • Share
The best stablecoin yield opportunities ($10M+ in TVL).
Data by @stablewatchHQ ↓
• @MidasRWA $mF-ONE — 16.56% APY
Yield comes from Fasanara's diversified strategy: private credit, fintech receivables, SME and real-estate-backed lending, plus delta-neutral digital asset positions.
• @opentrade_io $xSOLY — 13.80% APY
Delta-neutral SOL strategy combining staking returns with hedged perpetual futures positions.
• @opentrade_io $XDFIS — 12.96% APY
Diversified portfolio of public and private fixed-income assets.
• @gaib_ai $sAID — 10.01% APY
Tokenized portfolio of AI infrastructure financing deals.
MF-1.23%
SOL-1.32%
post-image
  • Reward
  • Comment
  • Repost
  • Share
More than $500B worth of BTC is sitting at a loss right now.
The green line on this chart tracks every coin that last moved at a higher price than where BTC trades today.
In simple terms, those coins are cooked.
But that money didn't disappear. It actually means a huge chunk of supply is held by people staring at a red position and deciding whether to wait or sell.
And so far, most of them are waiting. Holders sitting through the drawdown instead of dumping is usually what a bottom looks like while it's forming.
BTC-0.30%
post-image
  • Reward
  • Comment
  • Repost
  • Share
BlackRock just had the biggest month among onchain asset managers.
Three of the biggest 30-day flows on @RWA_xyz:
→ @BlackRock: +$302M
→ @circle: -$111M
→ @maplefinance: -$213M
At first glance, Circle and Maple look pretty bad here.
But their underlying products were still earning yield during the month.
Circle’s outflow came from USYC redemptions, while Maple’s came mostly from lenders withdrawing from syrupUSDC.
There’s no evidence of a maturity, exploit, or product failure behind either move. Investors simply reduced their positions or moved capital elsewhere.
Zoom out, and you'll see it's
BLK-0.87%
RWA-0.26%
SYRUP0.80%
CRCLG-0.04%
post-image
  • Reward
  • Comment
  • Repost
  • Share
I've been following @alignedlayer for a long time now, and I got a peek at a new product they're developing.
It's called LambdaVM, which is being built to prove that Aligned rollups process every transaction correctly, with Ethereum verifying the result.
In simple terms, financial infrastructure built today should not need to be rebuilt from scratch if quantum computers eventually weaken the cryptography that blockchains currently use.
This matters most for systems expected to run for decades, such as cross-border payment rails or institutional settlement networks.
I trust the team can make gr
ETH-0.41%
STRK1.60%
ZK0.68%
TOKEN-1.51%
post-image
  • Reward
  • Comment
  • Repost
  • Share
This is a real headline btw.
post-image
  • Reward
  • Comment
  • Repost
  • Share
Quick chart explainer for my frens, cause it's useful in current conditions.
This groups Bitcoin by how long each coin has sat still since it last moved onchain.
Younger bands growing = lots of BTC changing hands. Typical hype behavior: old holders sell, new buyers rush in.
Older bands growing = coins sitting in wallets, fewer sellers.
Right now, the younger bands are shrinking while the older ones are getting bigger.
The market is becoming less speculative and more patient, which IMO is a good sign and could point to a bottom slowly forming.
Ofc, just speculation for now, but it's fun to look
BTC-0.30%
post-image
  • Reward
  • Comment
  • Repost
  • Share
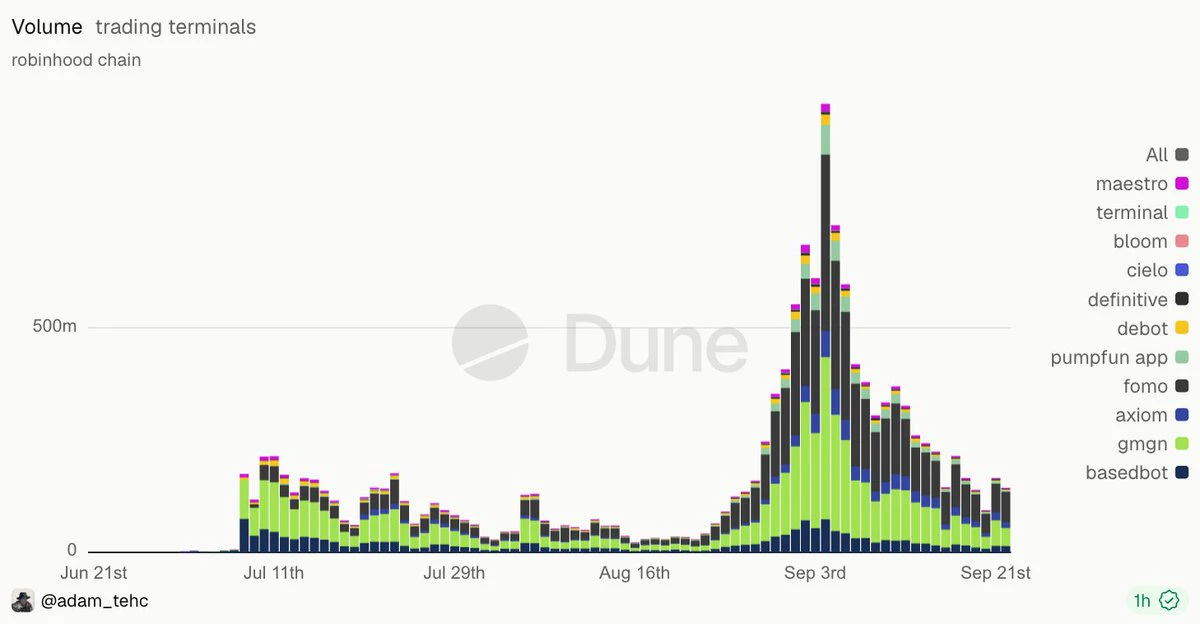
Fomo has onboarded almost 400K new active traders to its platform in a month.
We have a new insane marketing case study.
post-image
  • Reward
  • Comment
  • Repost
  • Share
Imagine Bitcoin gaining 449% in a single month. Sounds almost impossible today, but that’s exactly what happened in November 2013.
Here are Bitcoin’s best and worst returns for each calendar month since 2013:
❌ Worst
• January: -33.05% in 2015
• February: -31.03% in 2014
• March: -32.85% in 2018
• April: -17.30% in 2022
• May: -35.31% in 2021
• June: -37.28% in 2022
• July: -9.69% in 2014
• August: -18.67% in 2015
• September: -19.01% in 2014
• October: -12.95% in 2014
• November: -36.57% in 2018
• December: -34.81% in 2013
✅ Best
• January: +44.05% in 2013
• February: +61.77% in 2013
• March:
BTC-0.30%
post-image
  • Reward
  • Comment
  • Repost
  • Share
Crypto is now a $3+ trillion market.
So it would make sense that the CLARITY Act would put some basic rules into law.
The main changes:
→ It separates the token from the contract used to sell it
→ Fundraising stays under SEC oversight, while the token trades as a commodity under the CFTC
→ Exchanges and brokers would register with the CFTC
→ Customer crypto would count as customer property in bankruptcy
I know this isn't exactly what a decentralized network of peer-to-peer payments had in mind, but with a market this big, there have to be some rules.
post-image
  • Reward
  • Comment
  • Repost
  • Share
  • Pinned