Share your thoughts
placeholder
Article
Everyone’s cheering SOL at 103.75, but the 4h tape just whispered a secret—are you listening?

$SOL /USDT - SHORT

Trade Plan:
Entry: 103.61 – 103.89
SL: 105.14
TP1: 102.71
TP2: 102.01
TP3: 100.97

Why this setup?
Why now?
- RSI on the 15m is overheated at 66.31 while price hugs resistance—classic exhaustion fuel for a short.
- ATR (0.58) is tight, but TP2 at 102.01 offers a 1.6% drop before the daily range floor.
- Trend is *range*, not bull—mean reversion is the edge, not breakout chasing.
- Confidence 55 is low, but the invalidation at 102.34 keeps risk defined: 1.3% to stop vs 1
SOL+2.84%
Everyone’s watching ADA’s 15m RSI scream at 70—but the 4h chart is whispering a dirty secret nobody wants to hear.

$ADA /USDT - SHORT

Trade Plan:
Entry: 0.2177 – 0.2189
SL: 0.2237
TP1: 0.2142
TP2: 0.2115
TP3: 0.2075

Why this setup?
Why now?
- 1D trend is a **range**, not a breakout—mean reversion is the game.
- RSI 15m at 70.55 = overheated micro-spike, ripe for a snapback.
- ATR 1h (0.002252) tells us volatility is thin—traps are cheap to set.
- Entry ref 0.2183 with TP1 at 0.2142 (1.9% drop) is the low-hanging fruit, not the moon shot.

Debate:
Is this a fake pump to short int
ADA+3.93%
I did nothing—just went to the bathroom, and when I came back, the candlestick had already done the work for me. When the market dumped early, I glanced at the volume: the rebound was weak, overhead resistance was obvious, and every push upward fell just short. This isn’t what strength looks like; it’s fuel for the shorts.

$ZEC $SOL
post-image
ZEC+2.63%
SOL+2.84%
Crypto market cycle.
Do you agree with this?
post-image
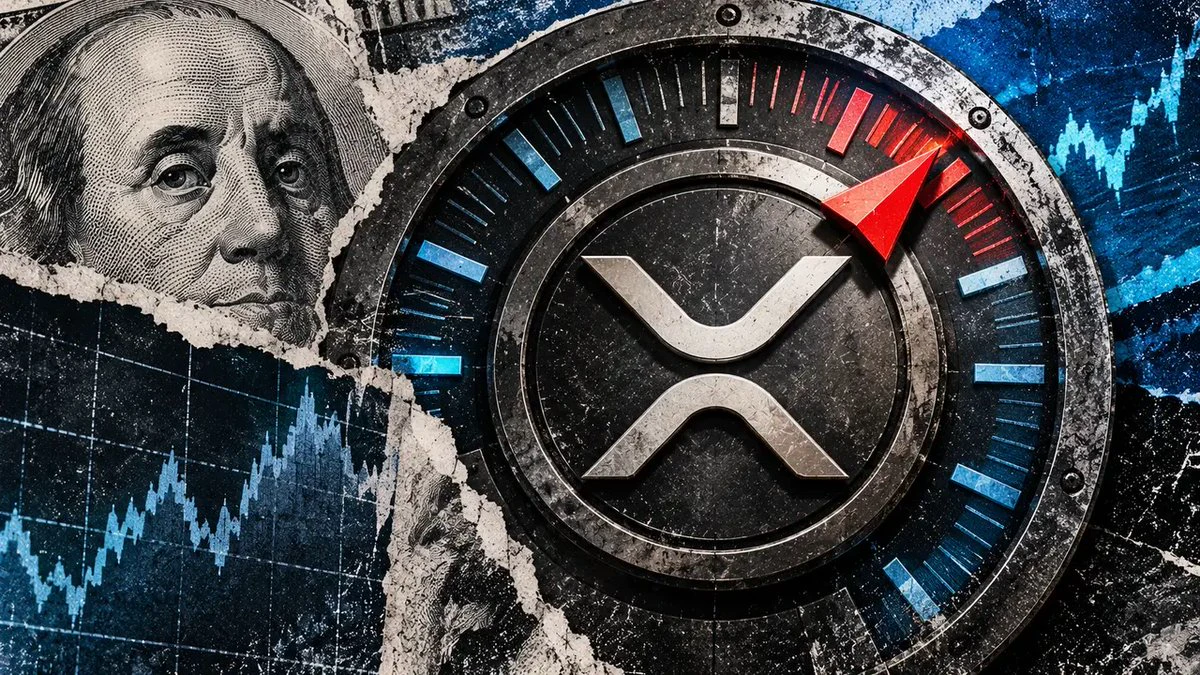
Everyone’s buying XRP at 1.42, but the 4h tape just whispered something else.

$XRP /USDT - SHORT

Trade Plan:
Entry: 1.4184 – 1.4228
SL: 1.4415
TP1: 1.4049
TP2: 1.3944
TP3: 1.3787

Why this setup?
- The 1D trend is *range*, not breakout—so chasing longs here is gambling on noise.
- RSI on 15m is hot at 64 while price stalls at 1.4206, a classic bull trap setup.
- ATR is tight (0.0087), meaning the next 4h candle decides direction—my model leans SHORT with TP1 at 1.4049 and TP2 at 1.3944.
- Why now? The stop at 1.4415 is far, but invalidation at 1.4049 is close—risk/reward favors the
XRP+2.09%
$DOGE Confucius and Malgo Coin are destined to become future Chinese star coins.
DOGE+6.90%
Will BTC pump?
live-cover
LIVE1,344
$SOL Solana is cooling down or preparing for another pump?
I'm holding tight on my Solana until ut break the 300.
always be patient with the strong fundamental project like: $sol $sui #hbar #qnt $link
SOL+2.87%
$BULLA Signal】Long | 1H MACD Momentum Restart
$BULLA RSI 1H 68.78, MACD histogram turns positive and expands, with price moving above 0.0739. The 4H Bollinger upper band is opening upward, order book bid depth has a slight edge, Bid/Ask 1.04. OI is flat, funding rate 0.08%, and short-term upward momentum is still expected.
🎯Direction: Long
⚡Entry/Orders: 0.07371220 - 0.07393400
🛑Stop-loss: 0.07023730
🚀Target 1: 0.07947905
🚀Target 2: 0.08225157
🛡️Trade Management:
- After reaching Target 1, reduce the position by 50% and move the stop-loss up to breakeven. If the price falls back to the e
post-image
BULLA+202.01%
BTC+0.83%
ETH+1.43%
SOL+2.87%
#NFPNightSetsTheDirection NFP SHOCKED THE MARKET
August’s U.S. Nonfarm Payrolls delivered a much stronger signal than markets expected. The economy added 162,000 jobs, while consensus was around 56,000. Unemployment stayed at 4.1%, and the labor-force participation rate increased to 61.6%. The scale of the upside surprise was important because markets had been positioned for a much weaker labor market.
WHY NFP IS A POLICY BAROMETER
NFP matters because employment is one of the key variables behind Federal Reserve policy. A stronger labor market means households have income, consumption can rema
post-image
NFP-2.96%
BTC+0.83%
MARKET UPDATE BTC
live-cover
LIVE1,142
Everyone’s watching HYPE’s 4h breakout—but the 95% confidence score is the real tell.

$HYPE /USDT - LONG

Trade Plan:
Entry: 85.415 – 85.715
SL: 84.129
TP1: 86.642
TP2: 87.360
TP3: 88.437

Why this setup?
Why now?
- 1D trend is bullish, and the 4h structure is *Armed* with a tight ATR (0.598) = low noise, high conviction.
- RSI 15m at 59.95 shows momentum building, not overheated—room to run to TP1 (86.642) and TP2 (87.360).
- Entry zone (85.415–85.715) is a springboard; invalidation sits far below at 82.117, giving you a 3:1+ risk/reward on the long side.

Debate:
Are you front-run
HYPE+0.59%
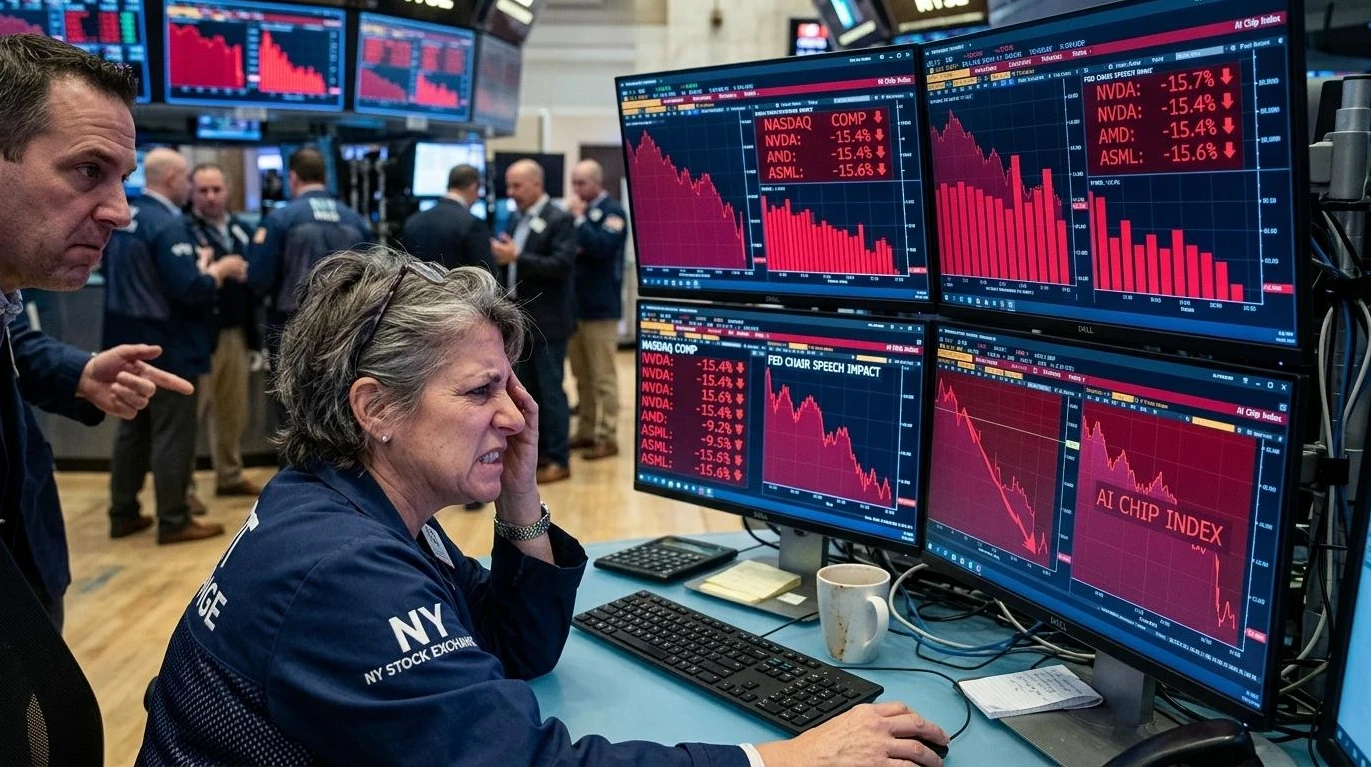
Warsh === bond volatility
$NQ doesn’t ignore high long-term yields—it can adapt to them if it’s stable and it has the strong earnings to survive this high yield environment.
But it would move violently in short term due to any high bond volatility.
Watch out for this FOMC.
post-image
BTC looks much calmer after yesterday’s sell-off than one might have expected.
Since the price entered the 77–82 thousand range, there is one detail I would not ignore: spot volume continues to outpace futures volume.
And this matters.
As long as the market is selling through futures while real spot buying remains stronger, the pressure looks more like a shakeout than a change in direction.
Yesterday’s NFP gave sellers a reason to hit the market. But so far, they have been unable to change the demand structure itself.
To me, this argues in favor of the move continuing upward.$BTC
post-image
BTC+0.83%
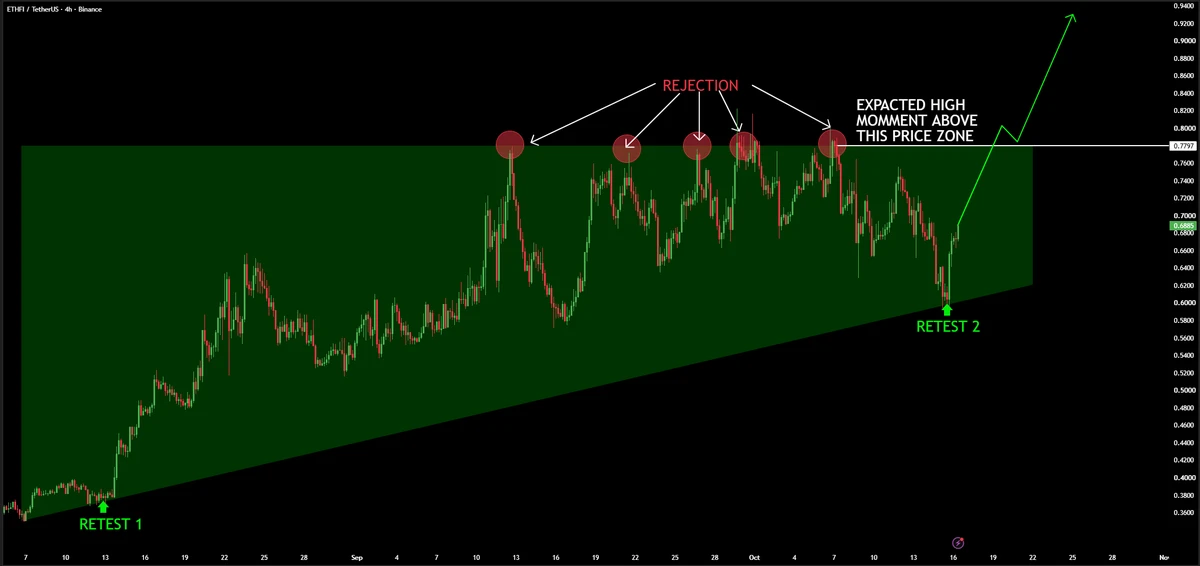
$DOT #DOT
Broken Falling Wedge.
Preparing for a solid rise during coming sessions✍️
DOT+6.85%
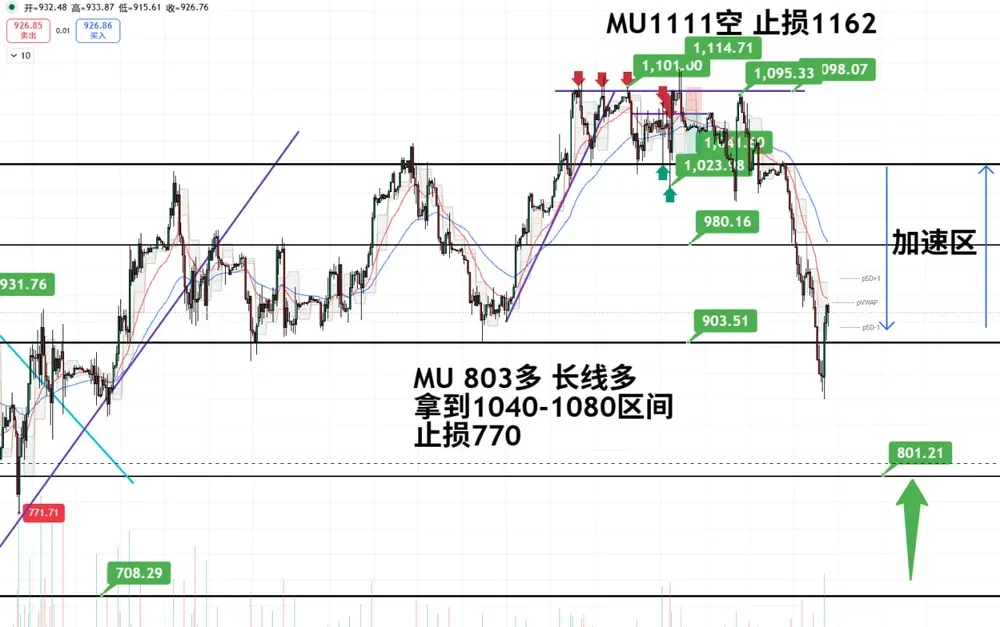
Everyone’s chasing the 1D range—but the 4h clock on $MU /USDT is ticking toward a trapdoor.

$MU /USDT - SHORT

Trade Plan:
Entry: 1014.86 – 1017.08
SL: 1029.83
TP1: 1005.57
TP2: 998.64
TP3: 988.24

Why this setup?
Why now?
- RSI 15m at 55.7 is cooling, not reversing—momentum is bleeding into the 4h short bias (77.4 confidence).
- ATR 1h at 4.44 shows tight coils; the 1015.97 ref is a pivot. A break below 1014.86 opens TP1 at 1005.57, then TP2 at 998.64.
- 1D range means no rescue rally—just chop that favors sellers on the 4h.
- Your entry is waiting, not filled. That’s the edge.

post-image
MU+1.67%
$ETH
Supertrend flips 🟢 GREEN!
Bullish for
post-image
ETH+1.43%
  • 4
JUST IN: Anthropic's Claude produced the first computer-checked formalization of Fermat's Last Theorem in Lean, closing a problem that stood for 350 years.
  • 2
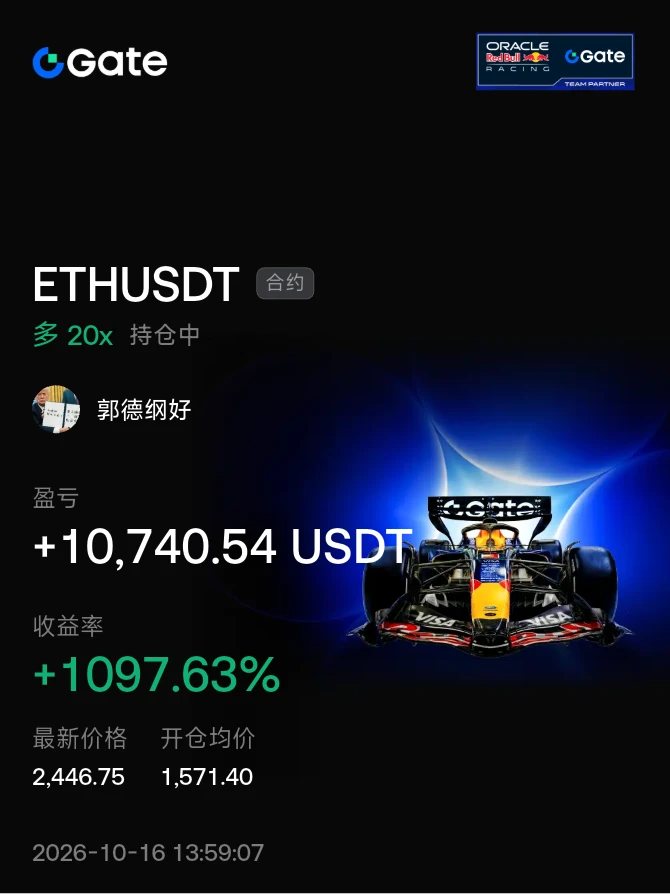
I originally just planned to test the waters with a small position, but it nearly fell short? No, it delivered a big move instead! During the repeated intraday swings, I watched the order book for a long while. Every dip held its level, while the volume-price action grew healthier and healthier. My instincts told me this move had potential. I went with the pullback during the day and entered at 0.08454. When I opened the app again after lunch, it had already reached 0.08915, pushing the return to +507.25%. My account was dancing on its own—I was worried it might fall.

Profits, plain and clea
post-image
ZEC+2.63%
SOL+2.84%
The line is still respected $RIVN
@hellojintao may have lost faith, but the trend is still intact
post-image
RIVN-1.09%
Load More

Join 40 M users in our growing community

⚡️ Join 40 M users in the crypto craze discussion

💬 Engage with your favorite top creators

👍 See what interests you

View More