Square
Following
Hot
News
Profile
Share your thoughts
placeholder
Article
🔥 $OGN
After encountering resistance near the $0.0500 resistance zone, it has continued to show bearish momentum. The price has consistently formed lower highs and lower lows, gradually falling to the $0.0300 support area. If selling pressure persists and the support level breaks, OGN may retrace further to lower levels. 📉Take profit: 0.010556 Stop loss: 0.03747 Short $OGN 👇
post-image
OGN-2.90%
@RIL_Updates reply on @Starlink “Competition is welcome. Rules are the same for everyone.”
Jio’s own satellite services clearance is also still pending.
Starlink will also have to go through the same process.
Jio’s claim 530 million customers, in one decade.
Everything is only on the rule of law.
post-image
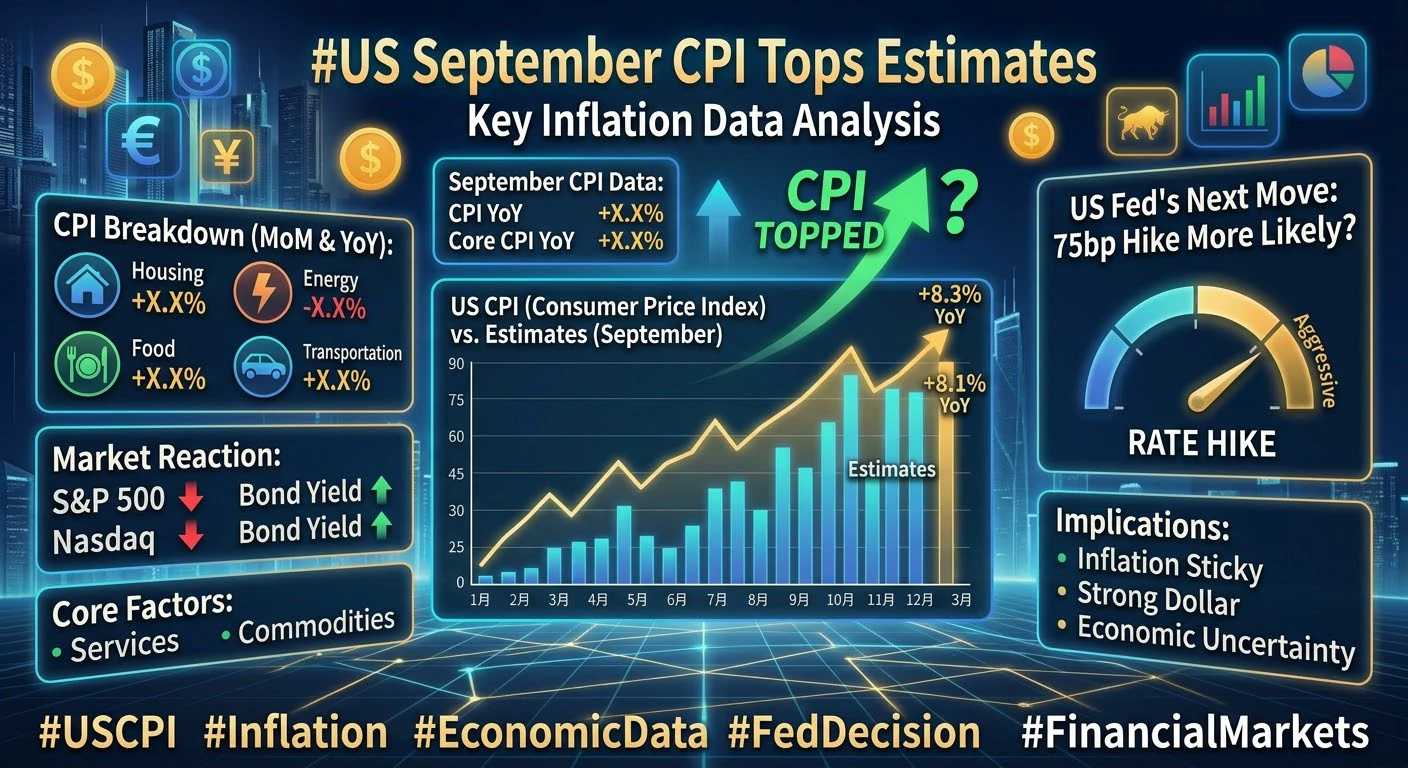
#USSeptemberCPITopsEstimates USSeptemberCPITopsEstimates
The US September CPI report just dropped, and it came in hotter than expected. This report effectively killed any remaining hopes that the Fed would pivot soon.
Headline Inflation: Energy Steals the Show
September CPI rose 3.7% year-over-year, above the expected 3.6% and up from 3.4% in August. Month-over-month, prices climbed 0.6% — the largest single-month jump in five months.
Gasoline was the biggest culprit. The gasoline index surged 9.1% month-over-month, accounting for more than half of the overall CPI increase on its own. The broa
post-image
GAS+2.43%
CME+1.39%
US500+0.22%
NAS100+0.38%
CICC-0.76%
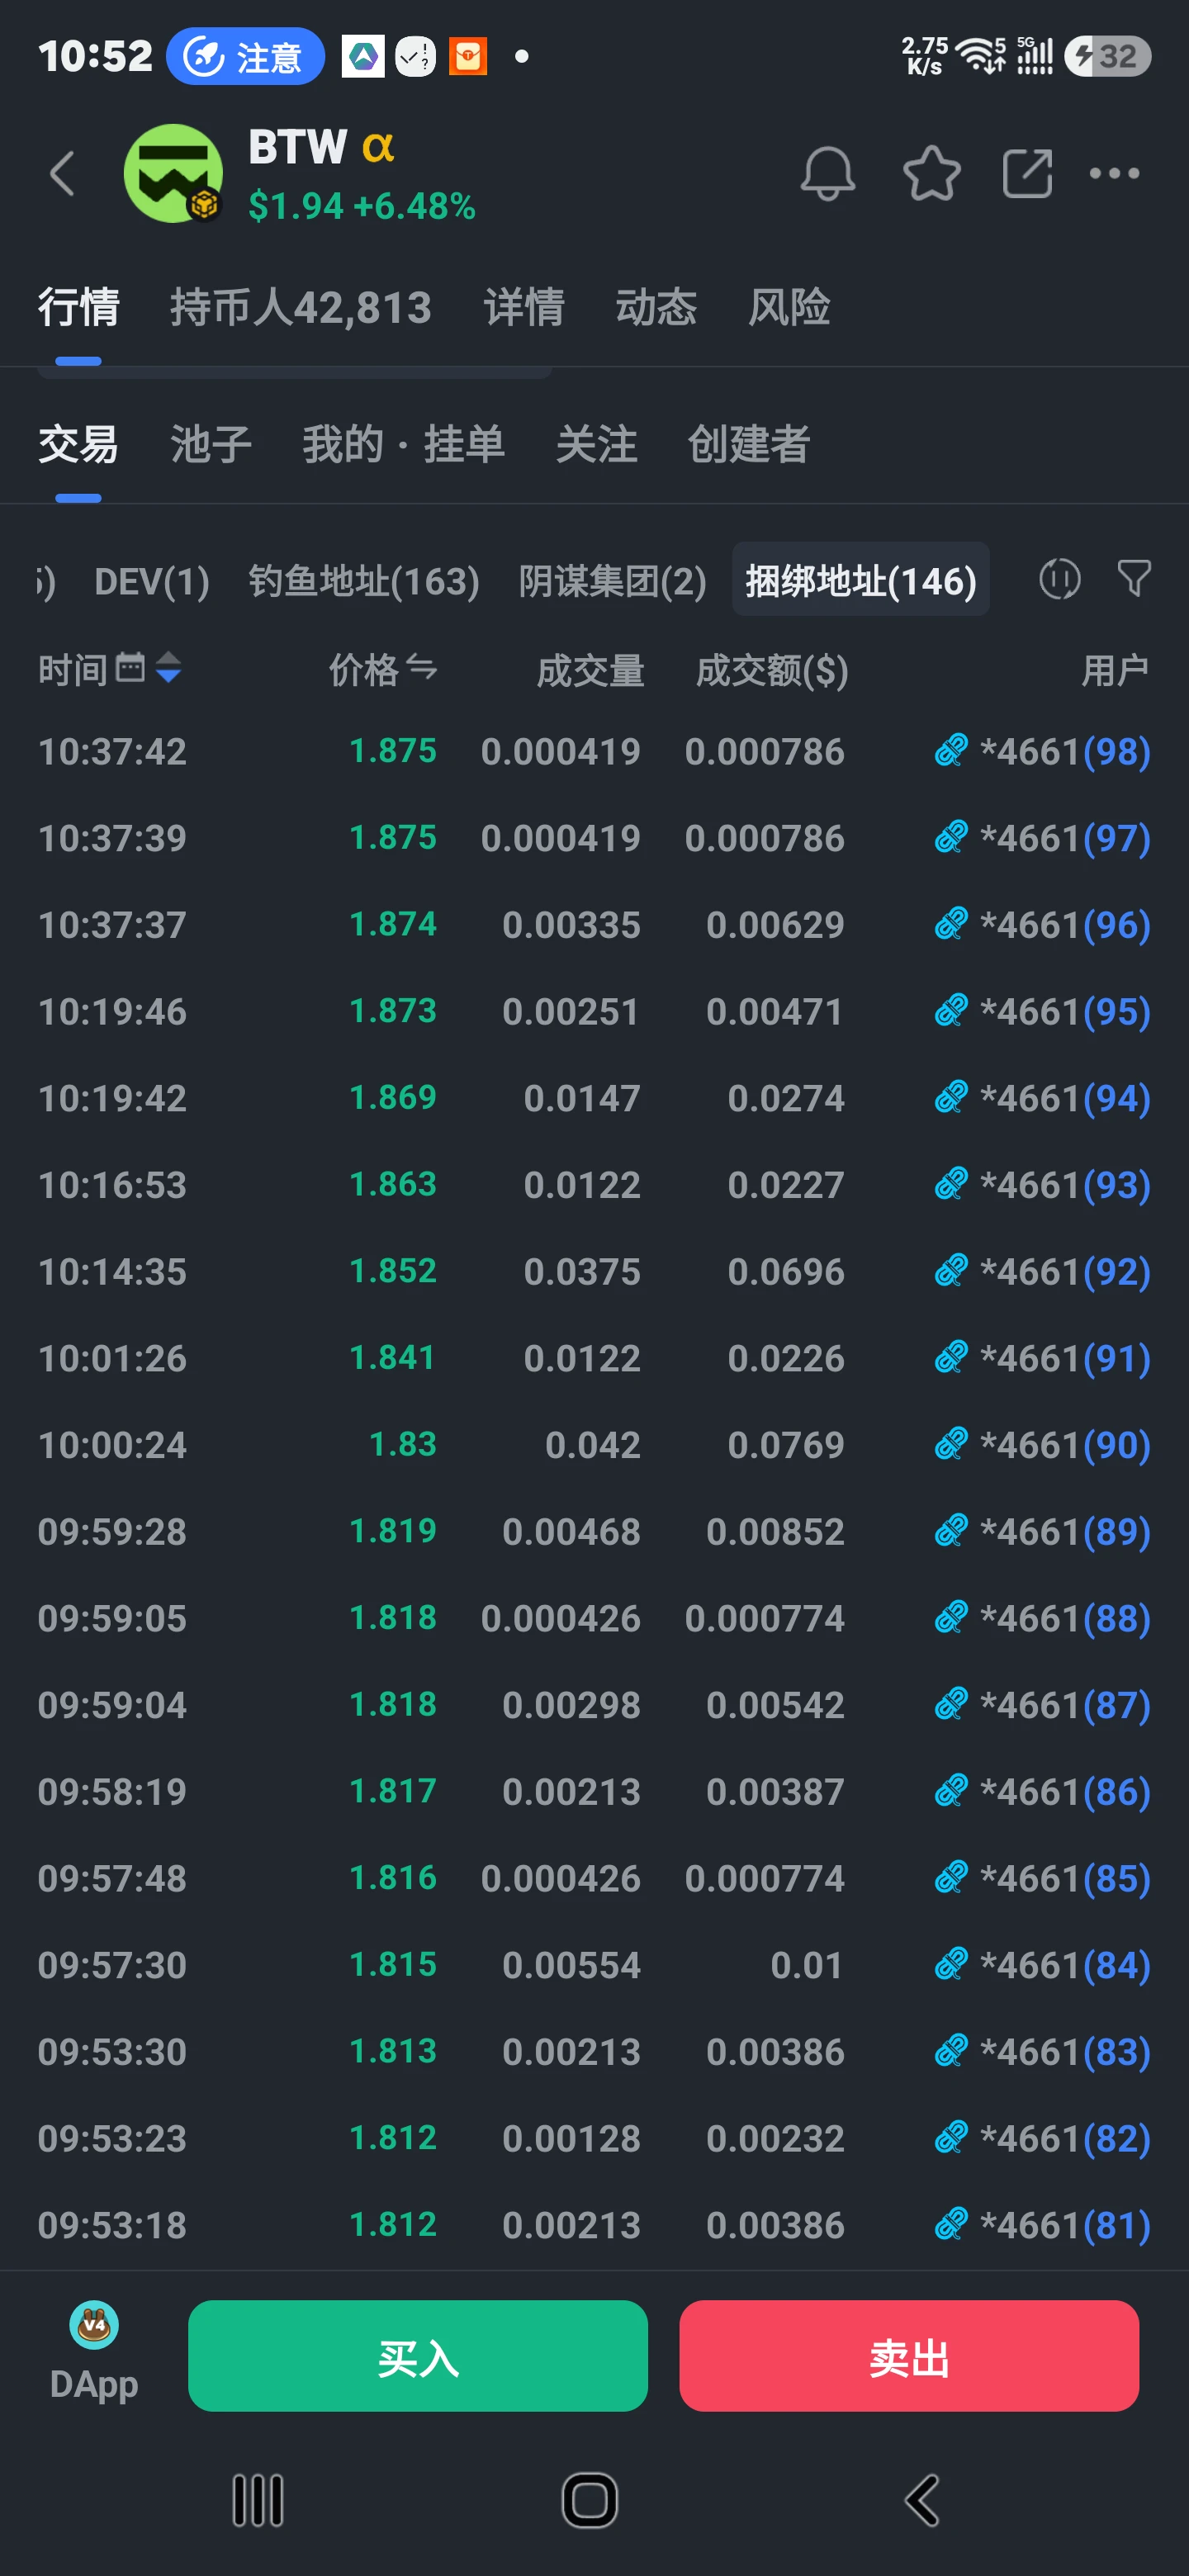
$BTW Do you understand?
post-image
BTW-13.30%
  • 1
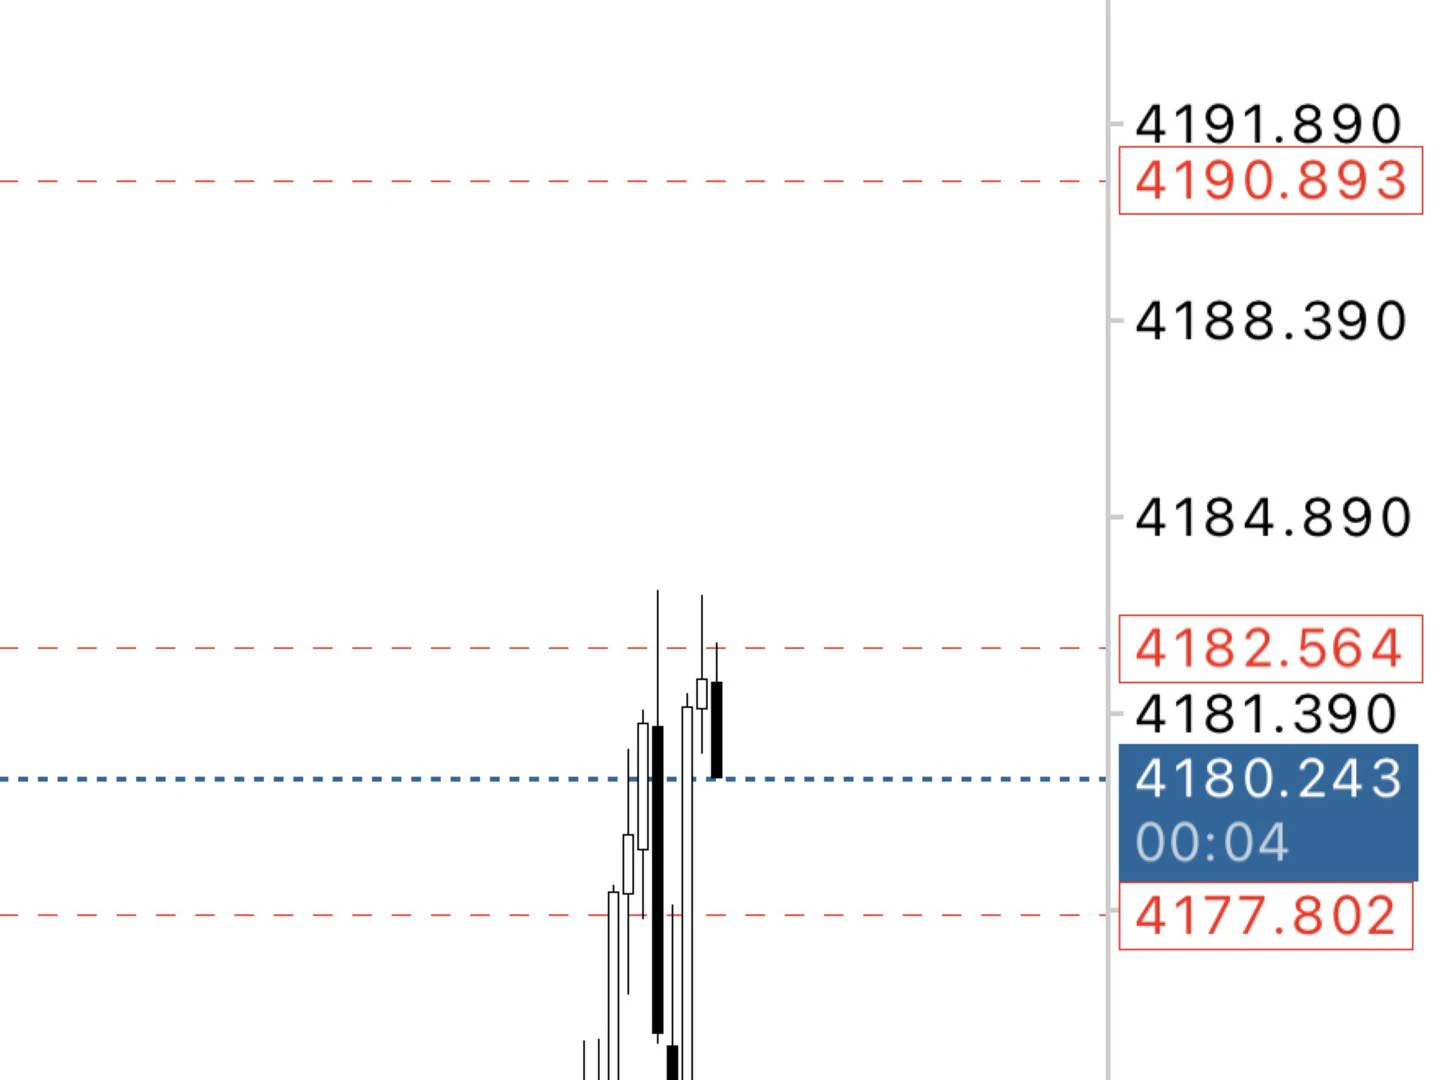
I placed a short order at 4190 and added one more. Are your short positions around 4182 and 4190?$XAUUSD ‌
post-image
XAUUSD+0.06%
  • 2
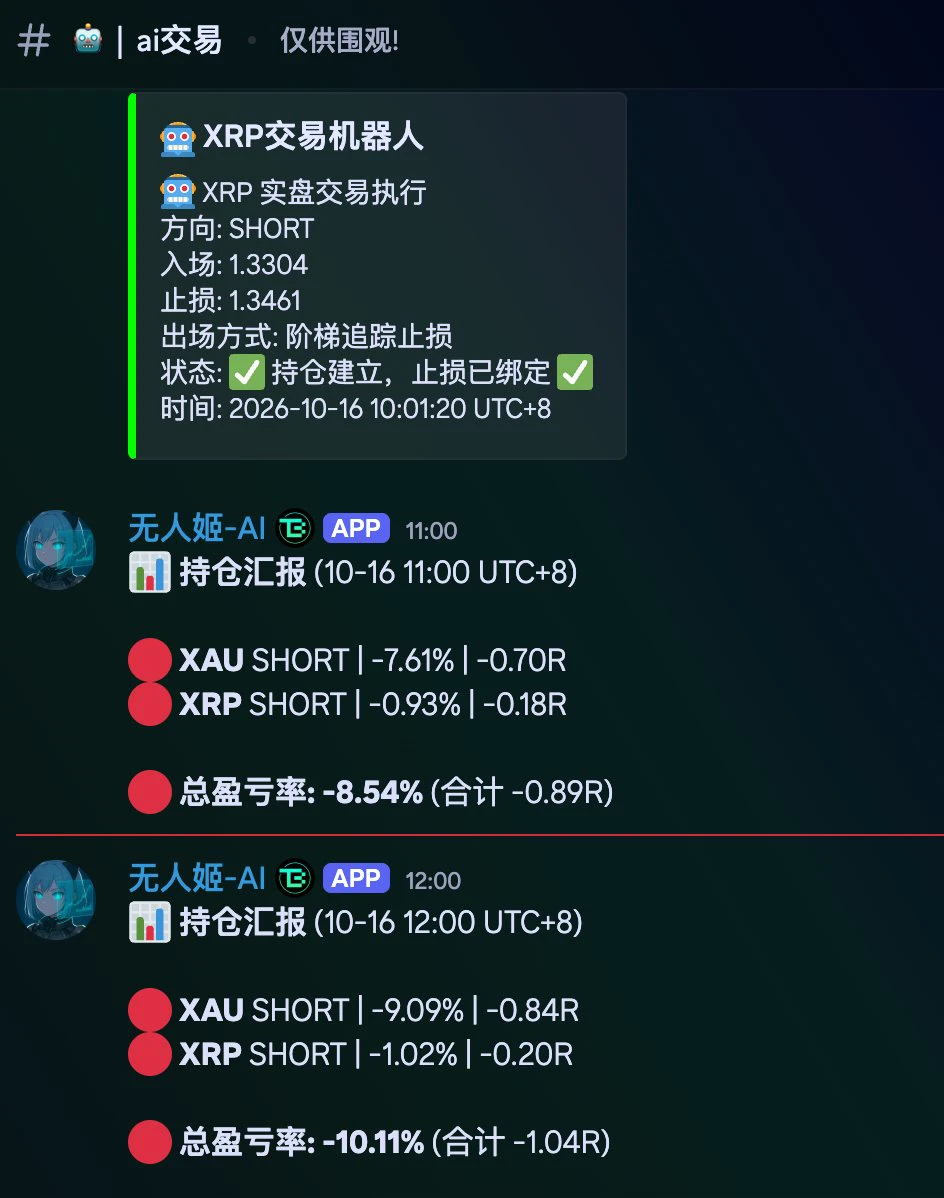
Yesterday I shorted three trades and lost on all of them
Still shorting today
🤡
I feel it's moving pretty well
This week's test
Next week, the major bull market begins
post-image
What Was Expected, What Happened?
Everyone expected this: Producer prices would increase by 0.5% - 0.6% monthly, reaching 5.3% annually. In other words, we would say that inflation was gradually coming under control.
The data that came in was a shock:
A 1.3% monthly increase. Almost three times the expectation. The biggest jump since 2022.
A 6.3% annual increase. The expectation was 5.3%. It was 5.6% in August, so there's an increase, not a decrease.
Even core data, which is the data excluding food and energy, increased by 0.5% monthly. So inflation isn't just due to oil; it's spread everywher
NG-1.50%
BTC+0.72%
ETH+2.57%
ASML+0.52%
TSM-1.82%
  • 13
  • 2
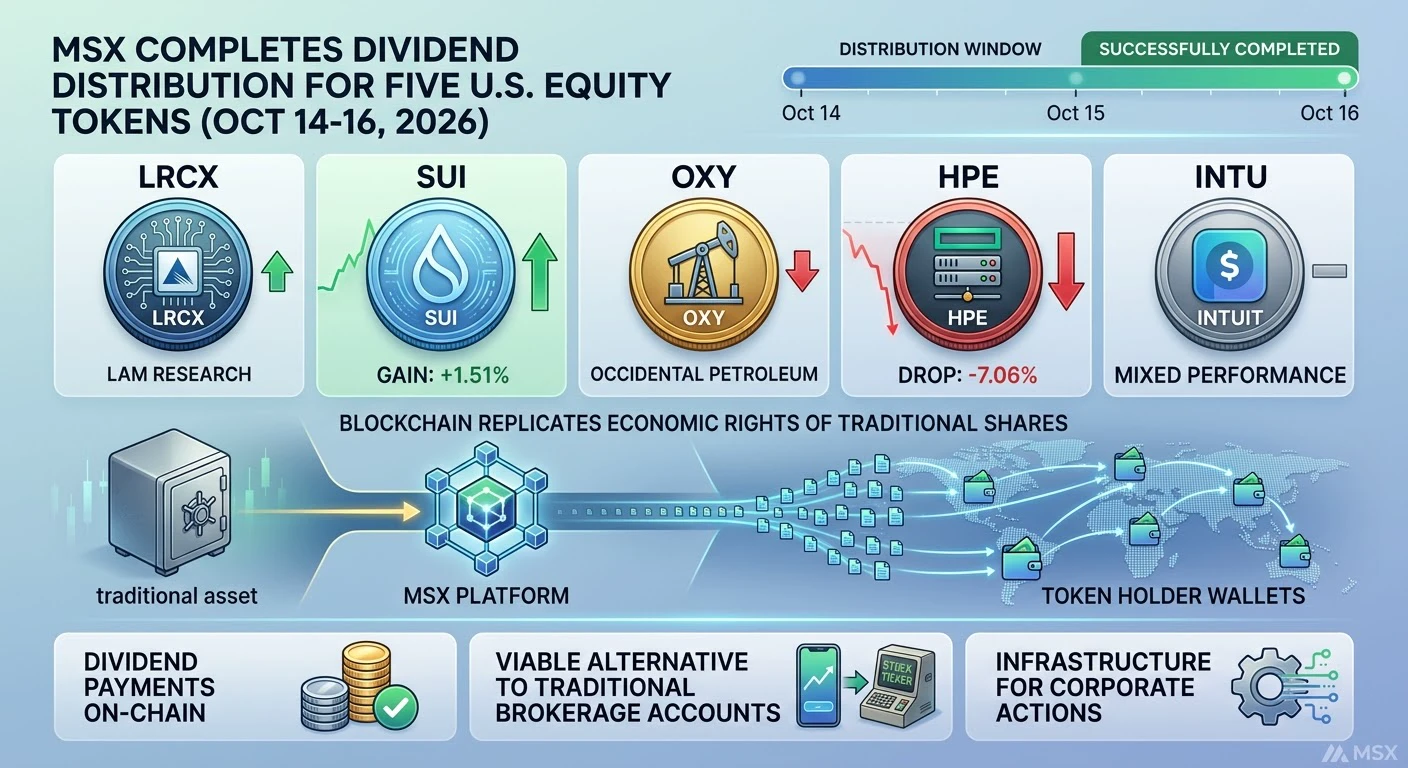
MSX Completes Dividend Distribution for Five U.S. Equity Tokens, Including LRCX and SUI, on October 14-16
MSX has completed the dividend distribution for five U.S. equity tokens, including LRCX and SUI, between October 14 and 16, 2026, according to an announcement from the platform. The distribution of dividends for tokenized equities represents a significant development in the tokenization of traditional financial assets, as it demonstrates that blockchain-based tokens can replicate the economic rights of traditional shares, including dividend payments. SUI gained 1.51%, while OXY fell 0.61%,
post-image
LRCX-3.21%
SUI+2.88%
OXY-0.61%
HPE-7.06%
INTU-0.05%
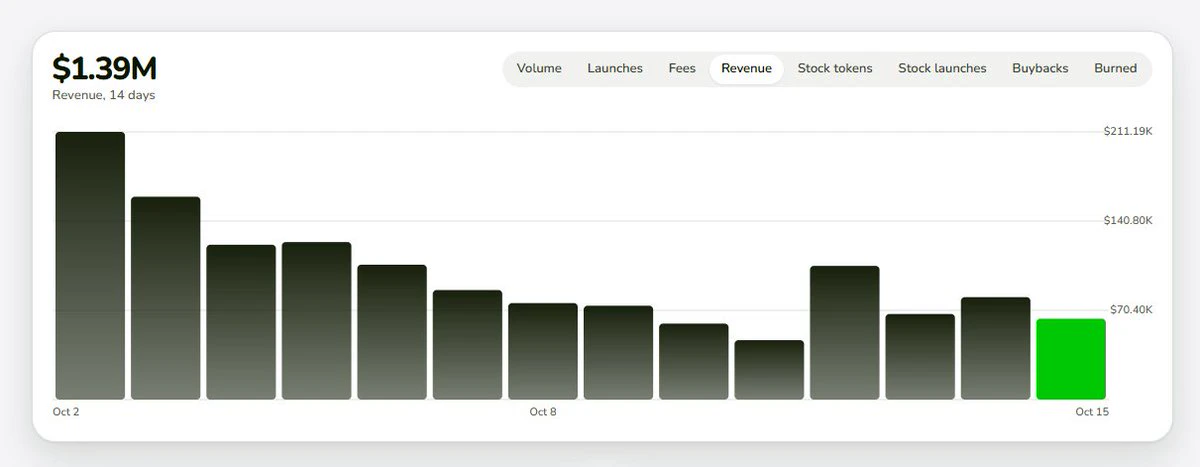
$PONS Revenue over the past three days has been around 7WU, basically bottoming out and rebounding. It can’t go any lower; if it drops to 2–3WU, that wouldn’t be a retreating tide—it would mean no one is fucking playing anymore.
post-image
PONS+12.86%
$UB Selling pressure is fading; seize the chance to catch the rebound, guys🤩
LONG NOW🔥🔥Tp1: 0.135Tp2: 0.16Tp3: 0.2Sl: 0.102$AG $SIREN
CPIWatch
post-image
SIREN+27.69%
$ETH This now feels like a multiple-choice question with no standard answer, but the answer won’t be found in emotions.
One verifiable update: Gate’s official announcement reads, “Gate Research: Corporate Earnings Support U.S. Stocks, KR1 Launches Ethereum Validator Nodes…”. It can explain why some people are paying attention, but it can’t tell us which way the price will go.
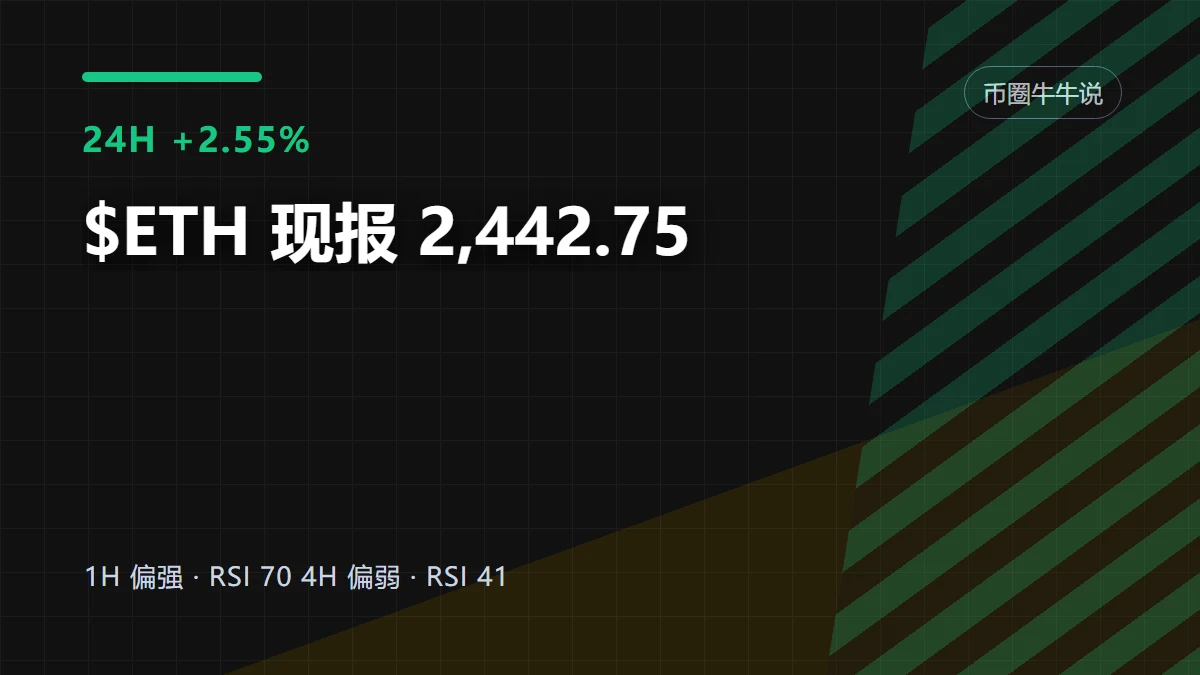
First, let’s lay out the full question: $ETH is currently at 2,442.75, up +2.55% over 24 hours. 1-hour support is 2,324.22, resistance is 2,467.05, and current volume is 0.31 times the average of the past 20 candles. The
post-image
ETH+2.57%
Bitcoin’s monthly line has fallen by less than 2% this month, but the loss in your account is probably much larger.
I checked: it surged to 87220 on October 2 and plunged to 79800 early yesterday morning—a swing of more than 7400 points in half a month. That small percentage drop came at the cost of liquidating leveraged positions.
Among the people I’ve been watching, Dongbimao looked at the monthly chart and said this drop could be ignored—the market is full of nervous birds. That wick on Ethereum reaching 2318 this morning meant the same thing.
The second half of his statement is the real po
post-image
BTC+0.72%
ETH+2.48%
Current price 153.15, 24h +3.03%, trading volume 41.2M USDT. The moving-average structure shows MA5=151.264 has crossed above and held above MA20=148.524, confirming a bullish short- to medium-term alignment; the MACD histogram at +0.8647 remains positive, with momentum not yet exhausted; RSI=63.2 is in the strong zone but has not reached the overbought threshold, leaving room to rise. The price is currently near the Bollinger upper band at 153.232, showing a strong pattern of tracking along the upper band. The 30-candle range is about 7.99%, indicating relatively moderate volatility. The Fea
SPCXB
SPCXBSpaceX
Four.meme
MC:$4.44KHolders:2
0%
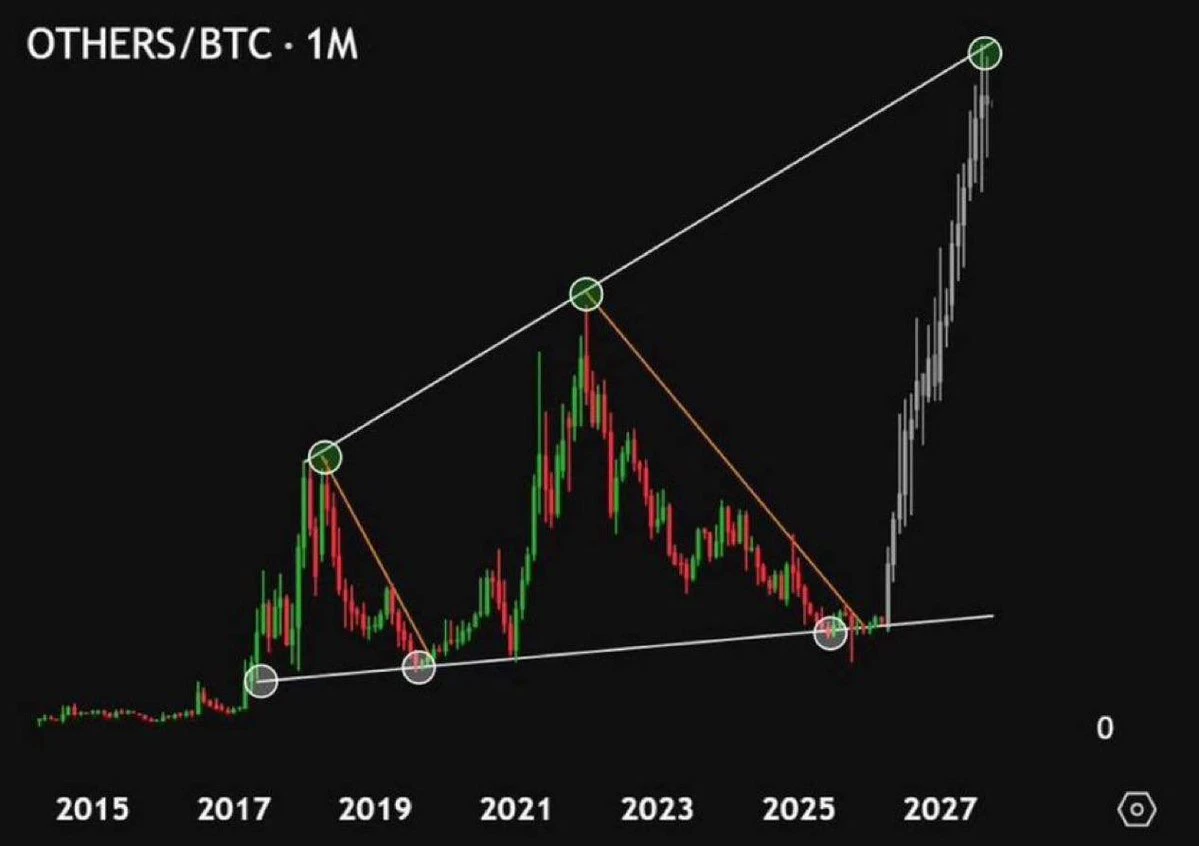
Alt coins will go parabolic like this
post-image
KOL take: Ansem remains firmly bullish on BTC! Crypto market confidence has fallen to a ten-year low
live-cover
LIVE2,442
#StrivePlans500MillionRaiseToBuyMoreBitcoin
Strive Plans a $500 Million Raise to Buy More Bitcoin — What Does This Mean for the Crypto Market?
The institutional Bitcoin story is getting more interesting. Strive's reported plan to raise up to $500 million to purchase additional Bitcoin has caught my attention because it highlights how some companies continue to explore Bitcoin as part of their corporate treasury strategy.
For me, the important question is not simply how much Bitcoin a company wants to buy. I also want to understand how it plans to raise the money, what risks shareholders coul
Hammer Bobi October 16, 2026 ETH Market Analysis
Market review: The previously mentioned 2330 and 2300 were successfully bottom-fished
Today's market analysis: A very long lower wick on the daily chart
The market is oscillating around the daily box range of 2325—2517 and 2548
Holding above 2440, 2460, and 2480 targets 2500 and 2540
Historical key levels 2380 and 2400 remain valid
Prioritize going long, with shorting as a supplement; sell high and buy low within the range—do not blindly hold out of conviction
Watch the market if 2400 and 2410 br
ETH+2.57%
Eth market update
live-cover
LIVE1,899
$PI Updates have been pretty frequent these past couple of days—four times a week. Looks like the early birds should stock up fast; a big surge is coming soon. Buy now or it'll be too late. I'm putting this on record, haha.
post-image
PI+3.05%
Load More

Join 40 M users in our growing community

⚡️ Join 40 M users in the crypto craze discussion

💬 Engage with your favorite top creators

👍 See what interests you

Trending Topics

USSeptemberPPIBeatsExpectations

91.35k Views1.9k Discussing

US September PPI came in at 6.3% YoY, well above the 5.3% market expectation, pointing to renewed producer-side inflation pressure. Weekly jobless claims were 199K, broadly in line with forecasts. Could hotter inflation further reduce room for rate cuts, and what does it mean for $BTC, US stocks, and gold?

GateWCTCS9GlobalTradingCompetition

37.87k Views6.42k Discussing

WarshIMFSpeech

62.4k Views755 Discussing

View More