Square
Following
Hot
News
Notifications
Profile
Share your thoughts
placeholder
Article
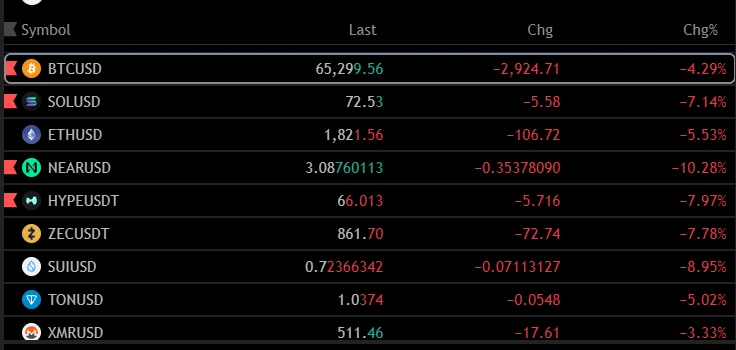
BREAKING: B $BTC drops to $65,400, down 4.77% in the last 24 hours.
$BTC is now trading nearly 48% below its all-time high set in October last year.

Bitcoin's market value continues to shrink as selling pressure builds.

Meanwhile, $40.8 BILLION is still tied up in open perpetual futures positions.

24-hour trading volume has reached $1.53 BILLION.

The market is under pressure, and Bitcoin bulls have a lot of ground to recover.
#GateIPOAccessAnthropic #Dr.HanOxfordUnionSpeech #ShareWeekly
post-image
BTC-0.67%
  • 1
BTC MARKET UPDATES
live-cover
LIVE1,292
Trenches
mihao
m
bade
b
mihao
4Cxj...pump
Market Cap
$.
Change
.
24h Vol
$.
Holders
.
Snoopy
S
bade
b
Snoopy
7mEh...47Cn
Market Cap
$.
Change
.
24h Vol
$.
Holders
.
IDOL
I
bade
b
IDOL
0x3b...ab07
Market Cap
$.
Change
.
24h Vol
$.
Holders
.
NIO
N
bade
b
NIO
7SL2...pump
Market Cap
$.
Change
.
24h Vol
$.
Holders
.
FOOD
F
bade
b
FOOD
FTu5...pump
Market Cap
$.
Change
.
24h Vol
$.
Holders
.
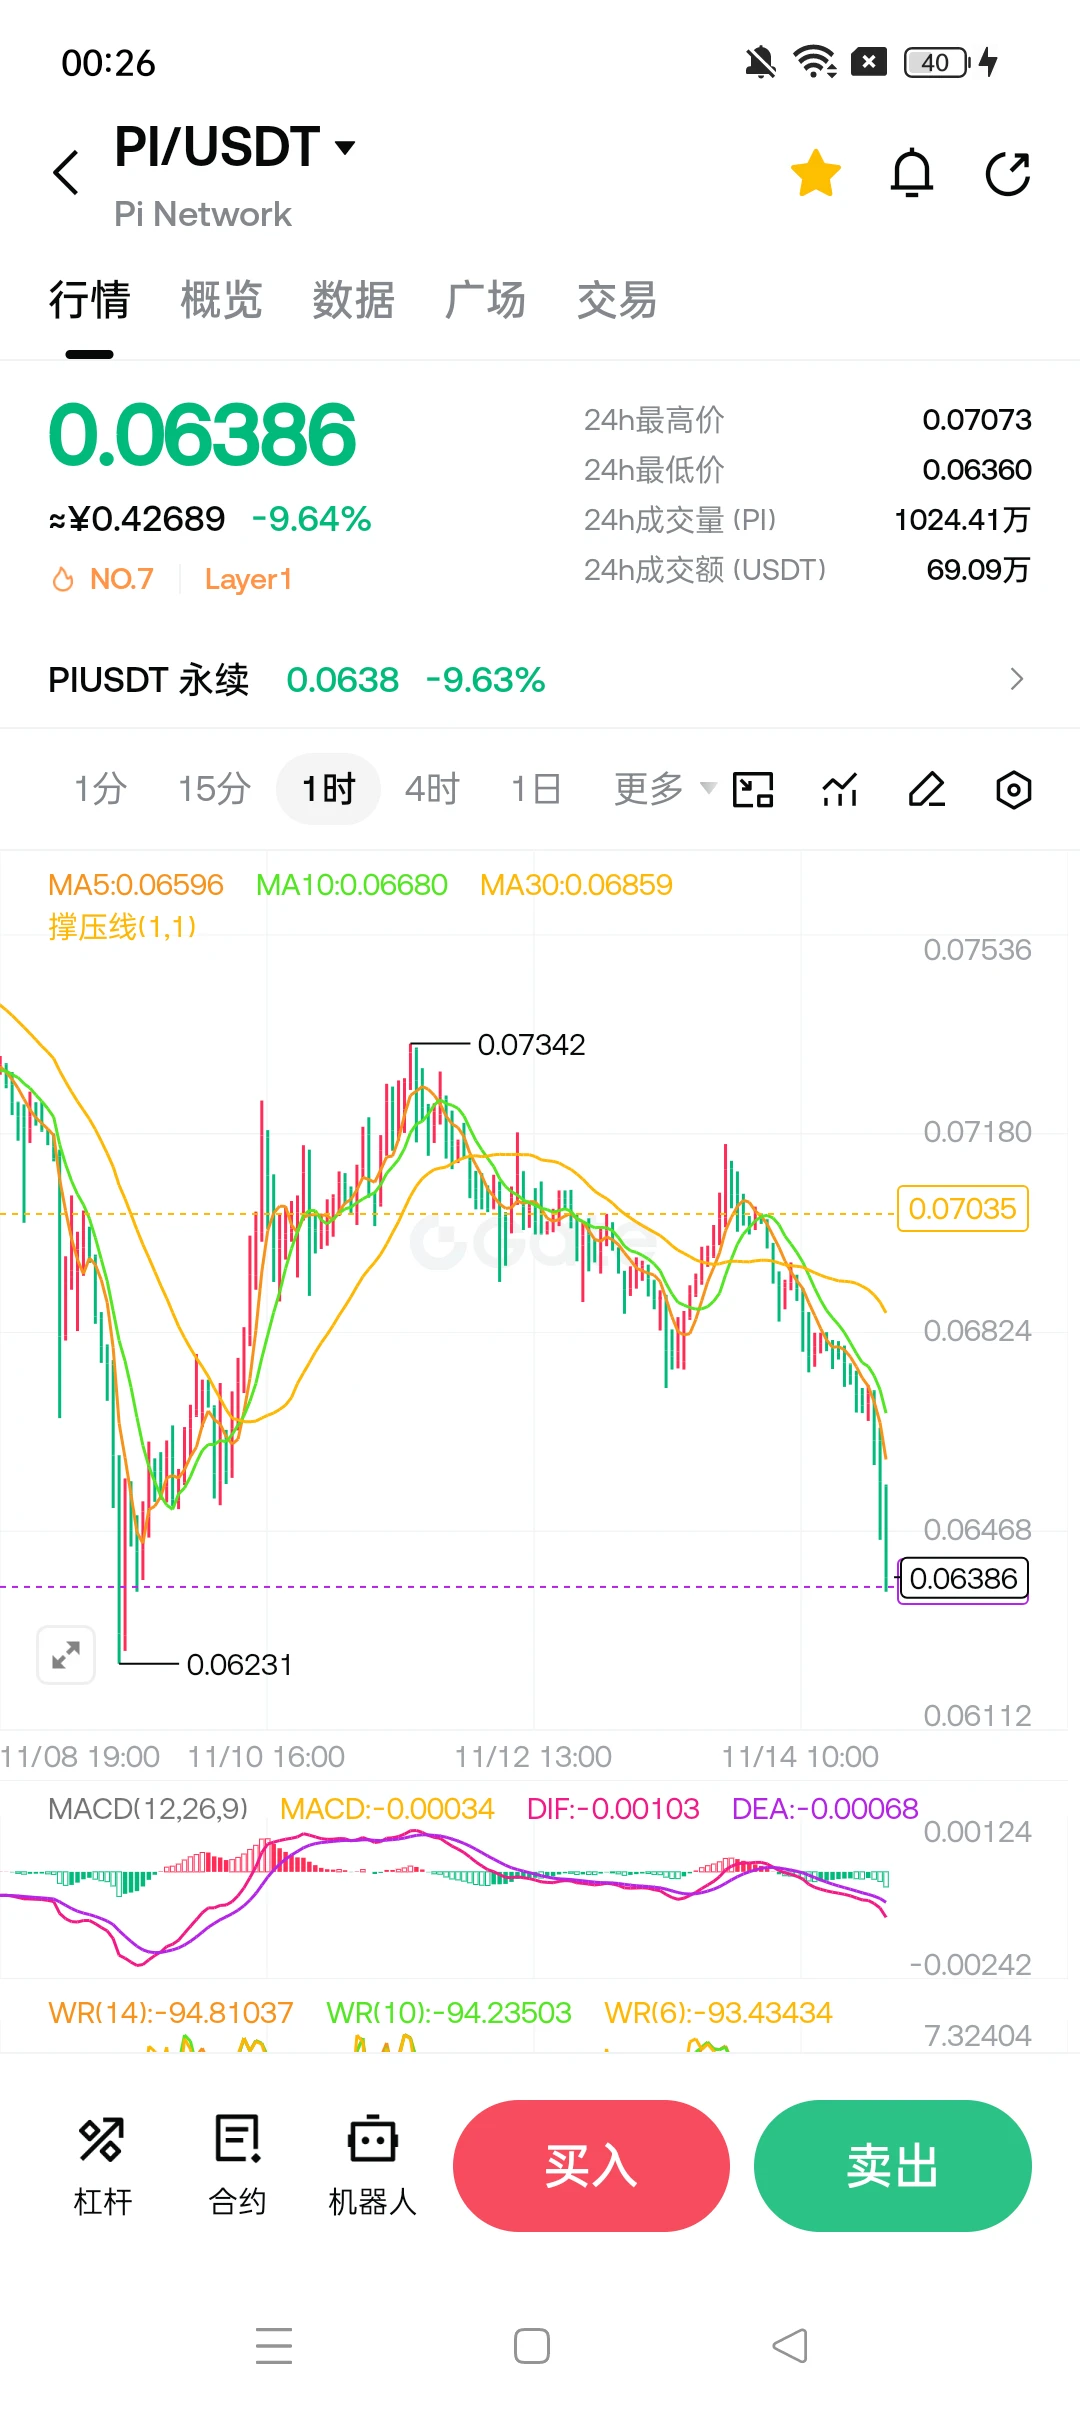
#pi
We’re not going to wake up tomorrow and find it’s broken below 0.06, are we?
This isn’t how the script is supposed to go. Based on the pattern so far, it should stabilize for a while before hitting a new low. Not much has been released recently, and with this trend, Lao Si won’t even give node builders mapping at 0.05!! Face it: don’t expect large-scale mapping before January 1, 2027.
post-image
PI-0.60%
  • 2
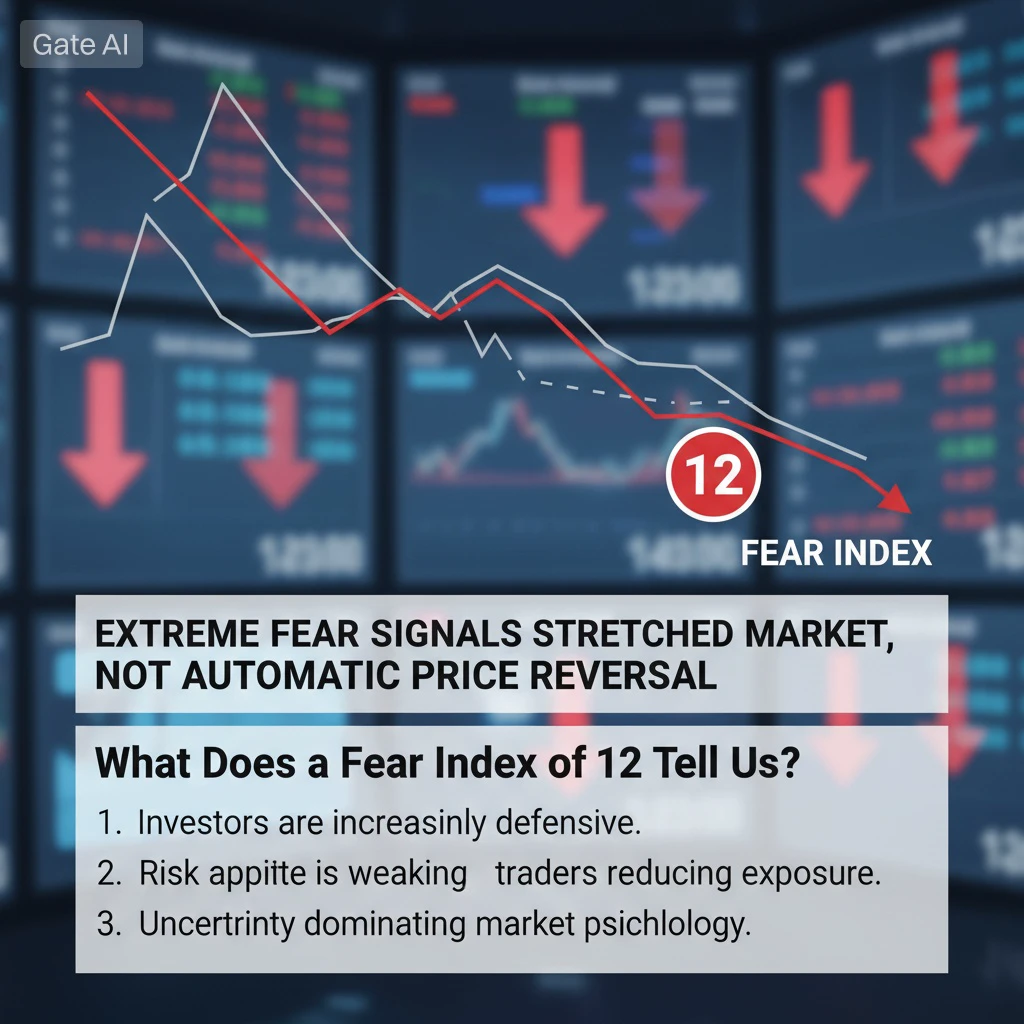
Bitcoin Fear Index Falls to 12: Extreme Fear Doesn't Mean an Immediate Bottom

Bitcoin sentiment has entered another deeply pessimistic phase, with the Crypto Fear & Greed Index falling to 12, placing the market firmly in extreme fear territory. This reading is already approaching the levels observed during February, April, and July 2026.

However, one important distinction needs to be understood: extreme fear signals stretched market sentiment, not an automatic price reversal.

1. What Does a Fear Index of 12 Tell Us?

A reading of 12 suggests that investors are increasingly defensive. Risk a
post-image
BTC-0.67%
This damn market is just unbearable to watch👀I got into crypto to make big money, enough to last me a lifetime, but now I’m starting to wonder if I chose the wrong industry😐Hao Ge
Fear and Greed at 13, the coldest in the market; I'm bullish on $PUMP with a volume ratio of 0.618
$PUMP is at 0.002993, down 13.572% over 24h. The Fear and Greed Index is 13, sentiment across the market is frozen—I'm bullish at this level.

First, volume—24h trading volume is 10535571 USDT, just 0.618 of the 30-day average. The price is drifting down on shrinking volume, and panic sellers haven't driven up volume.

Second, open interest—OI is 16,079,875,254.00, up just 0.33% from the 2026-11-13 snapshot. Shorts haven't dared to add to their positions.

Third, positioning—the long/short accou
PUMP-1.06%
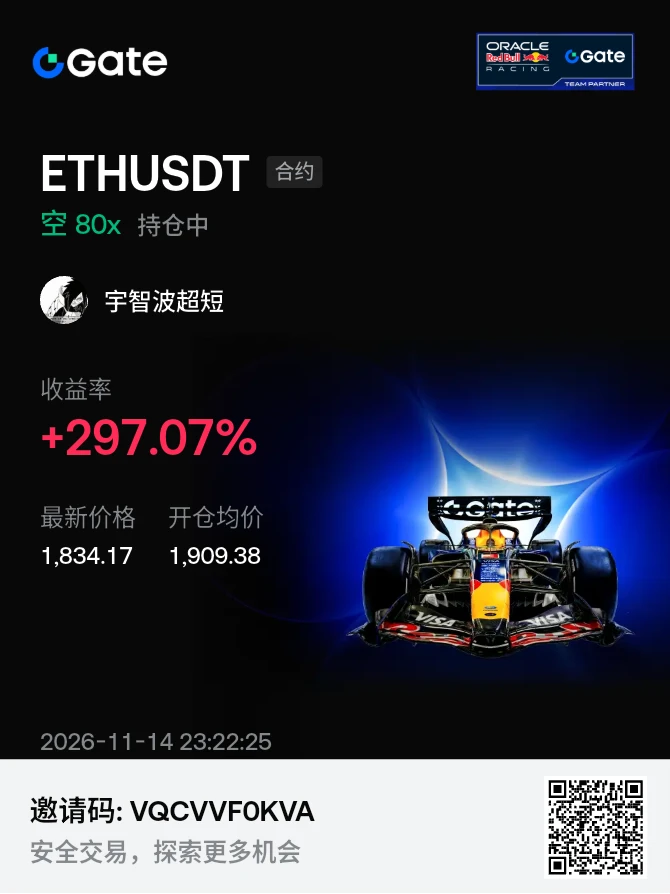
I'm tired. Ethereum, just die already!
post-image
ETH-1.26%
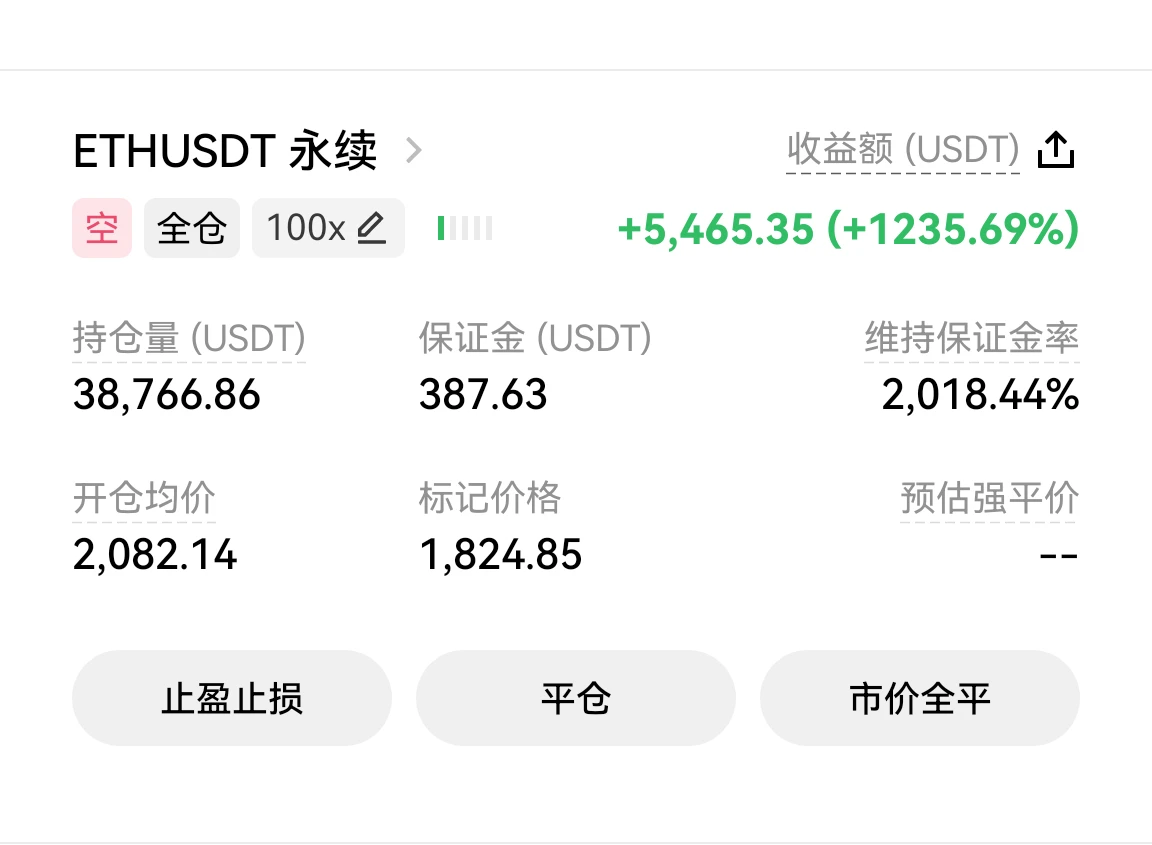
“One image shows you what ‘when the direction is right, even pigs can fly’ means. Today, I’m the pig riding the wind🐷. Don’t just envy me—hit follow, and next time I lose some meat, you’ll know right away!”
post-image
what is Jensen doing to the charts
post-image
$WLD Everyone, stop buying, or you'll end up like me, with no choice but to jump off a building; Sam is a huge scammer
WLD-5.61%
Market predictioon
live-cover
LIVE1,051
Ahead of the CPI release, the S&P rallied from 7,376 to 7,549 in two days, up 2.35%—about 173 points, or more than 1% per day. Risk appetite has rebounded faster than many expected. Before the market opened on Monday, I said clearly that if Friday’s closing price held, this rally would last until the CPI data came out. I’ll post my trades after the close to show how they played out. I call the trade first and post the receipts afterward—that’s how I keep score. No Monday-morning quarterbacking.

Looking at the market, this rally wasn’t a one-off spike. It was the result of sentiment, positioni
post-image
SPX+0.33%
BTC-0.67%
  • 2
Weekend thoughts: Are markets preparing for a bigger selloff?
$BTC
Could Bitcoin be signaling something bigger for the broader markets?
I've used Bitcoin as a way to gauge overall market sentiment time and time again, and this time may be no different.
I'm by no means a crypto expert, but when a major risk-on asset is selling off this aggressively, I think it's something worth paying attention to.
Then again, it's entirely possible the stock market has decoupled from crypto and this ends up being a complete nothing burger.
Either way, I wouldn't ignore what Bitcoin is telling us right now, esp
post-image
BTC-0.67%
this is insane
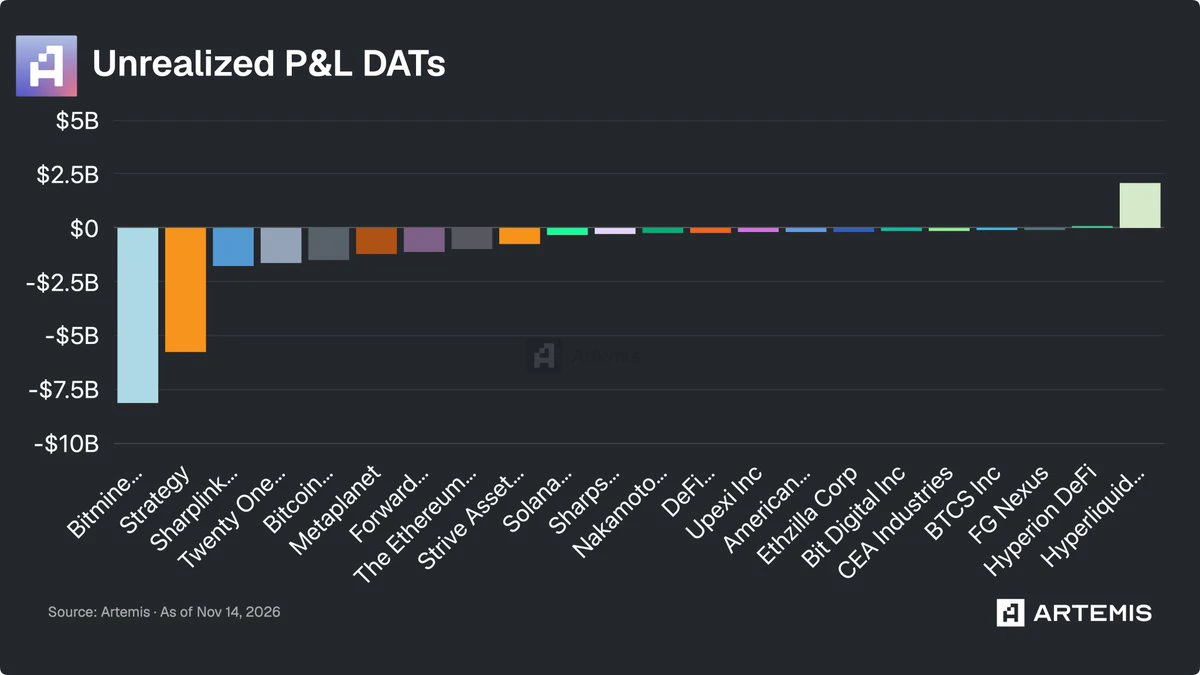
DAT's have lost $25 billion on their crypto treasury strategies
Tom Lee and Saylor have caused irreparable damage to crypto's image and investment appeal
post-image
Who knows how many short sellers ZEC has trapped before—once caught, they’re stuck for months. After finally getting out this time, they probably won’t dare—or, rather, won’t be willing—to short it so easily again. $ZEC
post-image
ZEC+1.16%
Fans who followed along today also made steady gains
post-image
  • 5
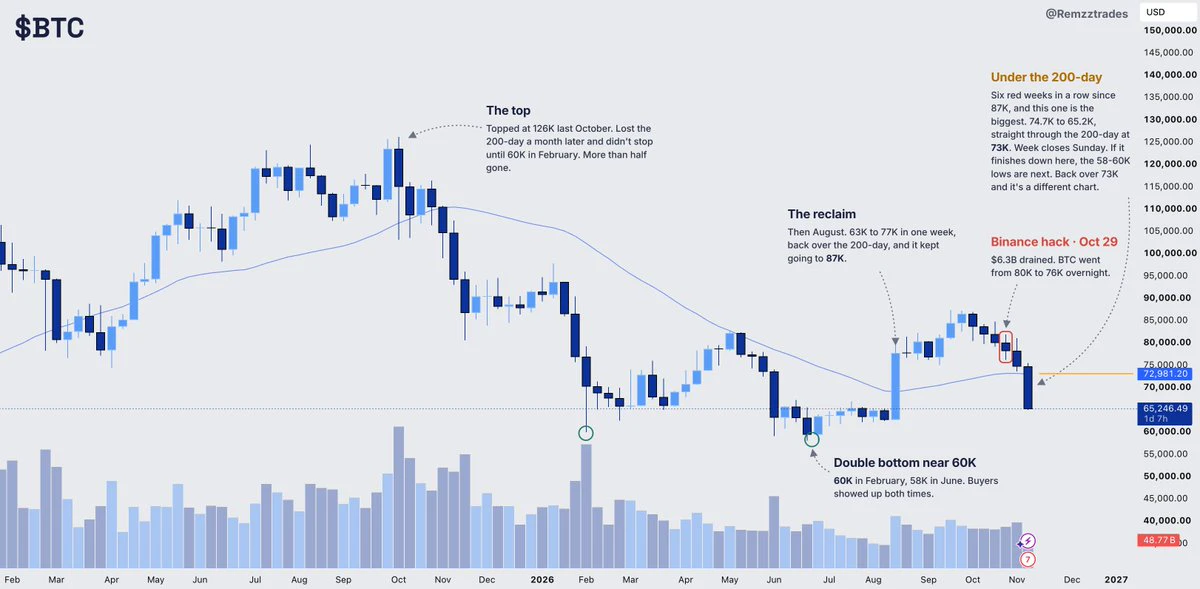
Bitcoin price loses $68K trendline: Can buyers defend $66K?

Bitcoin has fallen to around $67,200 on Nov. 14, losing more than 10% so far this week and slipping beneath its 200-week moving average as selling continues below $70,000.

TradingView’s $BTC /USDT charts show Bitcoin touching $66,456 before recovering toward $67,194 in the Nov. 14 snapshot. The daily candle was down 1.64%, while the weekly chart showed a 10.24% decline from an opening price near $74,851.

Bitcoin trades below its 200-week moving average

On the weekly chart, Bitcoin’s 200-week simple moving average stood at $67,992,
BTC-0.65%
You’re fixated on whether this trade can make a profit,
I’m positioning to capture the full trend of this cycle.
You obsess over every tick on the intraday chart,
I follow structural cycles and steadily reap the gains.
The gap in trading is essentially a gap in understanding.
Consistent precision is never a matter of extraordinary luck,
but of a deep command of market patterns.
Keep up with the rhythm, and you too can break out of the vicious cycle of chasing pumps and selling dips.
#ETH一度跌破2000美元
ETH-1.26%
Okay im done crying I found 2 creators to work with lololol
I hope this works!
post-image
The price is currently testing the 24-hour low of 0.003938, while a clear bullish divergence has appeared on the 15-minute chart, with RSI(6) rebounding to 40.42. Given that the 1-hour chart is extremely oversold, a mean reversion toward the MA7 near 0.004061 could offer a high-probability short-term trading opportunity. Go long on $1000SHIB$1000SHIB aggressively!🔥
Entry: 0.003915 - 0.003978Target 1: 0.004115Target 2: 0.004250Stop-loss: 0.003798Popular tokens:

$DODOX : Current price 0.032988 - 24-hour change: +15.84%
$ETH : Current price 1,845.42 - 24-hour change: -4.98%
post-image
DODOX
DODOXDODOX
Pump.Fun
MC:$2.36KHolders:87
33.75%
ETH-1.26%
Load More

Join 40 M users in our growing community

⚡️ Join 40 M users in the crypto craze discussion

💬 Engage with your favorite top creators

👍 See what interests you

Trending Topics

GateIPOAccessAnthropic

322.2K Views2.9K Discussing

Gate IPO Access Phase 3 features Anthropic (ANT), with USDT subscription interest starting from 100 USDT. Successful allocations will be delivered as real shares to Gate Stock Accounts. Indicative price: $70–$78/share Subscription: Nov 12–17 (UTC+8) Allocation is not guaranteed. Please manage risk accordingly.

Dr.HanOxfordUnionSpeech

148.5K Views643 Discussing

USOctoberPPIBelowExpectations

467.8K Views1.6K Discussing

View More