
Share your thoughts
placeholder
Article
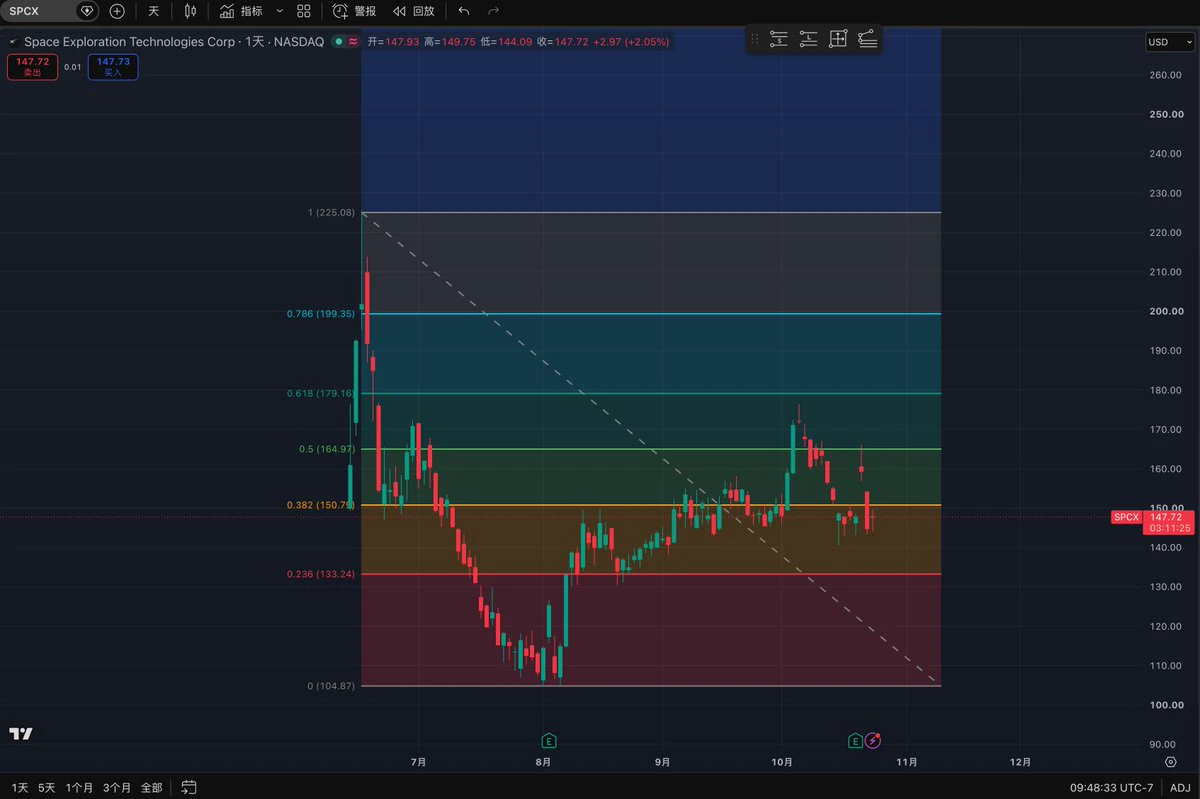
SpaceX successfully got me, a girl, interested in spacecraft, rockets, and stuff like that.😂
On the evening of September 6, SpaceX launched again: a 19th-use Falcon 9 lifted off from California, sending 27 Starlink satellites into orbit. Eight and a half minutes later, the first-stage booster landed safely on a drone ship in the Pacific.
Pay attention to the key phrase: 19th use.
This booster, named B1088, has flown 19 times, while SpaceX’s own reuse record is 37 flights.
Here are some numbers for you: So far in 2026, SpaceX has launched Falcon rockets 105 times, 80 of them Starlink missions;
post-image
SPCX-1.19%
  • 11
$XAUT /USDT is about to break range and most traders are not ready for it.

$XAUT /USDT - SHORT

Trade Plan:
Entry: 4392.2 – 4397.6
SL: 4420.5
TP1: 4375.7
TP2: 4362.8
TP3: 4343.6

Why this setup?
Why now? The 1h price is 4394.9, which sits right inside the entry zone of 4392.2 to 4397.6, giving us a precise SHORT reference. The daily trend is range, so this move targets the lower boundary of that range rather than a continuation. The 15m RSI is 48.57, showing just enough bearish lean to confirm momentum without being overextended. The 1h ATR is 10.686821, meaning the stop at 4444.2 is place
XAUT-0.50%
#PONSDropsOver15%
#PONSDropsOver15% PONS/USDT — SHARP CORRECTION AFTER PARABOLIC RALLY
PONS PRICE: ~$0.81
PONS has entered a major profit-taking phase after one of the most aggressive rallies seen across the altcoin market recently. The token reached an all-time high near $0.9710 on September 5, but the momentum has now reversed sharply, with current market data showing PONS around the $0.81 area and the token suffering a double-digit 24-hour decline.
This correction should be viewed in the context of the extraordinary move that came before it. PONS had gained roughly 192% in one week, while
post-image
Jiaa_Insights
#PONSDropsOver15% PONS/USDT — SHARP CORRECTION AFTER PARABOLIC RALLY
PONS PRICE: ~$0.81
PONS has entered a major profit-taking phase after one of the most aggressive rallies seen across the altcoin market recently. The token reached an all-time high near $0.9710 on September 5, but the momentum has now reversed sharply, with current market data showing PONS around the $0.81 area and the token suffering a double-digit 24-hour decline.
This correction should be viewed in the context of the extraordinary move that came before it. PONS had gained roughly 192% in one week, while its recent monthly performance had been close to 3,000%, making the current pullback a natural test of whether the market can build a sustainable base after such an explosive advance.
WHY IS PONS DROPPING?
The most obvious factor is profit-taking after an extreme rally.
When an asset rises vertically, early buyers eventually begin locking in profits. That selling pressure becomes even stronger when late buyers enter near an all-time high.
Recent market analysis also points toward elevated selling volume accompanying the decline, suggesting that the move is more than a small intraday fluctuation. PONS has also recently entered a much more leveraged trading environment, increasing the possibility of rapid moves in both directions.
The important point is that a 15%+ correction after a parabolic rally does not automatically mean the long-term trend has completely reversed.
It means the market is now testing its first real support structure.
TECHNICAL STRUCTURE
PONS is currently trading well below its recent $0.9710 all-time high, showing that the breakout momentum has weakened considerably.
The first level I would watch is the $0.75–$0.80 zone.
If buyers defend this region and volume begins shifting back toward the upside, PONS could enter a consolidation phase and attempt another recovery.
If this zone fails decisively, the correction could become deeper.
The next major downside area would be around $0.65, which has also been highlighted in recent market analysis as a potential level if the $0.75–$0.80 region breaks.
MOMENTUM — COOLING RAPIDLY
The most important change is momentum.
PONS previously displayed extremely aggressive upside momentum as the token moved from fractions of a cent to nearly $1 in a very short period. That type of vertical movement is rarely sustainable without periods of heavy retracement.
The current decline therefore represents a momentum reset.
If selling pressure continues, momentum indicators would likely remain weak. But if PONS establishes a higher low around the $0.75–$0.80 region, momentum could begin rebuilding.
The first confirmation I would want is price stabilization followed by increasing buying volume.
VOLUME — THE KEY CONFIRMATION
Volume is extremely important after a move like this.
A falling price accompanied by increasing selling volume indicates that sellers are actively distributing positions.
However, if volume starts declining while price stabilizes, it could mean that the strongest wave of profit-taking is coming to an end.
The ideal bullish setup would therefore be:
Price holds support + selling volume decreases + buying volume returns.
Without that combination, any bounce could simply become another opportunity for existing holders to sell.
PONS AND ROBINHOOD CHAIN
PONS remains closely connected with the rapid growth of activity on Robinhood Chain.
The Pons application has generated significant fee activity from its token-creation ecosystem, with reports showing nearly $6 million in fees over a 24-hour period during the recent activity surge. The platform also reportedly created tens of thousands of tokens in a single day.
This fundamental activity explains why market attention around PONS has increased so quickly.
But strong ecosystem activity does not eliminate market risk.
The token has already experienced an extraordinary repricing, so valuation, liquidity and leverage must now be considered alongside the underlying ecosystem growth.
KEY SUPPORT LEVELS
$0.80 — immediate psychological support
$0.75 — critical short-term support
$0.65 — deeper correction target
If PONS holds $0.75–$0.80, the current move could develop into consolidation rather than a full trend reversal.
A clean break below $0.75 would change the technical picture and increase the probability of a move toward $0.65.
KEY RESISTANCE LEVELS
$0.85 — first recovery resistance
$0.90 — psychological resistance
$0.97 — previous all-time high
$1.00 — major psychological breakout level
For the bulls, reclaiming $0.90 would be the first meaningful improvement.
A break above $0.97 would place PONS back into price discovery.
A sustained move above $1.00 would represent a major psychological breakout, but I would want strong volume confirmation before considering such a move reliable.
BULLISH SCENARIO
The bullish setup begins with PONS defending $0.75–$0.80.
If buyers absorb the current selling pressure and the token reclaims $0.85, the next targets would be:
$0.90 → $0.97 → $1.00
A break above the previous ATH around $0.9710 with strong volume could reopen the price-discovery phase.
However, after such a massive rally, I would expect volatility to remain extremely high even in the bullish scenario.
BEARISH SCENARIO
The bearish scenario becomes stronger if PONS loses $0.75 with heavy volume.
In that situation, the market could move toward $0.65, and if broader crypto sentiment also deteriorates, deeper levels could eventually become relevant.
The important point is that the current correction does not automatically justify expecting a collapse back to the much lower prices seen earlier in the year.
PONS has undergone a fundamental repricing alongside the expansion of the Robinhood Chain ecosystem, so the market must first break each major support level before a much deeper bearish target becomes technically valid.
MY PONS OUTLOOK
At approximately $0.81, my short-term view is:
BEARISH ON MOMENTUM — CAUTIOUS ON TREND
The immediate momentum is clearly negative after the 15%+ correction.
But the bigger trend cannot be judged from one red day alone because PONS has just experienced an extraordinary parabolic rally.
My main decision zone is $0.75–$0.80.
If this zone holds:
$0.85 → $0.90 → $0.97 → $1.00
become the recovery levels I would watch.
If $0.75 breaks with strong selling volume:
$0.65 becomes the next important downside zone.
FINAL TAKE
PONS is showing exactly why parabolic crypto rallies require disciplined risk management.
The token reached an all-time high around $0.9710, but the subsequent 15%+ decline shows that profit-taking can arrive extremely quickly after vertical moves.
For me, the most important question is no longer whether PONS can produce another massive candle.
The question is whether buyers can build a sustainable base after the correction.
PONS PRICE: ~$0.81
RECENT ATH: $0.9710
CRITICAL SUPPORT: $0.75–$0.80
DEEPER SUPPORT: $0.65
RECOVERY RESISTANCE: $0.85 → $0.90
BREAKOUT LEVEL: $0.97–$1.00
My view: PONS remains one of the highest-volatility tokens in the market. The current correction is a serious momentum warning, but a successful defense of $0.75–$0.80 could turn this pullback into a consolidation phase before another attempt higher. A decisive loss of $0.75 would make the bearish scenario much stronger.
PONS-11.20%
Benjidpc got the $zec and knows $10m is eazily a realiztic target for solana:9XqW82GbV8TSuFGLS5qZjpMmL8F2BZ2AaWyC68px37hc
Send it a lot higher!
post-image
ZEC-0.34%
SOL-1.47%
$SOL
120 in sight. Can we get that today!
SOL-1.47%
$ARB has exploded 92% since my update.
An absolutely massive move for those who caught it early.
Momentum turned into a serious rally, and the numbers speak for themselves.
92% up so far.
Enjoy the move.
post-image
ARB-11.84%
The all-time high anchored vWAP - acting as resistance once again.
Flip it, and the real fun begins.
bitcoin:native
post-image
BTC-0.57%
Why is everyone suddenly calling for a range when the 1h price just printed 2497.03?

$ETH /USDT - SHORT

Trade Plan:
Entry: 2493.42 – 2500.64
SL: 2531.66
TP1: 2471.06
TP2: 2453.74
TP3: 2427.77

Why this setup?
Why now? The daily trend is range, which means the 1h ATR of 14.429742 is compressing into a tight band around the entry zone of 2493.42 to 2500.64, setting up a sharp move. The 15m RSI at 52.08 shows neither overbought nor oversold, so the 1h price is coiled and ready to break. With the short bias targeting TP1 at 2471.06 and TP2 at 2453.74, the invalidation level of 2476.84 is the
ETH+0.20%
BTC, Gold, and Crude Oil Analysis
live-cover
LIVE2,473
The public line setup, entering around 4385 and rising to 4393, has also broken out with room to run. ​​​$XAUT #Gate上线打金狗限时免Gas费
XAUT-0.45%
SOL faces pressure at elevated levels, with a short-term bearish bias

After SOL surged, overhead resistance gradually emerged, and the short-term outlook is bearish.
Reference entry around 105, with the first target around 100!$SOL #Gate闲钱宝自动生息享3%年化
post-image
SOL-1.52%
The U.S. stock market is closed today, so volatility won’t be significant. Manage risk accordingly, brothers.
#ZEC突破1200美元续刷新高
post-image
ZEC-0.34%
Insiders are calling UNI the next 10x after this setup.

$UNI /USDT - LONG

Trade Plan:
Entry: 7.09 – 7.15
SL: 6.80
TP1: 7.36
TP2: 7.52
TP3: 7.76

Why this setup?
Why now? The daily trend is bullish and the 1h price sits at 7.12, sitting right in the entry zone between 7.09 and 7.15. The 15m RSI at 60.76 shows room to run before overbought, while the 1h ATR of 0.134121 confirms the move has real volatility behind it. We are targeting TP1 at 7.36 and TP2 at 7.52, with the line in the sand at the invalidation level of 5.99.

Debate:
Are we hitting TP2 or getting trapped before the daily clos
UNI+1.14%
#GateEventContractTradeSharingChallenge
🔥 Gate Square Event Contract Screenshot Challenge Starts Today!
Confident in the market? Don’t just place orders—show off your analysis too 👇
Post your market view with #Gate事件合约晒单挑战 , or share screenshots of your positions, trades, or settlements after completing a transaction to participate!
🎁 The first valid screenshot post wins a 5 USDT fee cashback voucher
🛡️ New users can receive compensation of up to 5 USDT for losses on their first order
🏆 15 users win USDT, trial coupons, and official traffic support every day
🍀 Post your first entry toda
post-image
GateSquare
🔥 Gate Square Event Contract Screenshot Challenge Starts Today!
Confident in the market? Don’t just place orders—show off your analysis too 👇
Post your market view with #Gate事件合约晒单挑战 , or share screenshots of your positions, trades, or settlements after completing a transaction to participate!
🎁 The first valid screenshot post wins a 5 USDT fee cashback voucher
🛡️ New users can receive compensation of up to 5 USDT for losses on their first order
🏆 15 users win USDT, trial coupons, and official traffic support every day
🍀 Post your first entry today, then participate for 3 cumulative days for a chance to win 10 USDT
👉 Participate now: https://www.gate.com/campaigns/6081
📄 Event details: https://www.gate.com/announcements/article/101442
repost-content-media
The institutional case for crypto is increasingly tied to payment efficiency, not just asset ownership
Ripple CEO Brad Garlinghouse argues that central banks could use crypto to store and transfer value globally with near instant settlement, strong security and minimal costs
post-image
ImprovedTweet
🚨 4,000 BTC ($320M) left Blockstream’s Liquid Network.
1. Bug exploited
2. White-hat claim
3. Most BTC may be returned
What should the bounty be? 👀
post-image
BTC-0.57%
Everyone watching SYMBOL for a breakout is about to get blindsided by a short.

$ETH /USDT - SHORT

Trade Plan:
Entry: 2483.80 – 2491.10
SL: 2522.53
TP1: 2461.14
TP2: 2443.60
TP3: 2417.30

Why this setup?
Why now? The 1h price is sitting at 2487.45 inside a tight entry zone between 2483.80 and 2491.10, which signals exhaustion at the top. The 15m RSI at 45.77 shows bearish momentum without being oversold, meaning the drop has room to run. The 1h ATR of 14.61544 confirms enough volatility to reach the first target at 2461.14 and push toward the second target at 2443.60. The daily trend is a
ETH+0.20%
Load More

Join 40 M users in our growing community

⚡️ Join 40 M users in the crypto craze discussion

💬 Engage with your favorite top creators

👍 See what interests you

View More