Square
Following
Hot
News
Profile
Share your thoughts
placeholder
Article
The big 💊 is coming: 7 tokens worth over $100 million will unlock this week
LayerZero (ZRO) will unlock approximately 23.28 million tokens at 7 p.m. on October 20, about 3.83% of its circulating supply, worth approximately $43.3 million;
Kaito (KAITO) will unlock approximately 17.6 million tokens at 8 p.m. on October 20, about 3.69% of its circulating supply, worth approximately $5 million;
SOON (SOON) will unlock approximately 20.24 million tokens at 4:30 p.m. on October 23, about 3.50% of its circulating supply, worth approximately $6.3 million;
SoSoValue (SOSO) will unlock approximately 23
post-image
ZRO+0.82%
XPL-0.68%
H+1.38%
  • 1
Bad Boy Watch: CL Crude Oil 10.19
At the start of the new week, crude oil is still the first thing on the Bad Boy’s radar. CL’s candlestick chart shows the rally losing steam, with a pullback to the 5- and 10-day moving averages looking likely.
On the 4-hour chart, MACD hasn’t shown any divergence yet, so the rally still has support.
Looking at the external environment, the U.S. should be making a move by now, right?
Let’s see if there’s another pullback today, perhaps to around 95.
A pullback in CL could also create an opportunity for U.S. stocks to rebound. If you’re holding a relatively lar
CL-1.51%
Trenches
TSI
T
bade
b
TSI
0xa8...1c1e
Market Cap
$.
Change
.
24h Vol
$.
Holders
.
CNPY
C
bade
b
CNPY
0xc6...ddd2
Market Cap
$.
Change
.
24h Vol
$.
Holders
.
AGT
A
bade
b
AGT
0x5d...e274
Market Cap
$.
Change
.
24h Vol
$.
Holders
.
BOOMER
B
bade
b
BOOMER
0x5a...5c00
Market Cap
$.
Change
.
24h Vol
$.
Holders
.
PIERRE
P
bade
b
PIERRE
D3S6...pump
Market Cap
$.
Change
.
24h Vol
$.
Holders
.
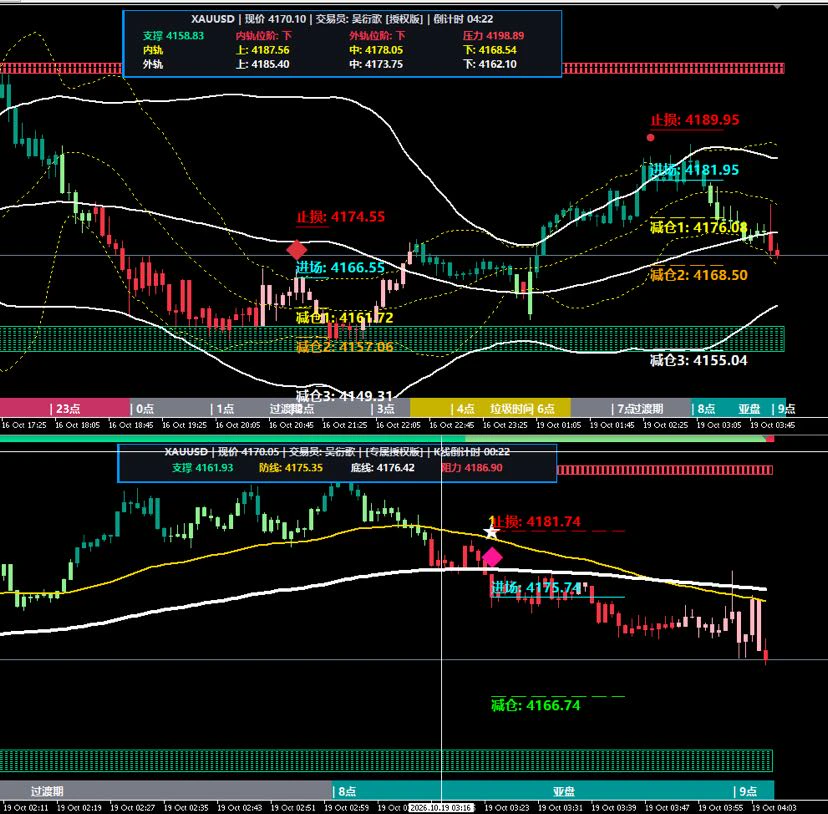
One signal from each this morning: an 81.95 short and a 75.74 short. The first is the new quant running for 5 minutes; the one below is the old one. I’ll test it live for a week before launching.#美国9月PPI大超预期
post-image
[New Streamer] Whales Moves in Sync!
live-cover
LIVE2,314
10.19 Morning Analysis$BTC ‌
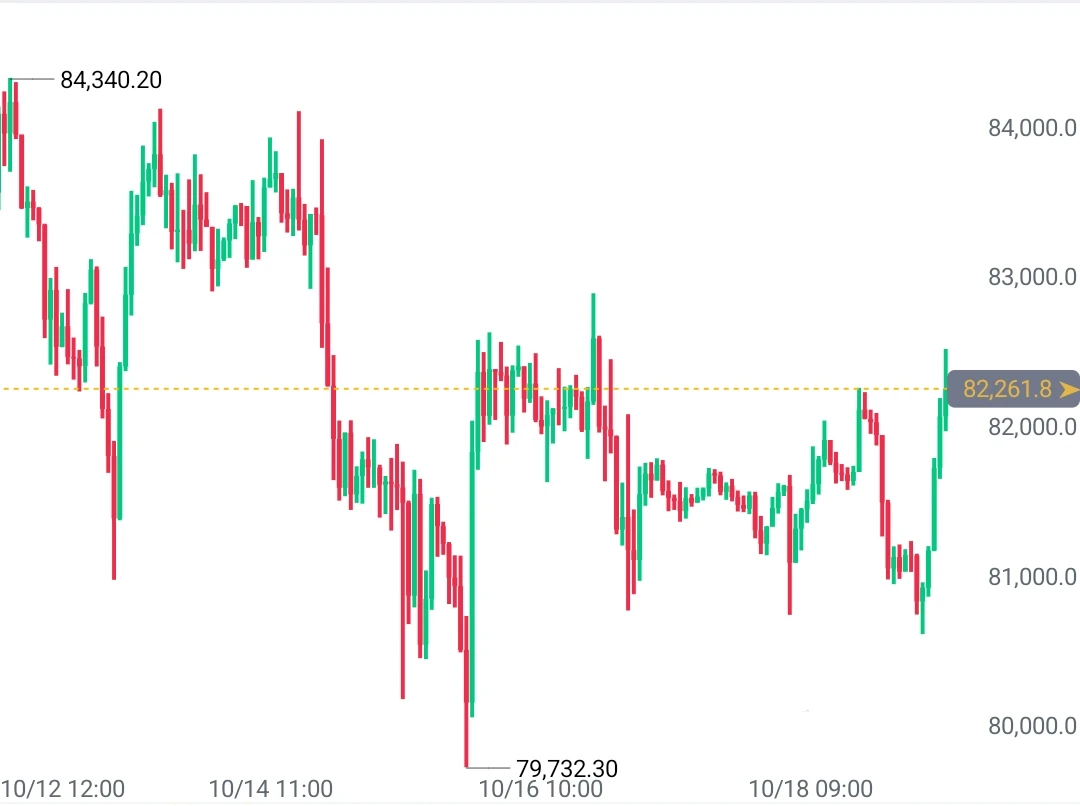
On the four-hour Bitcoin chart, price stabilized near the lows after an earlier deep decline. A single solid-bodied bullish candle rallied sharply from the lower Bollinger Band support zone, and the short-term price broke above EMA15 resistance, forming an initial bullish recovery structure. The medium- and long-term EMA30, EMA60, and EMA90 averages remain densely clustered overhead. However, as price stabilizes and rebounds, overhead pressure is gradually being absorbed. A breakout on increased volume would open up further upside. Overall, the indicators show sig
post-image
BTC+0.77%
#每周来晒 #WCTCS9 # Crypto Market Sentiment Turns Greedy
Fear and Greed returns to the greed zone | My view: The bullish trend still has room to run
The Crypto Fear and Greed Index has officially entered the greed zone, with BTC and ETH leading a market rebound as risk appetite rises rapidly. Many traders are caught in a dilemma: should they add to their positions in line with the trend, or immediately reverse course and turn bearish? My core view is simple: the medium-term trend remains bullish, and greed in this rally will continue to help major coins make another push higher. However, short-t
post-image
BTC+0.77%
ETH+0.20%
  • 3
🔥Semiconductors stage a major deep-V reversal! Is this a desperate comeback or a bull trap set by the big players? Candlesticks show sentiment; capital flows reveal the real story. A rally without financial backing is usually a bear's comfort zone. Nasdaq futures are up nearly 1%, lifting SNDK, SKHYNIX, and KORU in lockstep into deep Vs on the hourly charts, with MACD bullish crossovers amid bottom divergences—a highly tempting setup. But don't get carried away!
Look at the capital flow chart: SKHYNIX has a flow score of -100, indicating “strong outflows,” with an inflow share of 0%; KORU and
SNDK+5.24%
SKHYNIX+3.41%
KORU+12.43%
October 19 Asia-Europe Session Outlook
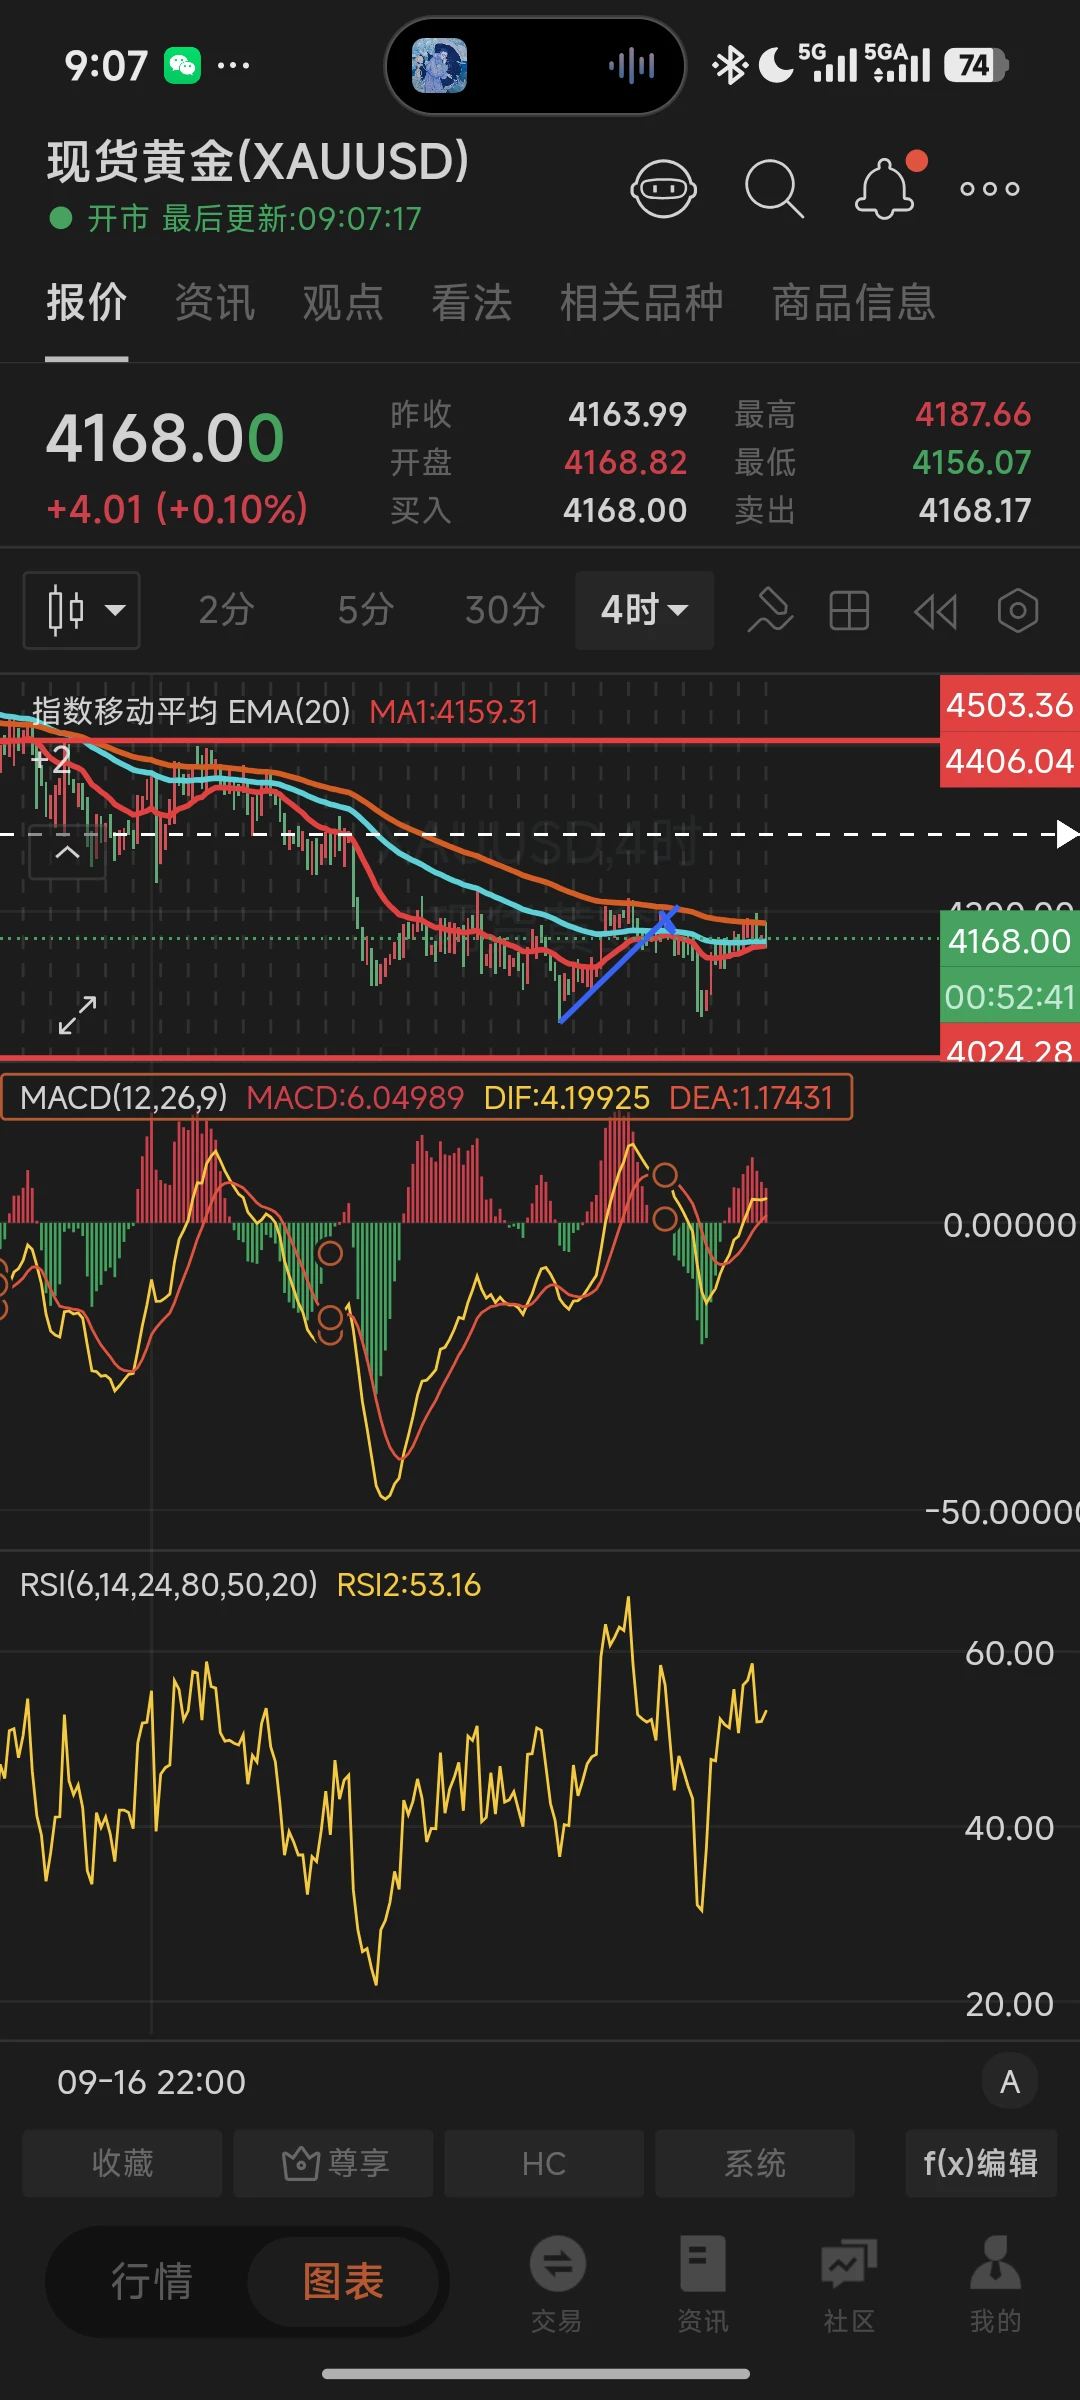
Price pushed higher at the open but was precisely capped by the 4h EMA100. The current 4-hour candle close looks concerning. Today, watch the 4215-4226 zone as a key area for bearish defense; only consider going long on a pullback if price gets above it. If it fails to break above, consider the 4113-4120 support zone.
Support: 4131-4137 (1h), 4113-4120 (4h), 4024-4035 (1day)
Resistance: 4215-4226 (1h, 4h), 4256-4260 (4h), 4303-4310 (1day)$XAUUSD
post-image
XAUUSD+0.13%
ETH has fallen to around $2,365, underperforming BTC, while long positions continue to get flushed out.
On the morning of October 19, CoinGlass figures compiled by multiple media outlets showed that roughly $359 million was liquidated across the market over the past 24 hours, including about $281 million in long positions, or around 78%. ETH liquidations totaled about $82 million, more than BTC’s roughly $48 million.
ETH traded in a range of about $2,360 to $2,427, near its intraday low. BTC remained range-bound around $81,000 to $82,000. The relative weakness is clear.
I’m more inclined to re
ETH+0.20%
BTC+0.77%
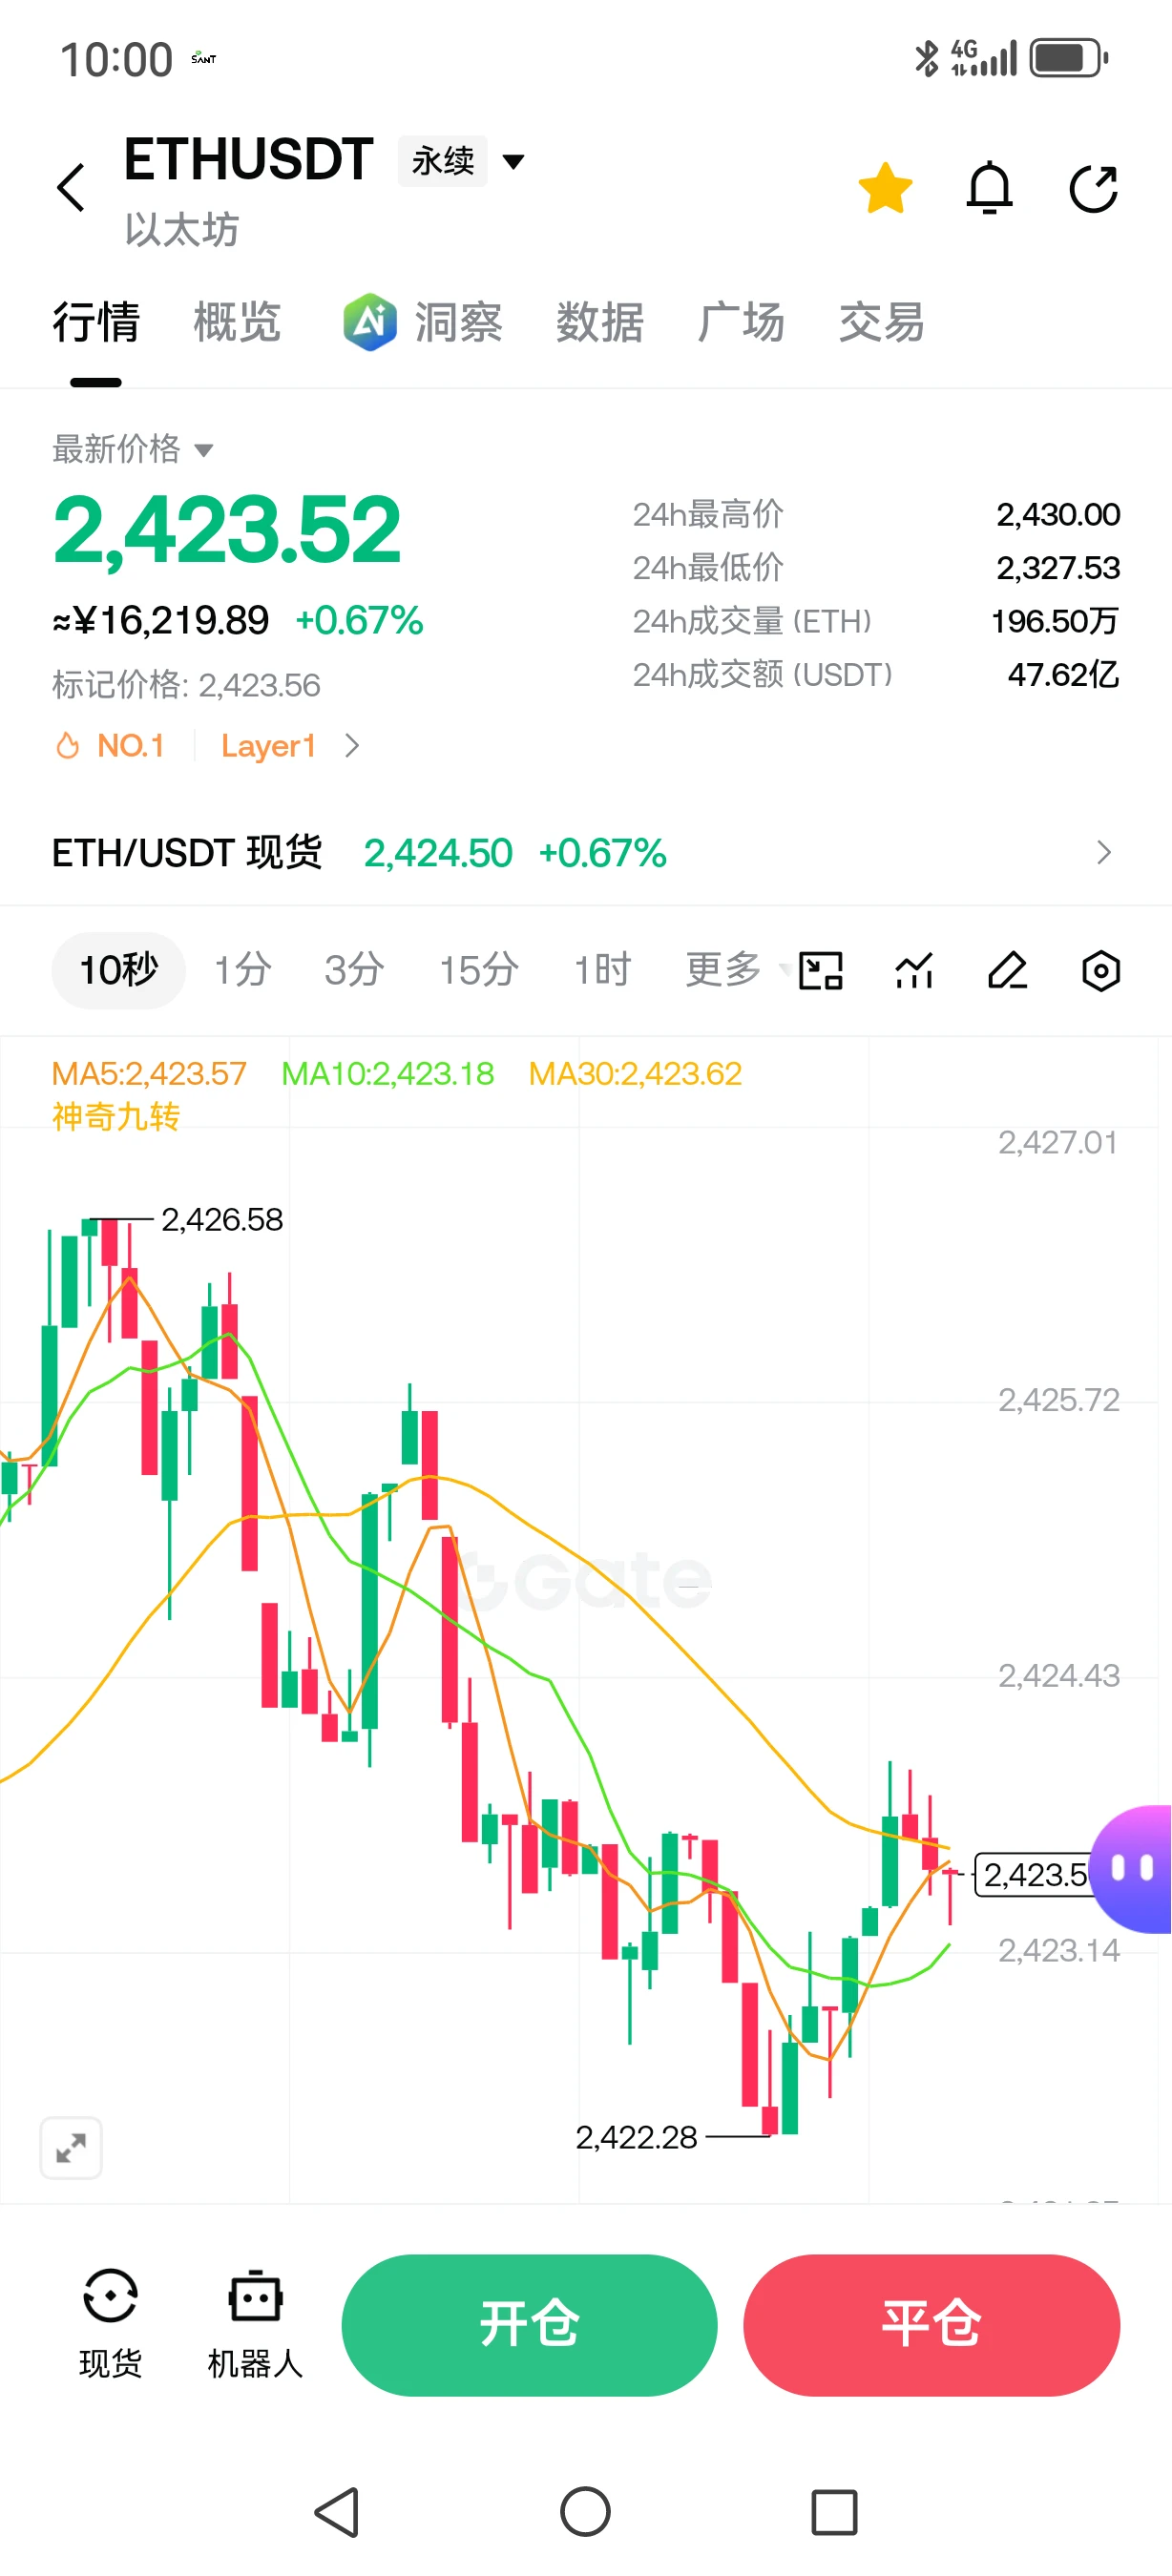
$ETH Short around 2430, take profit at 2405-2385, stop-loss at 2445. Follow me for precise strategies every day—those who follow along make profits. Join my livestream every night at 8:30 to share strategies and place trades
post-image
ETH+0.21%
10/19 Gold:
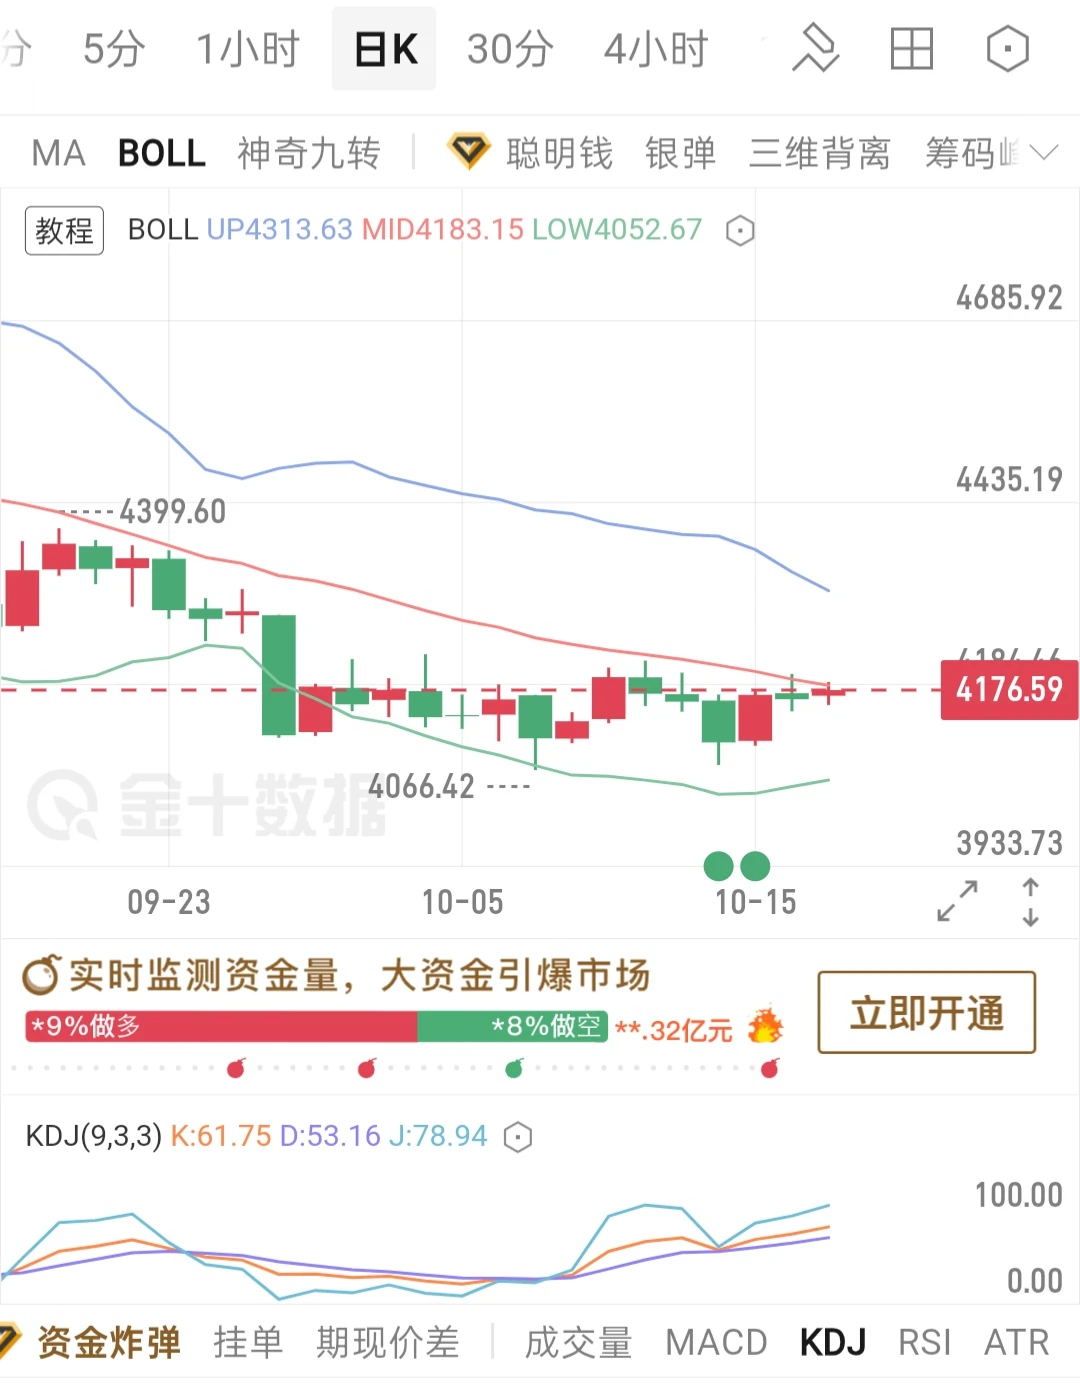
On the daily chart, the current price is trading just below the Bollinger middle band. After the previous decline, a bottom has formed at the lows, and the candlesticks have gradually moved higher, creating a rebound structure from the bottom. However, the price has yet to rise above the Bollinger middle band, which is the first short-term resistance.

KDJ indicator: K=61.75, D=53.16, J=78.94. The three lines are diverging upward and are in bullish territory. The J value is approaching 80, showing slight short-term overbought signs and the possibility of a pullback for consolidati
post-image
GLDX+0.07%
PAXG+0.27%
XAU+0.30%
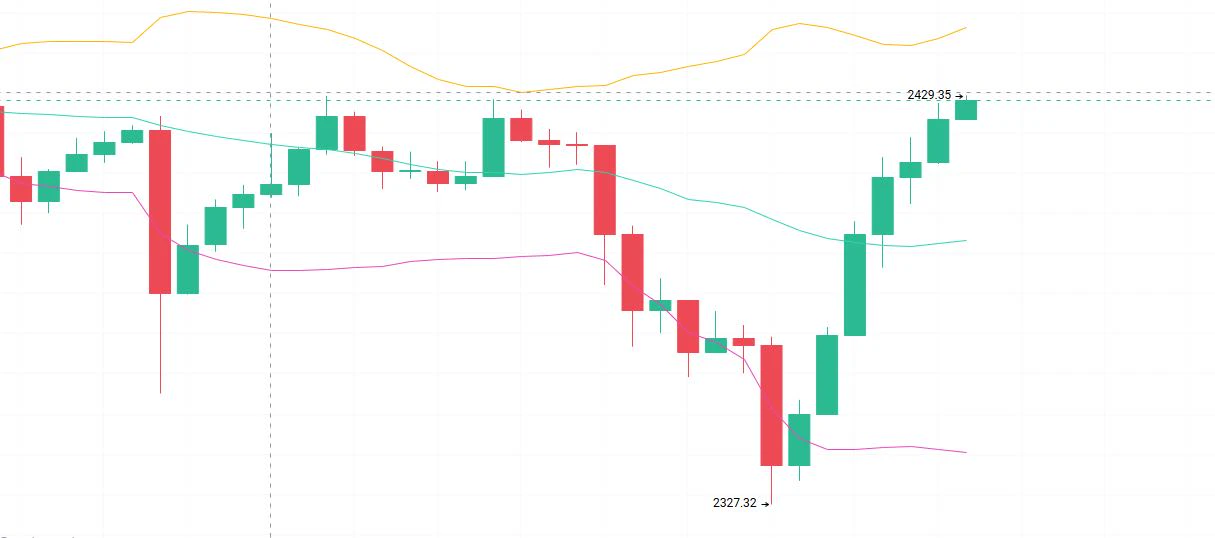
10.19 ETH Analysis
Analysis: Short a rebound near 2435–2455, with a stop at 2475. First target: 2400; second target: 2370.
The market staged a strong oversold rebound from the interim low of 2327.32, with consecutive bullish candles pushing it to an interim high of 2429.35. It is currently at 2428.22. This rebound is a V-shaped recovery after a sharp decline. Short-term bullish momentum is strong, but the price is gradually approaching a previous high-volume resistance zone, where trapped buyers and selling pressure will increasingly emerge, limiting the room for further gains. #GateWCTCS9全球交易
post-image
ETH+0.21%
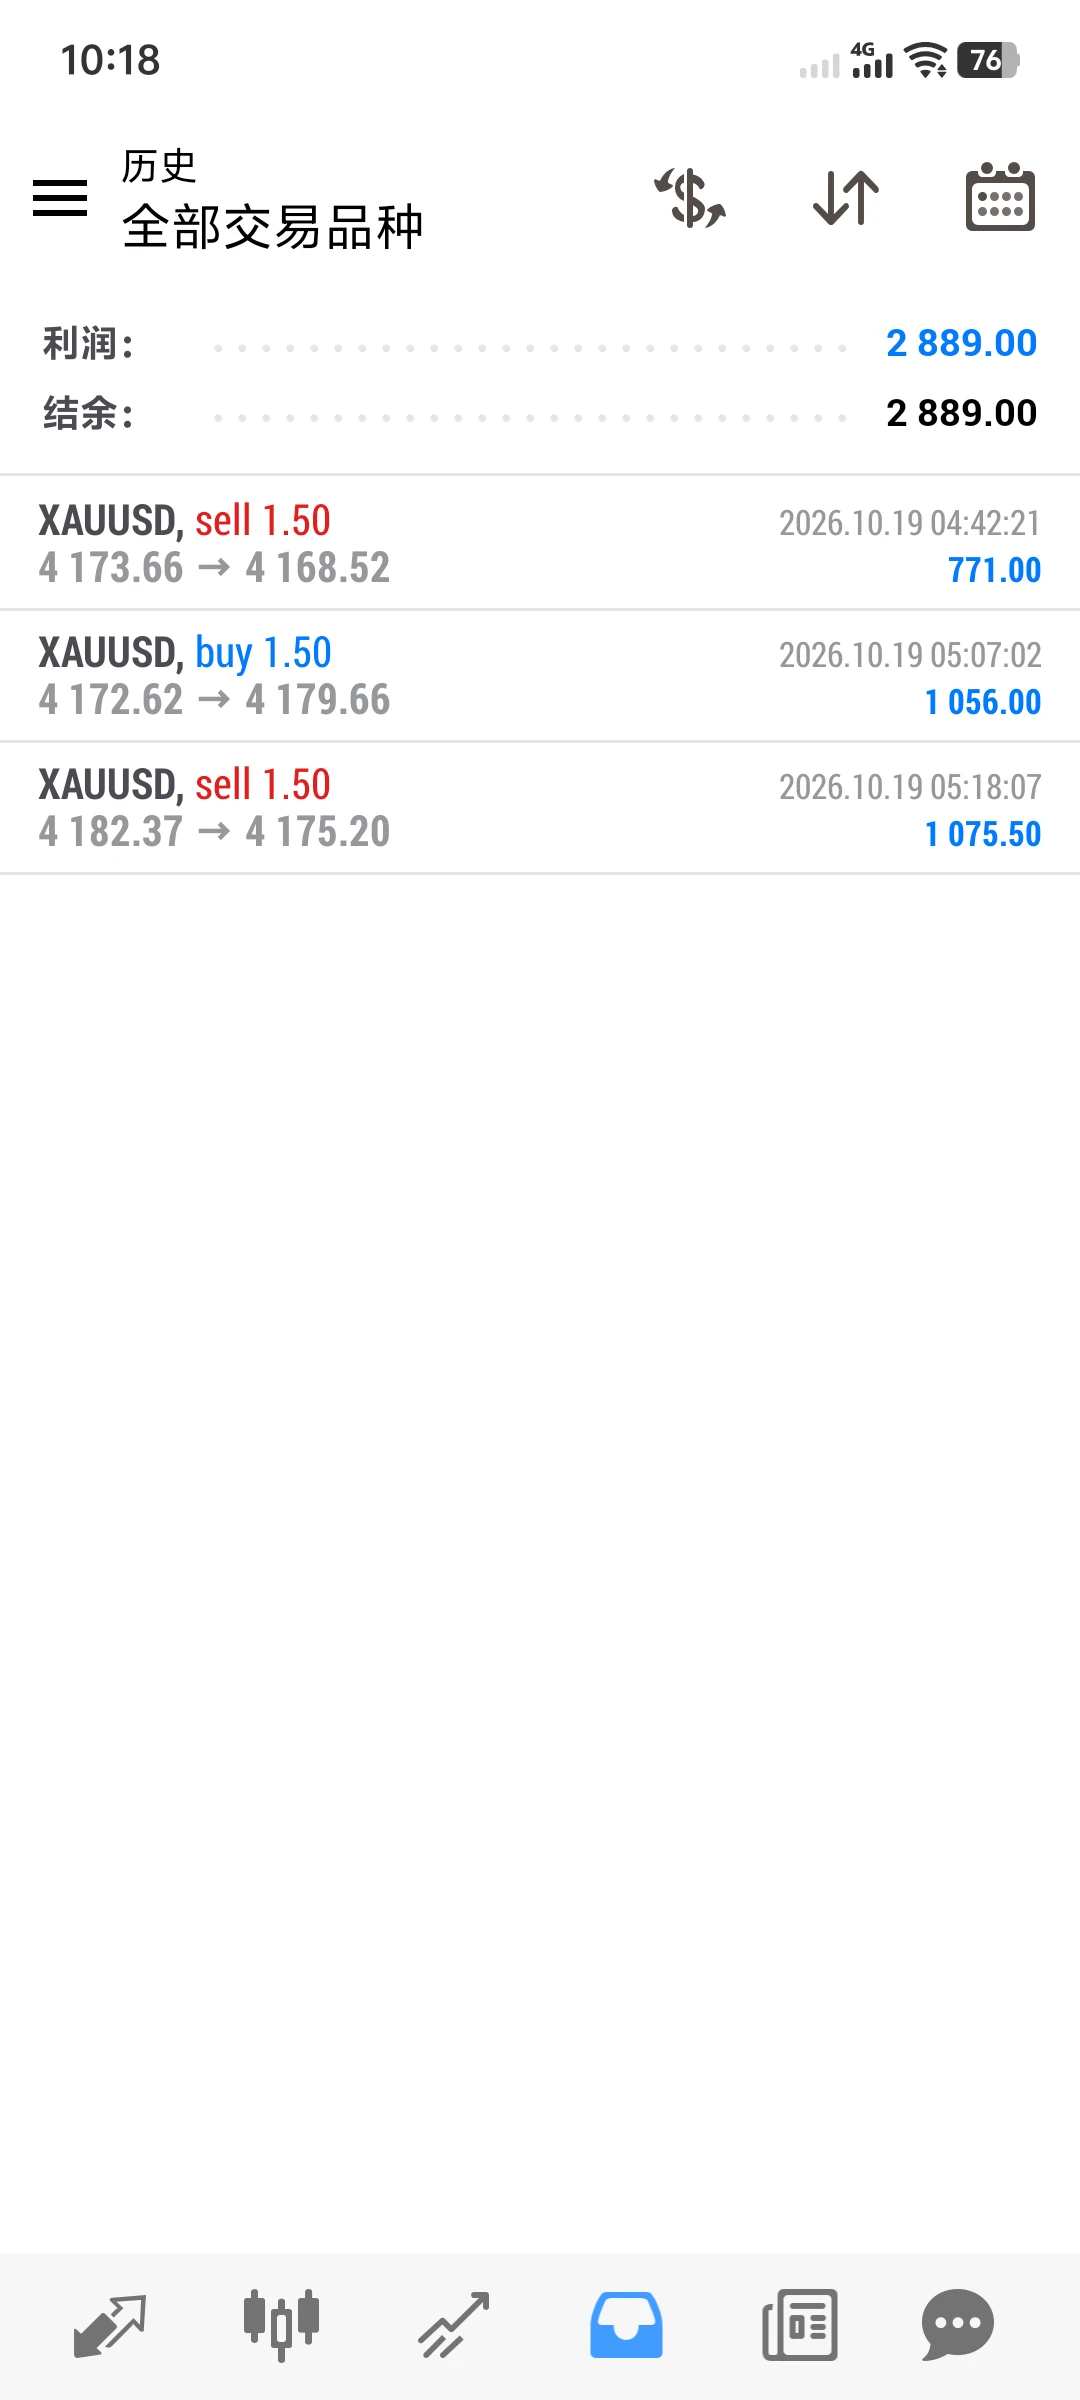
Three consecutive intraday wins for gold
Shorted at 4182, exited at 4175, 7 points, 1075🔪$XAUT
post-image
XAUT+0.25%
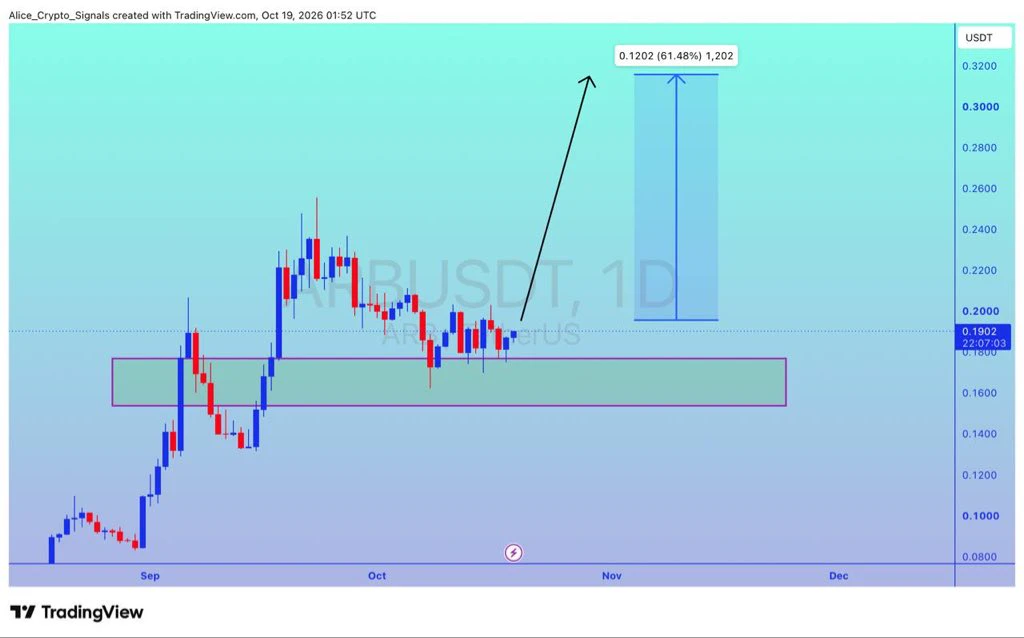
$ARB
UPDATE
#ARB is getting a good support here. In this move we can see 60%+ gain here ✍🏻
#ARBUSDT #ARBBTC #Btc #Bitcoin #Nfts
post-image
ARB+4.09%
BTC+0.79%
10.19 Market Analysis
BTC Short Setup
Entry zone: around 82800–82500, short
Stop loss: 83400
First target: 81600, second target: 80500
BTC climbed from 806 overnight and stopped near 82548, where it has been moving sideways.
After this bullish run, the market is taking a breather for now, with bulls and bears pulling back and forth here. After the surge, there isn't enough momentum to keep pushing higher, so price is now consolidating as some profitable traders prepare to exit.
On the one-hour chart, this rally has lifted all the short-term moving averages, and support has risen along with the
BTC+0.77%
ETH+0.20%
$APR performed better than I expected.
Glad to close out here. Congrats if you followed. Profit: $ 949 Today’s assets to watch: $SEN and $ZEC .
post-image
APR-21.27%
ZEC+2.65%
Morning, everyone!
Monday trading starts!
It felt a little chilly on the way to work today
and quite refreshing too
Today is the first day of trading for global financial markets
Hope the market doesn't cool off😂
What do you all think of today's market?
post-image
Load More

Join 40 M users in our growing community

⚡️ Join 40 M users in the crypto craze discussion

💬 Engage with your favorite top creators

👍 See what interests you

Trending Topics

USSeptemberPPIBeatsExpectations

91.35k Views1.94k Discussing

US September PPI came in at 6.3% YoY, well above the 5.3% market expectation, pointing to renewed producer-side inflation pressure. Weekly jobless claims were 199K, broadly in line with forecasts. Could hotter inflation further reduce room for rate cuts, and what does it mean for $BTC, US stocks, and gold?

GateWCTCS9GlobalTradingCompetition

37.87k Views6.86k Discussing

GateBTCAndETHFuturesVolumeRanksTop3

53.8k Views1.98k Discussing

View More