Share your thoughts
placeholder
Article
Nobody is shorting SKYAI right now, and the 1h ATR says that is the trade.

$SKYAI /USDT - SHORT

Trade Plan:
Entry: 0.05099 – 0.05139
SL: 0.05311
TP1: 0.04975
TP2: 0.04879
TP3: 0.04735

Why this setup?
Why now? The daily trend is bearish, the 1h RSI sits at 40.87 showing room to drop, and the 1h ATR of 0.000801 confirms momentum is still expanding downward. The entry zone at 0.05119 aligns with the 1h price, giving a precise trigger, while TP1 at 0.04975 and TP2 at 0.04879 define a realistic two-stage target run. The invalidation level at 0.05568 is the hard line in the sand that separates
SKYAI-1.89%
Tom Lee Sees a Bullish Year Ahead for Crypto
Fundstrat’s Tom Lee expects the next 12 months to be a strong period for the crypto market.
His view is based on two key factors: the major leverage cleanup from last October and the possibility that the current four-year crypto cycle reaches a bottom around October.
If that cycle thesis plays out, Lee believes the market could enter a more favorable phase from here.
It’s an outlook, not a guarantee but the leverage reset and market-cycle structure are worth watching closely.
#ShareWeekly
DYOR. Not financial advice.
post-image
DYOR+0.95%
  • 5
  • 2
$1000 to $100,000 Crypto Trade Challenge Today
live-cover
LIVE537
JUST IN: Bitcoin could become the “third leg” of traditional portfolios as AI investment boom and rising stock-bond correlation squeeze diversification, per Bitcoin Suisse. $BTC
post-image
BTC0.00%
#ZECPlungesOver13%
ZEC just gave the market a reality check — and now I’m watching what happens next.
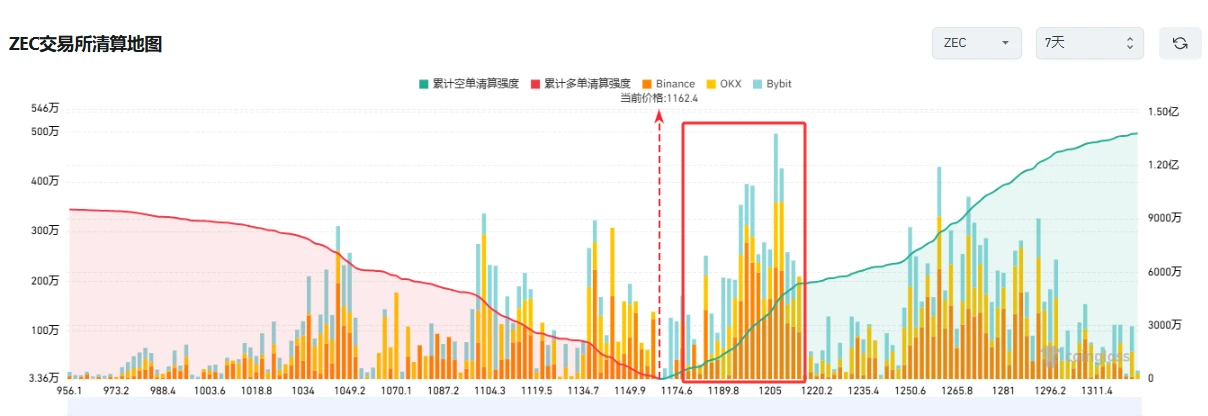
The old “ZEC is down 13%” headline is already behind us. ZEC is now trading around $1,150, after the sharp correction from the recent record zone. What interests me is what happened after the selloff: buyers stepped back in instead of allowing the price to collapse straight through the psychological $1,000 level.
For me, this is no longer simply a “buy the dip” question.
ZEC made an extraordinary move from the $500 area in August to above $1,200, so a violent correction after that kind of ral
post-image
ZEC-2.76%
market update
live-cover
LIVE2,140
ARBITRUM BEARS ARE PUSHING BUT THE BULLS ARE STILL IN THE GAME
We are seeing some volatility on $ARB as it sits at $0.1419, marking a -2.07% decline today. With a 24-hour high of $0.1464 and a low of $0.1374, the tight range is keeping traders on their toes. These example setups are for illustration only to help manage risk, not a prediction. Not financial advice, so please do your own research.
🟢 LONG SCENARIO: If buyers step in, an illustrative setup suggests entry around $0.1419, targeting $0.148995 with a tight stop-loss at $0.137643.
🔴 SHORT SCENARIO: If selling pressure continues, an i
post-image
ARB+0.04%
A few days ago, I was still calculating whether I had enough money for instant noodles this month; this morning, I’m already wondering whether to add sausage. The $TRUMP short position has paid off, making the patience of the past few days worthwhile.

With the screen glowing green, most people were asking where the bottom was. My judgment is straightforward: the rebound lacks volume, resistance above is obvious, and every push higher falls just short—the bull trap is impossible to hide now. The short entered at 2.369 just fell to 1.992 at the current price, with a +1129.17% return flashing r
post-image
TRUMP+1.69%
XRP+0.89%
ADA+1.27%
Why is everyone suddenly calling XRP a range-bound trap when the 1h price sits at 1.365?

$XRP /USDT - SHORT

Trade Plan:
Entry: 1.363 – 1.367
SL: 1.385
TP1: 1.350
TP2: 1.341
TP3: 1.326

Why this setup?
Why now? The daily trend is range, which means the 1h price at 1.365 is acting as the entry_ref for a short setup with an entry zone between 1.363 and 1.367. The 15m RSI at 36.65 shows bearish momentum without being oversold, allowing room to run toward TP1 at 1.350 and TP2 at 1.341. The 1h ATR of 0.008164 tells us each candle moves roughly 0.8%, so the distance to TP1 is well within one ave
XRP+0.89%
Former Alameda Research CEO Caroline Ellison is now working full-time at nonprofit grant platform Manifund after serving her prison sentence over the FTX collapse.
She had already been working there since July under the pseudonym “Carol” before her identity was revealed.
post-image
No conviction, can’t hold on, this round’s profits are paper-thin, but I love it. 😆 What you can pocket is yours; if you get too greedy, you often end up with not even the soup left. It may sound timid, but in futures, staying alive matters more than anything.

During the repeated intraday swings, I kept my eyes on the $AKE bottom area. The price pressed down several times but couldn’t break that line, and the signs of funds quietly entering were simply too obvious. Building a base without breaking down is basically handing me an entry. Around 0.0088431, I went long directly. Don’t lose pati
post-image
AKE+16.21%
BNB+0.57%
ETH-0.79%
Insiders are quietly loading BNB at 729.15 while everyone else hesitates.

$BNB /USDT - LONG

Trade Plan:
Entry: 728.26 – 730.04
SL: 720.62
TP1: 735.55
TP2: 739.81
TP3: 746.21

Why this setup?
Why now? The daily trend is bullish, the 1h RSI sits at 25.25 showing extreme oversold fatigue, and the 1h ATR of 3.553511 signals enough momentum for a clean push toward the entry zone at 729.15. The 1h price is 729.10, sitting just below the entry reference, which means a fill is imminent if buyers step in. The plan targets TP1 at 735.55 first, then TP2 at 739.81, with TP3 at 746.21 as the extended
BNB+0.57%
$BTC Signal】4H moving average resistance, 1H squeeze at the end, short on the rebound
$BTC 4H moving averages in a bearish alignment, 1H Bollinger Bands squeeze at the end, current price 77333.9 touching the upper band.
4H RSI 42.81, 1H RSI 50.14. MACD histogram values are expanding positively on both timeframes, recovering below the zero line. Order book depth_imbalance 66.04%, bid/ask 4.89, with thick bids below. Funding rate 0.0036%, OI Stable, insufficient conditions for a short squeeze. Rebound volume is shrinking, with 77389 above holding as resistance, so the bearish structure continu
post-image
BTC-0.02%
ETH-0.80%
SOL+0.48%
I thought I understood Python… until I tried building this. 👀
Day 21 of #100DaysOfCode 🚀
Today I improved my Inventory Management System:
📦 Add products
🗑️ Remove products
🔍 Check products
🧠 Practice functions & lists
The bugs are teaching me more than the tutorials ever
post-image
Everyone's ignoring BNB's oversold 15m signal before the explosive move up.

$BNB /USDT - LONG

Trade Plan:
Entry: 729.03 – 730.87
SL: 721.14
TP1: 736.55
TP2: 740.96
TP3: 747.56

Why this setup?
Why now? The daily trend is firmly bullish, giving the broader backdrop for a long setup. The 15m RSI at 28.24 shows the short-term pullback is deeply oversold, meaning sellers are exhausted. With the 1h ATR at 3.67, there is enough volatility to fuel a meaningful move from the entry zone around 729.95. Targets are stacked at 736.55 for TP1 and 740.96 for TP2, while 723.09 is the line in the sand th
BNB+0.57%
Most traders are about to get rekt by a range that hides a secret short setup in $CL /USDT

$CL /USDT - SHORT

Trade Plan:
Entry: 95.78 – 96.00
SL: 96.95
TP1: 95.09
TP2: 94.56
TP3: 93.76

Why this setup?
Why now? The daily trend is range, which means $CL /USDT is coiling and the 1h ATR of 0.442956 shows volatility is about to explode. The 15m RSI at 59.14 signals the market is not overbought yet, giving the short bias room to breathe before a flush. The entry zone sits between 95.78 and 96.00, with the 1h price at 95.89 acting as the exact trigger for the play. TP1 is 95.09, TP2 is 94.56, a
CL-1.05%
$NEAR Bearish Outlook
NEAR is showing weakness around the $2.37 area, with sellers defending the nearby resistance.
If price stays below $2.38, the downside could extend toward $2.35, followed by $2.34 and $2.33.
Entry: $2.3702 – $2.3726
SL: $2.3807
TP1: $2.3543
TP2: $2.3464
TP3: $2.3385
The bearish view remains valid while price stays below the key resistance zone.
$NEAR #CoinDeskRevealsGateRWAPerpetualsTop3Globally
DYOR. Not financial advice.
NEAR-6.58%
  • 3
shorting $ETH is not a good option here imo
post-image
ETH-0.79%
#Hindpetro
When rest of petro stock are going up 😮‍💨
#ZECPlungesOver13%
ZEC is now trading around $1,125, extending its pullback after recently trading above the $1,200 level.
A move from $1,200+ toward $1,125 can easily create fear, especially for traders who entered late during the rally. But after such an explosive move, a correction is not necessarily a sign that the entire trend has failed.
Sometimes the market simply needs to reset.
And right now, ZEC is entering a zone where I believe the next reaction could be more important than the size of the recent decline.
$1,125 Is Becoming a Key Psychological Area
The first thing I would watch is
ZEC-2.54%
Load More

Join 40 M users in our growing community

⚡️ Join 40 M users in the crypto craze discussion

💬 Engage with your favorite top creators

👍 See what interests you