Square
Following
Hot
News
Profile

patch

vip
Peak Tier 3
Active for: 5.6y
No content yet
1
Following
19
Followers
24
Liked
#ONDO Weekly outlook.
Friends, Ondo $ONDO closed at 0.5218 four weeks ago, while today it is at 0.40, 34% below its September peak of 0.6089. Weekly RSI is 50.
Price is above the 50-week average at 0.3577, just below the August peak of 0.4282. Below are 0.3577 and the September low of 0.323, with the June low of 0.2937 beneath that.
If 0.4282 is breached to the upside, the May peak of 0.4877 and September peak of 0.6089 are next. The structure remains intact as long as weekly closes hold above 0.3577; below that, 0.323 is the first stop.
This is not investment advice.
ONDO-0.29%
  • 1
Write in the comments which coins you’d like me to review.
I’ll measure the levels on the weekly and daily charts and share them one by one with annotations. Measured levels only, no buy/sell calls.
I’ll start with the most requested ones.
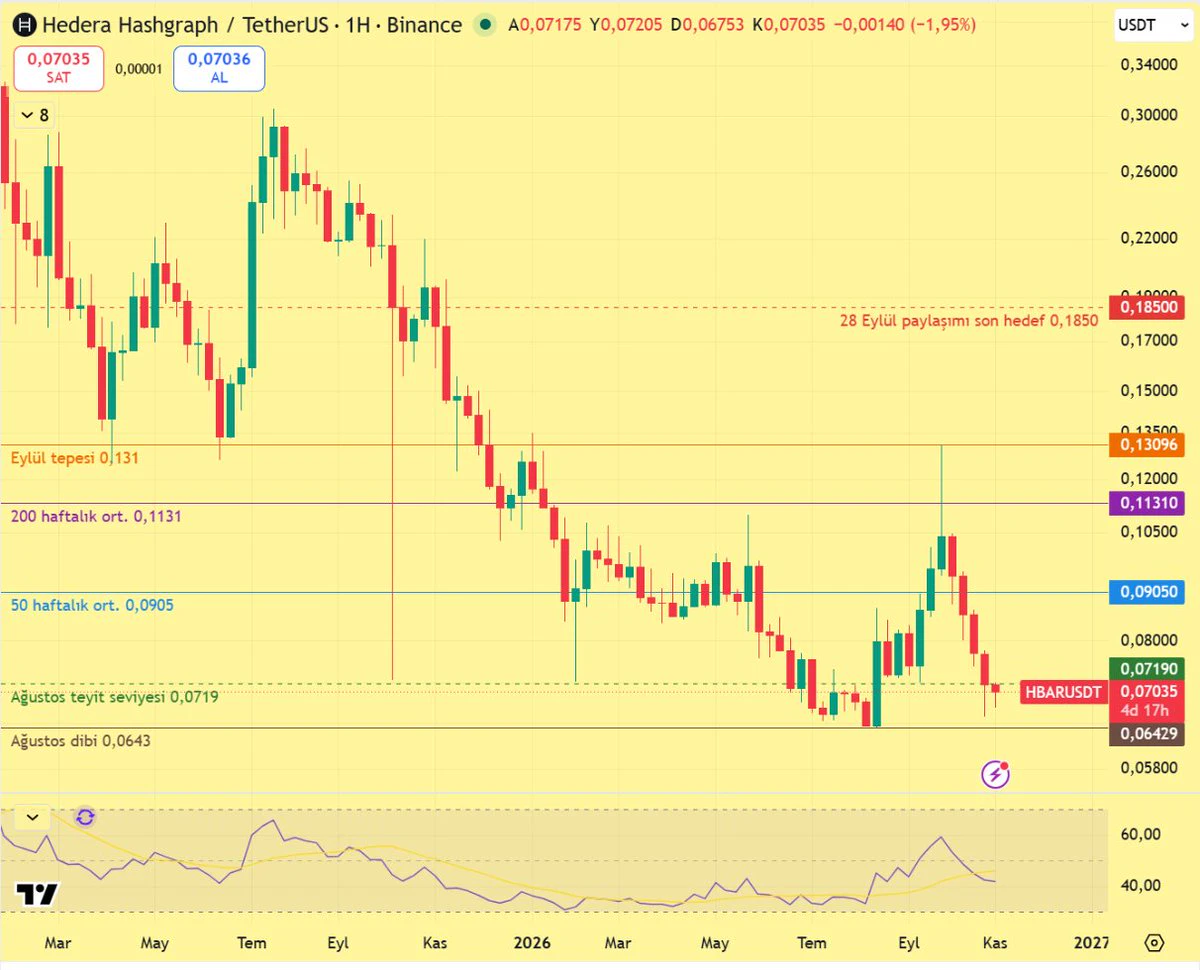
#HBAR What happened to the targets, where are they now?
Friends, we shared Hedera $HBAR at 0,0686 on August 10 and gave targets of 0,0743 / 0,0840 / 0,1099 / 0,1389 / 0,1850. On September 28, at 0,1223, we said, “the targets have been hit one by one.” We checked: September’s peak was 0,131, so the first three targets were hit; 0,1389 and 0,1850 were not.
Things turned sharply afterward. The price fell from its peak to 0,066 in 5 weeks; today it is 0,0704. It closed at 0,0941 4 weeks ago, then fell below the 50-week average of 0,0905. The weekly RSI is 42. Last week’s low was 0,0660; the 52-we
post-image
HBAR-1.36%
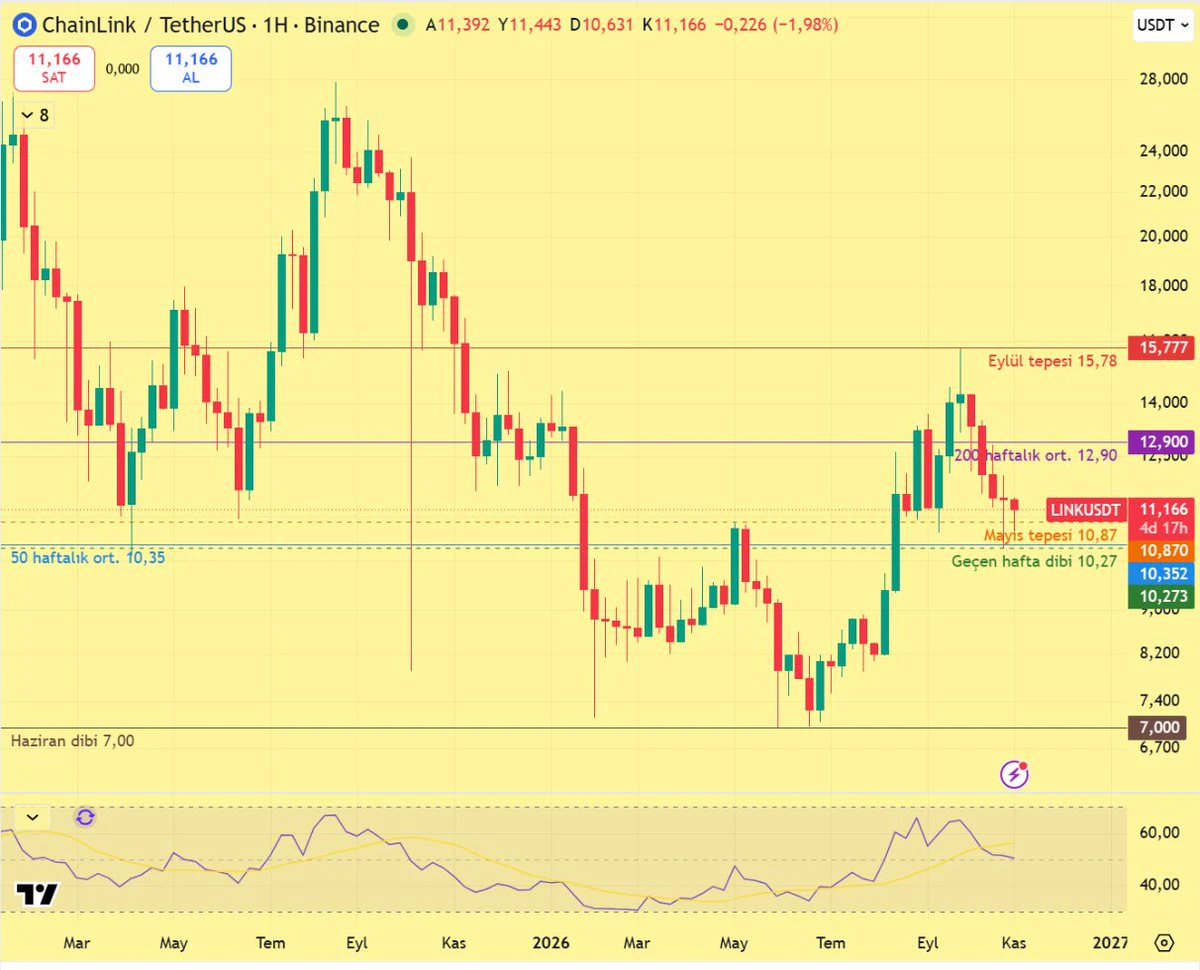
#LINK #ONDO Weekly outlook.
Friends, two coins, two charts.
Chainlink $LINK : Closed at 13.35 four weeks ago; today it is at 11.17, down 29% from the September peak of 15.78. Weekly RSI is 50. Price is above the 50-week average of 10.35 but below the 200-week average of 12.90. Below are the May peak at 10.87 and last week's low at 10.27; if it closes below 10.35 on the weekly, the June low around 7.00 will be back in focus. Above, it first needs to reclaim 12.90, then 15.78.
Ondo $ONDO : Closed at 0.5218 four weeks ago; today it is at 0.40, down 34% from the September peak of 0.6089. Weekly RSI
post-image
ONDO-0.29%
LINK-0.18%
#USDTD #BTCD #TOTAL #OTHERSD Four charts, one story.
Folks, we read the market’s direction by looking at these four charts, not just one coin. We measured all four; the charts are below in order.
USDT dominance (USDT.D): Tether’s share of the total market. If it’s rising, people are selling coins and fleeing to dollars; if it’s falling, money is flowing into coins. It fell to 3.7% at the bull-market peak in December 2024 and peaked at 9.35% in August 2026. It’s currently at 6.86%, above the October low of 6.27%. It’s too early to say “money is coming back” before we get a weekly close below th
USDT+0.00%
BTC-0.67%
  • 1
#BTC #ETH Post-election.
Folks, Democrats won the U.S. midterm elections, and both the Senate and the House of Representatives changed hands, according to NBC and CBS projections. As results came in overnight, the market sold off first, then recovered.
Bitcoin $BTC fell as low as 75,736 overnight, its wick piercing the 76,260 support level with 7 touches, then returned to 78,240 in the morning. It is now at 78,200, back above the lower line of the descending channel. The first threshold is 78,960; a daily close above 79,468 would confirm a reversal. A close below 76,260 would put 74,210 in vi
BTC-0.67%
ETH-1.26%
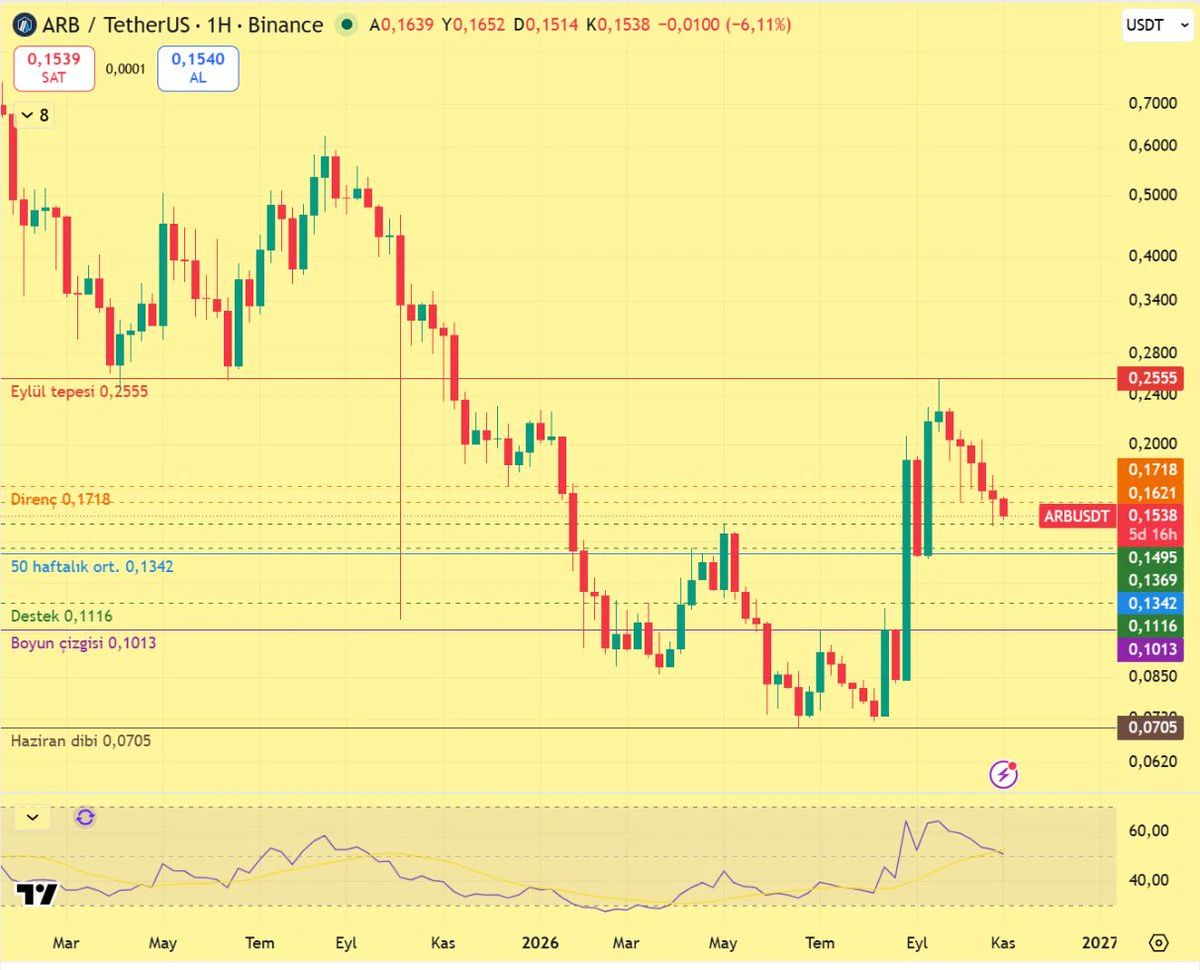
#Arbitrum Weekly view.
Friends, $ARB has been pulling back from the September peak at 0.2555 for 6 weeks; today it is at 0.1538. Weekly RSI is 51, and the price is above the 50-week average of 0.1342.
We are still above the double-bottom neckline at 0.1013, broken at the end of August; the weekly structure remains intact. Supports below are 0.1495, 0.1369, and 0.1116.
The first resistances above are 0.1621 and 0.1718. As long as there is no weekly close below 0.1342, the picture is stronger than for other altcoins.
This is not investment advice.
post-image
ARB+1.17%
#Ethereum Weekly outlook.
Folks $ETH 4 weeks ago it closed at 2,537; today it’s around 2,255, below the 50-week average of 2,304. The weekly RSI is 48, neither oversold nor overbought.
The first key area below is 2,129, which has held 12 times on the daily chart. If it’s lost, the February low of 1,800 and the June low of 1,506 come into play.
Above, 2,304 must be reclaimed first, followed by the 200-week average at 2,559 and the September high of 2,807. It’s too early to call it a recovery before the weekly close moves back above 2,304.
This is not investment advice.
ETH-1.26%
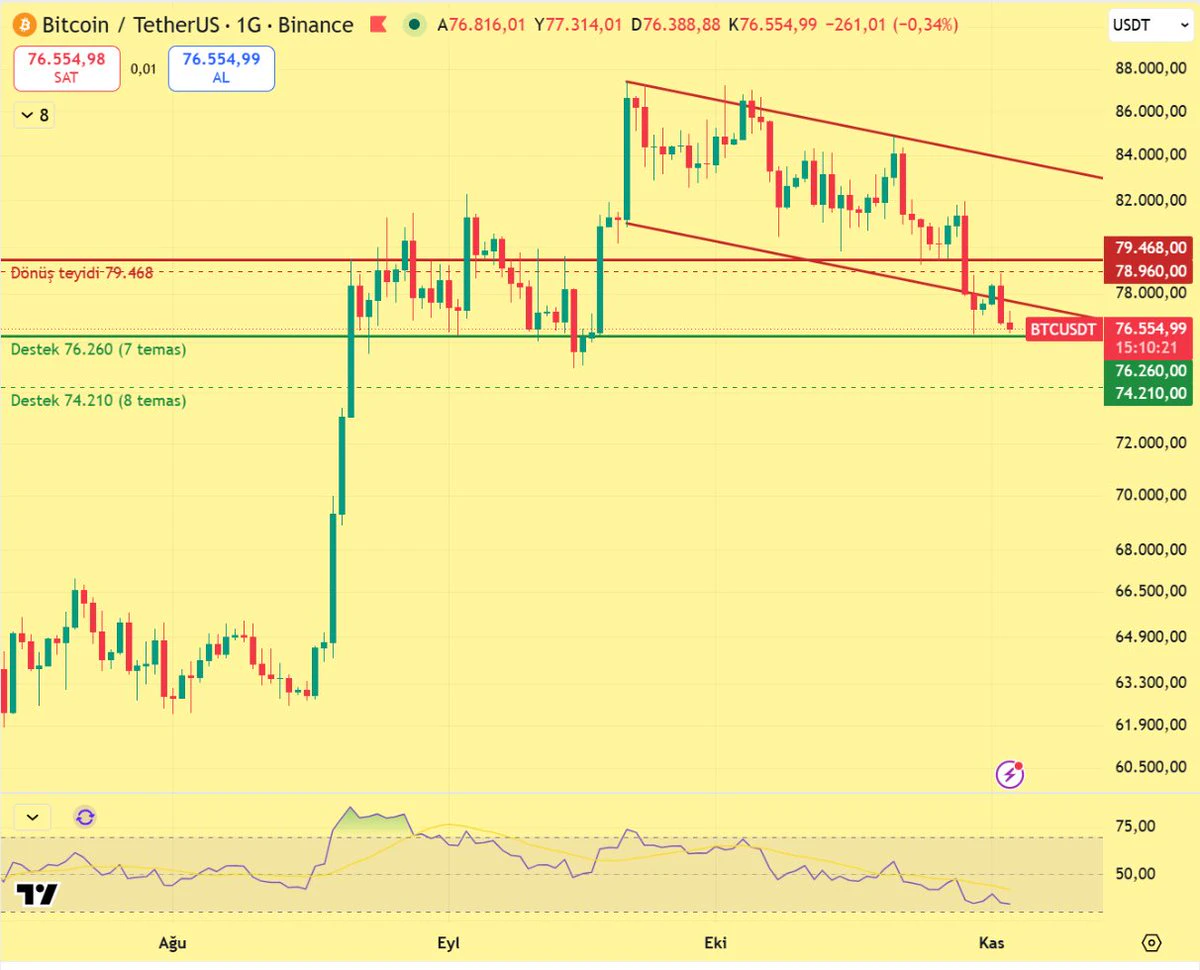
#Bitcoin Current outlook.
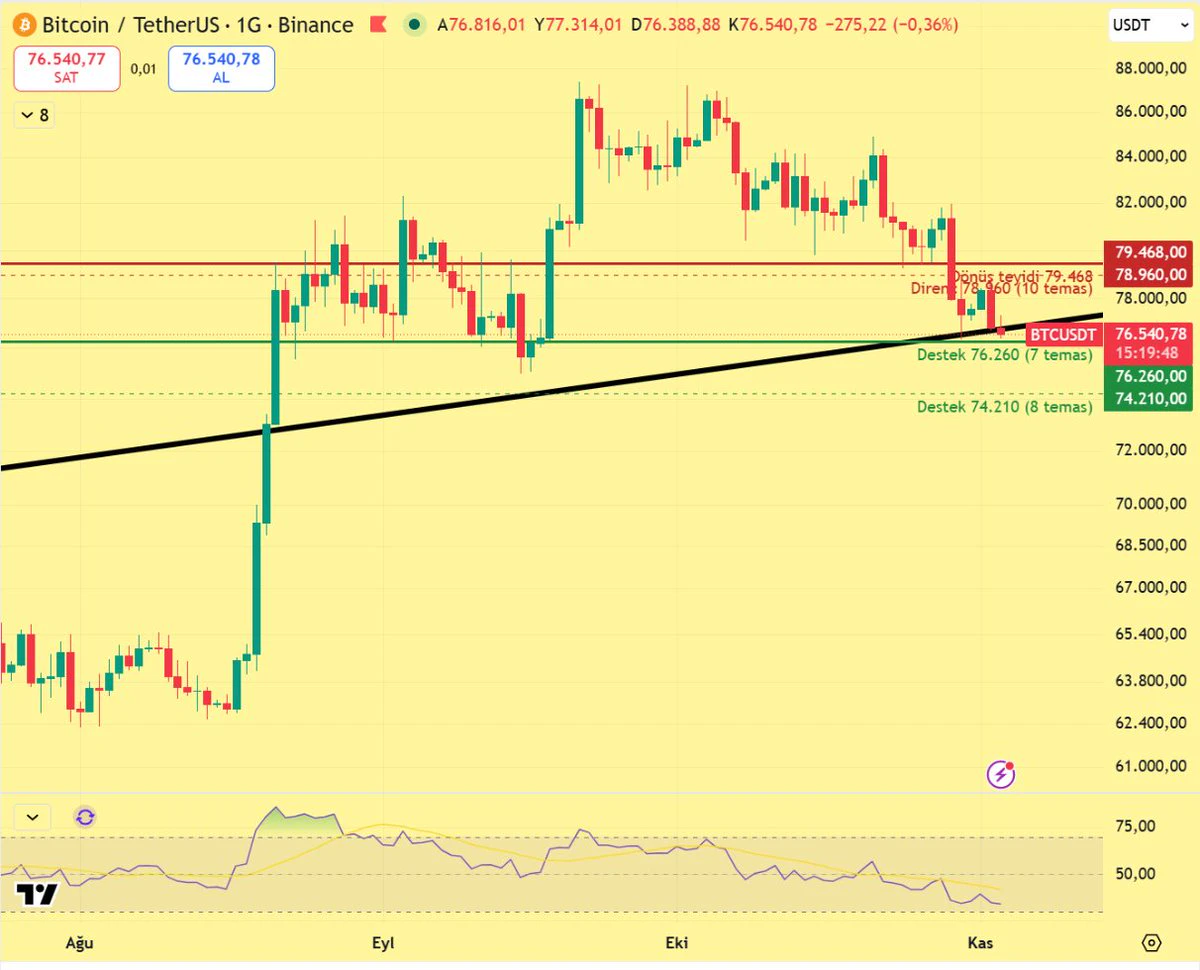
Folks, $BTC the lower line of the descending channel from the September peak appeared to have been reclaimed on Sunday, but it was lost again yesterday with a close at 76,791. The 76,260 support, which has been tested 7 times, is being tested now.
A daily close below 76,000 would make 74,200 the next stop. The first hurdle above is 78,960; a 4-hour close above 79,468 would confirm a reversal.
Note: Since 2021, on days when RSI was below 35, 3 of 4 events saw a lower close first, with the rebound starting from the bottom. Don't rush.
This is not investment advice.
post-image
BTC-0.67%
#Bitcoin Current outlook.
Friends $BTC , yesterday it again lost the descending channel it had entered on Sunday, closing at 76,791. The 7-touch support at 76,260 and the rising trendline from January are now being tested in the same area.
If there is a daily close below 76,000, the next stop is 74,200. The first hurdle above is 78,960; a 4-hour close above 79,468 would confirm a reversal.
Note: Since 2021, on days when RSI was below 35, 3 of 4 cases saw a lower close first, with the rebound starting from the bottom. Don’t rush.
This is not investment advice.
post-image
BTC-0.67%
Load More