Square
Following
Hot
News
Notifications
Profile
Share your thoughts
placeholder
Article
$PI Pump it up, max it out at 50x; if the market cap is missing a zero, I concede
PI-0.60%
GN 🌙
Charts on fire outside, but under the covers…
This is fine. 🔥🐶🔥
Structure, not smoke.
See you all tomorrow. 💤
post-image
Trenches
牛逼
牛
bade
b
牛逼
0x96...7777
Market Cap
$.
Change
.
24h Vol
$.
Holders
.
PIEVERSE
P
bade
b
PIEVERSE
0x0e...25a9
Market Cap
$.
Change
.
24h Vol
$.
Holders
.
STONK
S
bade
b
STONK
6GmA...UNgx
Market Cap
$.
Change
.
24h Vol
$.
Holders
.
ON
O
bade
b
ON
0x0e...1d48
Market Cap
$.
Change
.
24h Vol
$.
Holders
.
FLOAT
F
bade
b
FLOAT
Bv1a...BMmr
Market Cap
$.
Change
.
24h Vol
$.
Holders
.
What Is Slippage? Why Might the Stop-Loss Price Differ from the Actual Execution Price?

In cryptocurrency trading, many people believe that setting a stop-loss is enough to keep losses within a predetermined range. But in real markets, the stop-loss trigger price may differ from the final execution price. This difference is called slippage.

First, what is slippage?

Slippage is the difference between the expected execution price and the actual execution price. For a buy order, an actual execution price higher than expected may result in adverse slippage; for a sell order, an actual execution
Faces Repeated Rejection Bearish Pressure Building
RWUSD continues to struggle around the same resistance zone, with sellers repeatedly stepping in to limit upward movement. The inability to break above this area suggests that bearish pressure remains present.

If the rejection continues, further downside could develop. However, a sustained move above resistance would weaken the bearish outlook.

Key figures

$0.9997–$0.9998 — Short-term resistance and rejection zone

$1.0157 — Level that would invalidate the bearish structure

$0.9748 — First downside level

$0.9553 — Second downside level

post-image
RWUSD
RWUSDRWUSD
Four.meme
MC:$3.88KHolders:1
0%
11.10 BTC Public Trade Setup
【Long Trade Setup】$BTC
  Entry range: around 730-737
  Stop-loss: 725
Take-profit levels
  Target 1: 745
  Target 2: 755
Target 3: 762

Factors: Price is below the middle band, the Bollinger Bands are showing signs of narrowing, the moving averages are in a bearish alignment, the 7-day moving average is flattening, and MACD is showing signs of a golden cross below the zero line. A short-term trading range has formed.

Recommendation: Focus on buying near the bottom of the range. CPI data is due tonight, and a one-way move is possible, so use a stop
post-image
BTC-0.65%
Damn, our country has a B-21 stealth bomber now too. It’s pretty similar to the Americans’ $2.5 billion-a-piece one, though ours looks cooler.
Copy trading on Gate.io allows investors to automatically replicate professional managers’ trades with one click. The platform offers a copy trading ecosystem covering both traditional crypto derivatives and global stock markets.

Copy Trading Options on Gate.io

The exchange offers three main tools for automated copy trading:
• Futures copy trading — traditional copying of trades in cryptocurrency contracts using margin and leverage
post-image
☀️ GM! U.S. stocks are recovering, while BTC is still waiting for a signal. ☕
The Nasdaq surged 2.74% overnight, but BTC is still hovering near lows. U.S. October CPI is due tonight at 21:30. 👀

📌 Today’s featured topic: This cup of CPI coffee—do you think it’ll be hot or cold?
🔥 Hot inflation: Will BTC and U.S. stocks come under pressure again?
🧊 Cooling inflation: Can it drive a market rebound?
👀 Trading strategy: Position ahead of time, or wait for the data?

🎁 Share your CPI forecast and trading ideas on Gate Square. Get a red packet reward just for posting, with larger red packets d
post-image
BTC-0.67%
NDAQ+1.29%
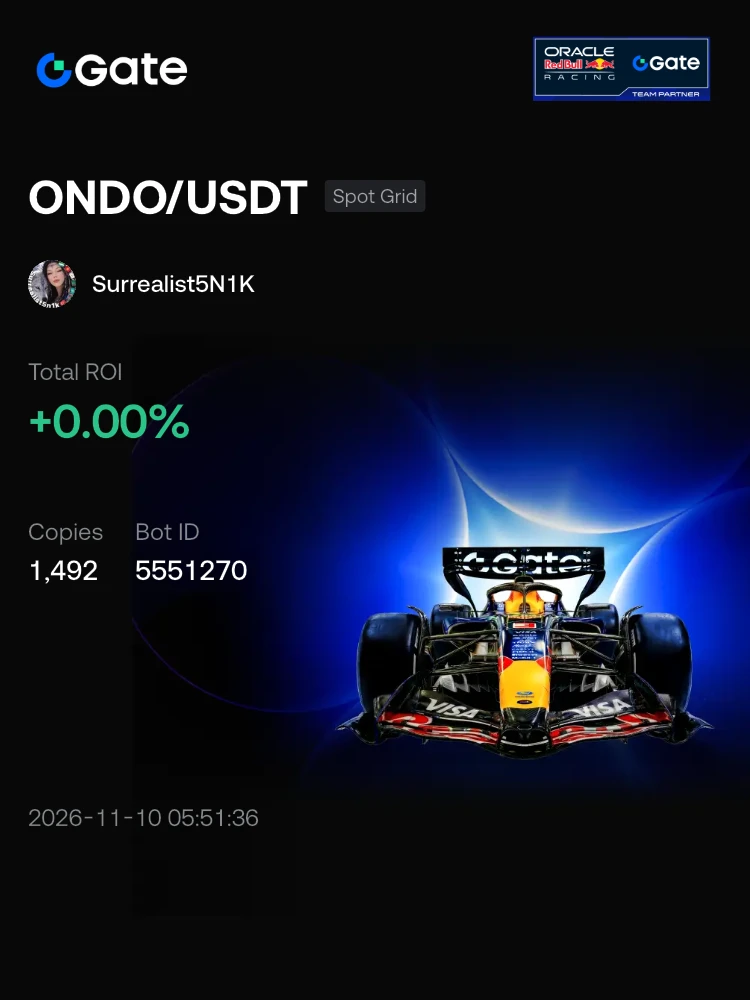
#Bots I'm trading ONDO/USDT with the Spot Grid bot on Gate. Join me!
post-image
ONDO-0.29%
  • 2
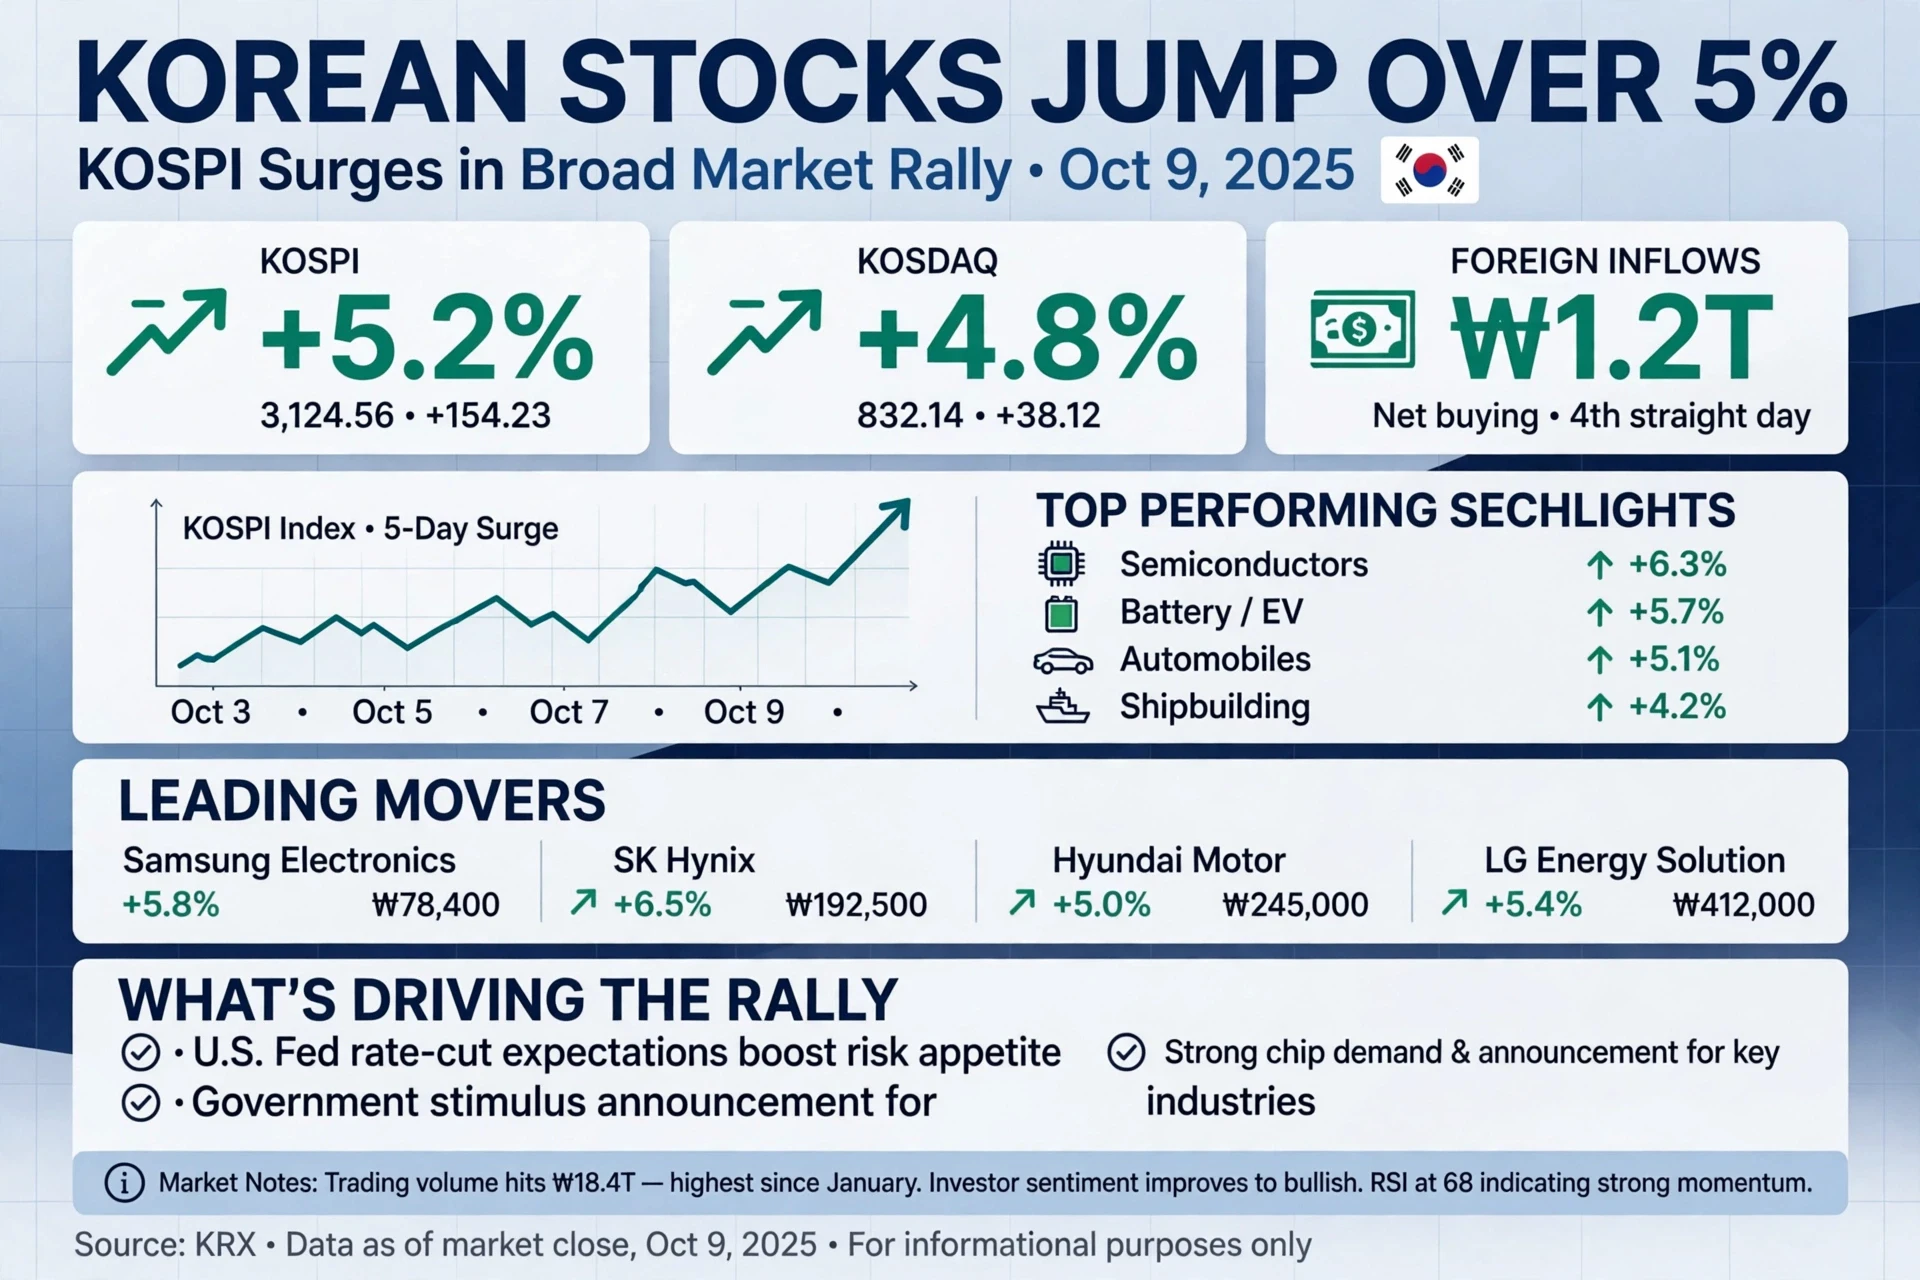
#KoreanStocksJumpOver5% — KOSPI Roars Back in Powerful Broad Rally*

South Korean equities staged a stunning breakout today, with the KOSPI surging *+5.2% to 3,124.56 (+154.23 points)* — its strongest single-day gain since early 2024. KOSDAQ followed with *+4.8% to 832.14*.

The rally was broad-based and volume-backed. Trading volume hit *₩18.4T*, the highest since January, as foreign investors net bought *₩1.2T* for a fourth consecutive day, flipping sentiment to outright bullish.

*Top performing sectors led the charge:*
Semiconductors +6.3%, Battery/EV +5.7%, Automobiles +5.1%, Shipbuilding
post-image
XRP market update
live-cover
LIVE1,788
Solana Morning Trading Strategy

Short
Entry range: 86.40 - 86.70 (enter after a rebound to the Bollinger midline and moving-average resistance zone shows stalling and closes bearish)
Stop-loss: Above 87.00 (a sustained move above the upper band invalidates the short-term bearish outlook)
Targets: 85.90 (lower band) → 85.00

Long
Entry range: 85.80 - 86.00 (near the current lower band; only enter after a clear sign of support, such as a long lower wick or bullish engulfing candle)
Stop-loss: Below 85.50
Targets: 86.50 (midline) → 86.90

Solana plunged through the lower band in a one-way move,
post-image
SOL-0.74%
What Is Slippage? Why Might the Stop-Loss Price Differ from the Actual Execution Price?

In cryptocurrency trading, many people believe that setting a stop-loss will keep losses within a predetermined range. But in real markets, the stop-loss trigger price may differ from the final execution price. This difference is called slippage.

First, what is slippage?

Slippage is the difference between the expected execution price and the actual execution price. For a buy order, an actual execution price higher than expected may result in unfavorable slippage; for a sell order, an actual execution pri
【SOXL】Short · Opening/Entry Coin: SOXL/USDT Direction: 👇👇👇📉 Strategy: Market 📌 Entry Price: 55.80—59.50✔️Profit Targets: 51.00—46.00—39.50❌ Stop-Loss: 63.20
post-image
SOXL-1.16%
I got quite a scare walking down the street today.
I saw a cat’s severed tail right there!
It wasn’t until I got closer that I could see clearly.
I wonder who was so careless 🤣
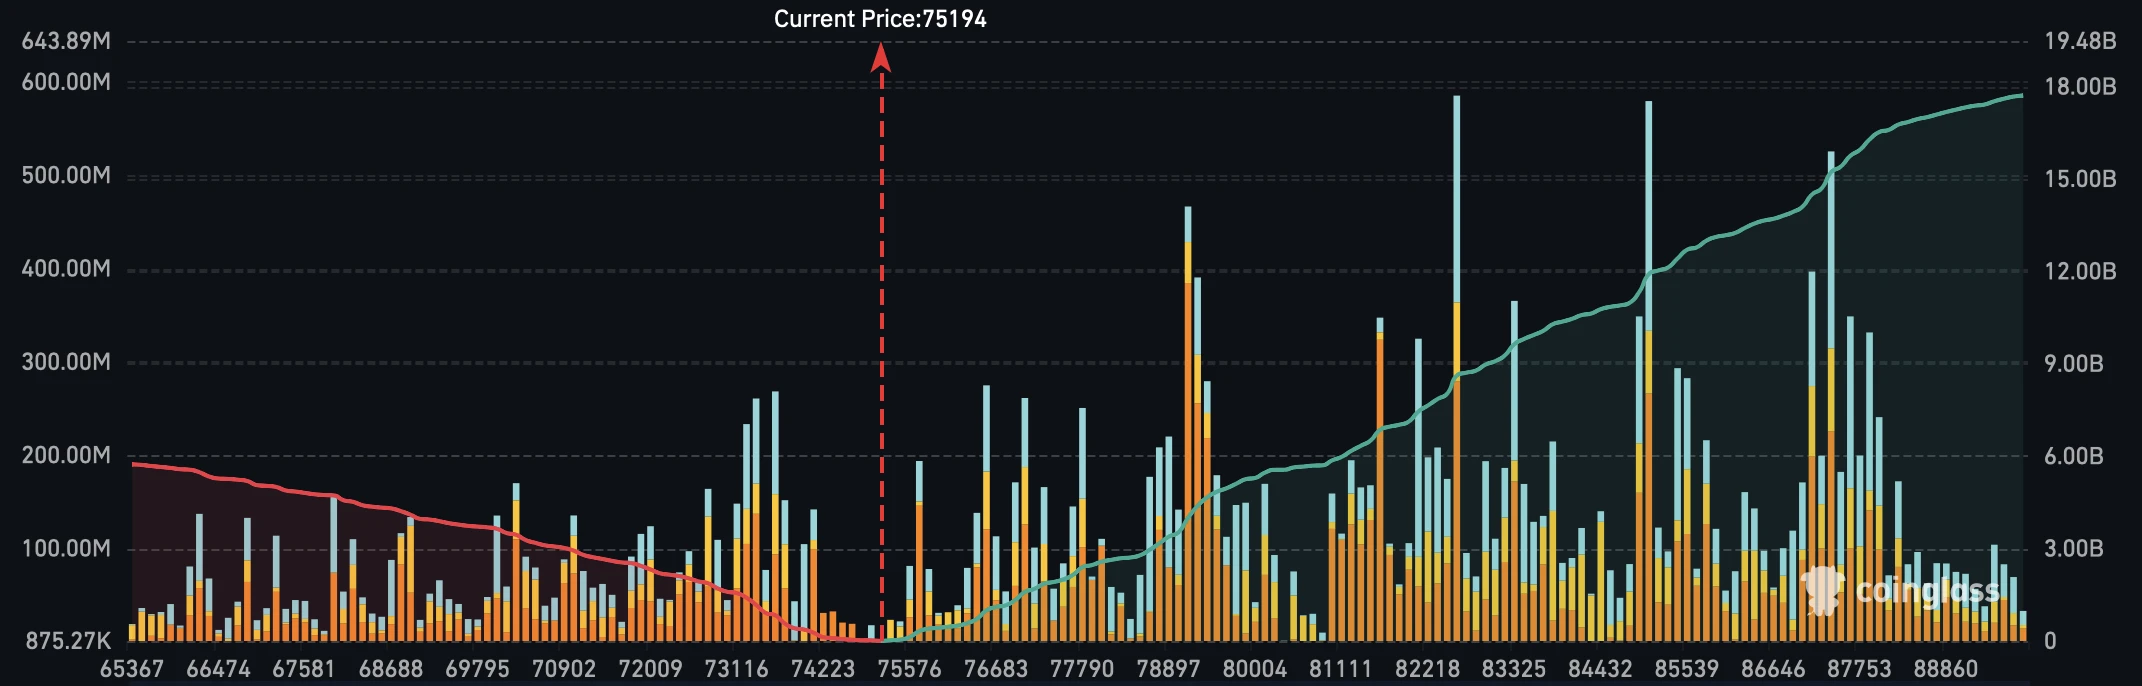
$BTC On the 90D liquidation map, a ±10K move from current price would trigger:

• $5.67B in long liquidations
• $11.89B in short liquidations

That's more than 2x as much short liquidity sitting above price compared to the long liquidity below. Towards the upside, the local target remains 78–79K, where a significant amount of short liquidity is stacked.

Higher.
post-image
BTC-0.67%
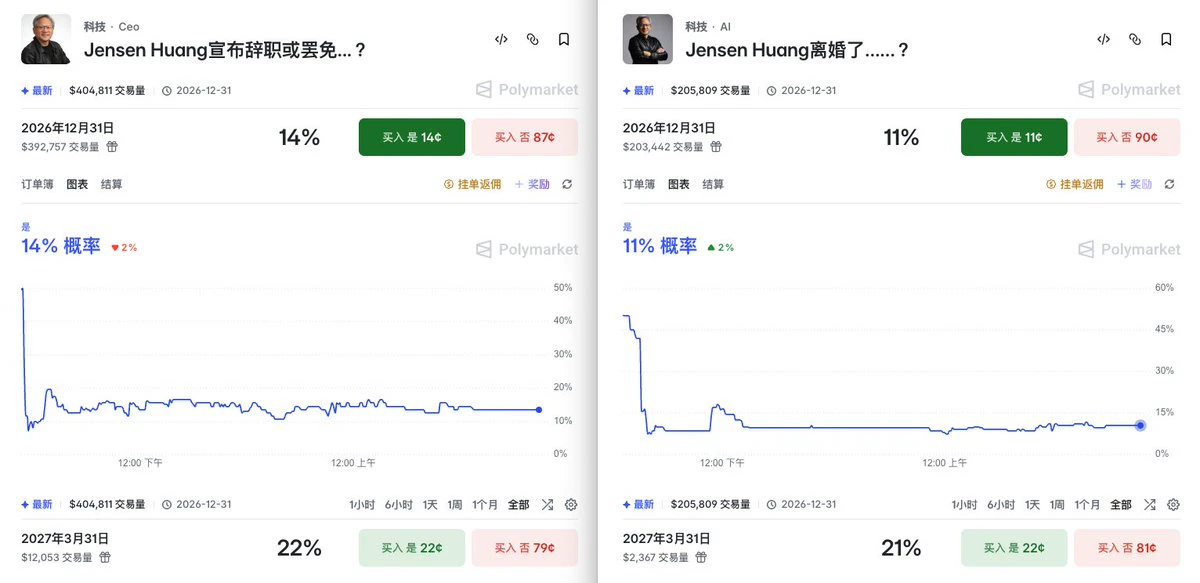
One of the biggest features of crypto is that you can open a market on anything. Everyone’s a fucking degenerate gambler.
The moment the cheating scandal broke, Poly had markets on when Jensen Huang would resign and get divorced, and the trading volume was no small amount.
post-image
Bitcoin Stalls as Stocks Rally Before US Inflation Data
U.S. stocks rose Monday as oil prices fell, with traders pricing in roughly an 80% chance of a December Fed rate hike.
CoinGlass showed $1.2 billion in 24-hour liquidations, including $324 million in Bitcoin positions.
⚠️ Personal market analysis only. NFA — manage risk and DYOR.
Educational content, not investment advice or a recommendation to buy, sell, deposit, or withdraw any asset. No paid promotion or referral/affiliate links.
post-image
BTC-0.65%
Load More

Join 40 M users in our growing community

⚡️ Join 40 M users in the crypto craze discussion

💬 Engage with your favorite top creators

👍 See what interests you

Trending Topics

USCPIDataIncoming

48.32k Views2.17k Discussing

The U.S. October CPI report will be released on November 10 at 8:30 a.m. ET. September CPI came in at 3.7% year over year, and markets will be watching closely for signs that inflation is cooling, especially in core CPI. A softer-than-expected reading could strengthen rate-cut expectations, while hotter inflation may pressure risk assets through higher Treasury yields and a stronger dollar. How do you think this CPI print will move $BTC, U.S. stocks and gold?

USIranTalksShowNewProgress

5.03k Views1.23k Discussing

KoreanStocksJumpOver5%

569 Views4.81k Discussing

View More