Square
Following
Hot
News
Profile
Share your thoughts
placeholder
Article
Why is big money watching the PPI rather than the CPI?
CPI is a statement of fact (what people have already overpaid for in stores). PPI is a look into the future (what costs businesses are bearing now). If raw materials and production become more expensive, producers will inevitably pass these costs on to end consumers within 1–2 months.
Conclusion: High PPI today guarantees high CPI tomorrow. Major players reduce risks based specifically on PPI, without waiting for consumer reports.
#USCPISoon #ShareWeekly
Funding rates are negative, yet open interest is surging? This GTC rebound is about to leave shorts roasted! Long. Trading parameters: Entry: 0.19801 - 0.20013Target 1: 0.2100Target 2: 0.2187Exit: 0.19207Start trading from here. The coins I’m watching today include $ZEC and $SIREN .
post-image
GTC
GTC芝麻币
Gate.Fun
MC:$0.1Holders:1
0%
ZEC+7.81%
SIREN+3.31%
Gold has climbed back above 4150, while silver is hovering around 57. The dollar has weakened, and Treasury yields have pulled back a bit too.
But don’t celebrate too soon. Oil prices are still rising, and inflation hasn’t gone anywhere. This rebound looks more like a breather than a turnaround.
What I’m watching is whether gold can hold above 4150 if oil surges again next week.
If you see it differently, tell me why.
post-image
GLDX+1.74%
PAXG+1.47%
Bitcoin Support and Resistance Levels
live-cover
LIVE1,025
SHILL ME THE #TICKER 👀
I NEED THE NEXT 100X MEMECOIN
post-image
MEME+0.97%
SANDISK $SNDK REJECTING MOVING AVERAGE RESISTANCE ARE BEARS TARGETING $1,272.23 NEXT?
Trade Parameters

Pair: $SNDK /USDT
Direction: SHORT
Entry Price: 1,347.86
Target Levels (Take Profit)
🎯 TP 1: 1,302.48 3.37%
🎯 TP 2: 1,272.23 5.61%
Stop Loss
SL: 1,408.36
Technical Breakdown
SNDK ($1,348.19) faced strong rejection following an aggressive upward push, printing a topping wick that stalled out right at structural resistance. This price action confirms persistent seller defense and sets up a clean continuation toward lower targets.
Price action tested areas above short-term moving ave
SNDK+0.12%
The answer is always hidden in the process that time brings. I’ve already made it extremely clear—the hints have been laid out plainly. Since June, it has felt exactly like hitting whatever I aim at and winning every battle; there’s only one word for it: “awesome”!
$BTC #美国9月CPI超预期
BTC+0.59%
Bitcoin Shakes Off Spooky Season Jitters: Can Bulls Keep It Going?
Bitcoin is trading at $83,591.79, up 2.24% on the day, after dipping to $80,953.41 earlier Tuesday. That low held about $588 above the $80,365.12 swing low that kicked off the bounce, a higher low that traders look for in an uptrend.
The Crypto Fear and Greed Index, a 0-to-100 sentiment gauge built from momentum, volatility, options positioning and social data, sits at 55 today, a neutral reading. It fell from an "extreme greed" peak of 82 on Aug. 26. The August euphoria is gone, but traders aren't panicking either.
⚠️ Personal
post-image
BTC+0.60%
  • 1
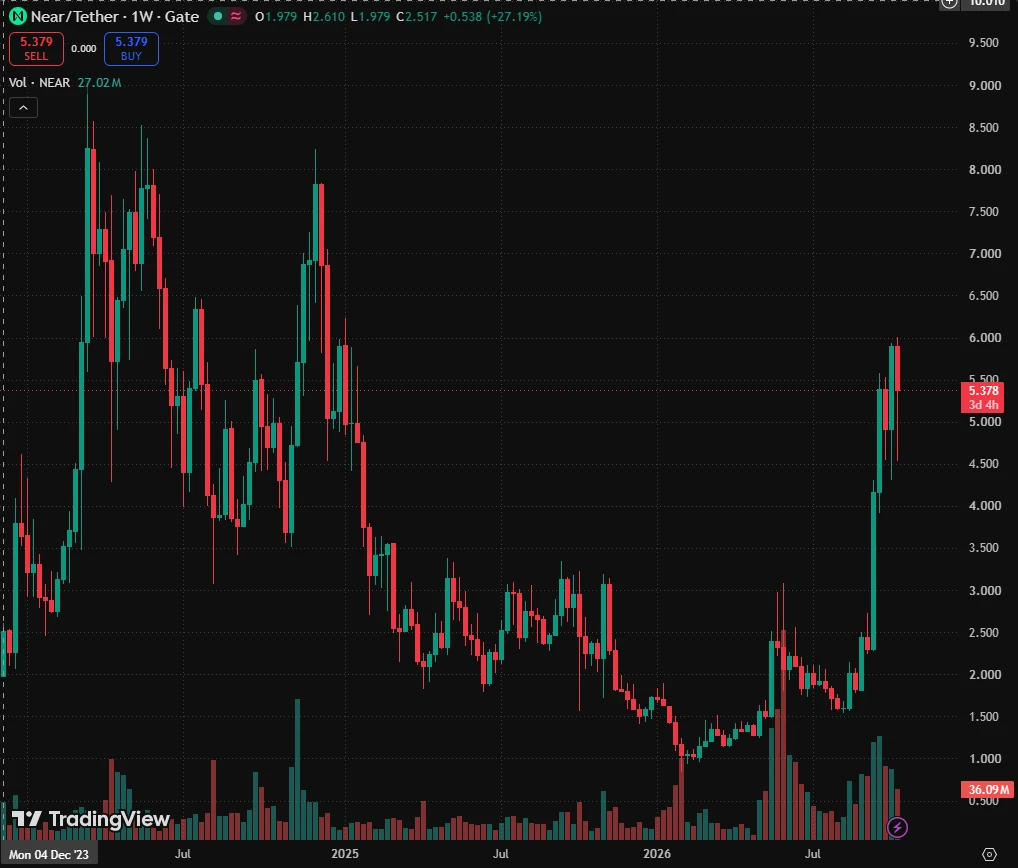
$NEAR NEAR Breaks Out of a 4-Year Descending Channel: TP1: $11
NEARUSDT
Weekly Time Frame:
NEAR (1W, log scale) is breaking out of the descending channel that has defined price action since the 2022 top, and the weekly candle is now pushing above the upper boundary.
What the chart shows:
After the 2022 high (~20.6), price spent years in a descending channel, bottoming around the 0.9 area in early 2026.
Since that low, price has risen sharply and is now trading at ~5.4, above the channel’s upper trendline.
The breakout is happening at the 2024 volume profile POC (~5.2), so the trendline and a h
post-image
NEAR+11.14%
🧑‍🍳 I touch crazy to get something done…and we all become friends 🫢
$INJ ‌ has flipped the momentum, and buyers are back in control.
After dipping to $7.061, INJ has rallied to $8.56, reclaiming key levels with a strong hourly breakout. The Supertrend has turned bullish at $7.81, adding strength to the setup.
Key levels:
Support: $8.25–$8.30
Stronger support: $7.80–$7.95
Resistance: $8.56–$8.63
Targets: $8.80 → $9.00
A clean break above $8.56 could extend the move, while holding above $8.25 would keep the recovery structure healthy. After this sharp rally, a retest would be constructive.
INJ is looking stronger. Now it needs to turn this breakout into sustai
INJ+11.40%
NVDA-1.92%
  • 2
🔹Whale Dumps BTC and Loads Up on ETH! After selling 237.8 BTC and buying 7,929 ETH, is big money be
live-cover
LIVE2,126
• Stages of investor acceptance after Fed news
• The point: Show in one paragraph how a crypto investor's thoughts change over the course of one day:
1. 12:29 UTC — “Well, that’s it, PPI will come in line with forecasts, we’re flying to $100k!” 🚀
2. 12:31 UTC — “Okay, PPI is higher than expected... But that’s good for BTC as a safe-haven asset, right?” 🫡
3. 13:00 UTC — “Well, a sausage factory is always looking for new employees” 🏭
#USCPISoon #ShareWeekly
BTC+0.60%
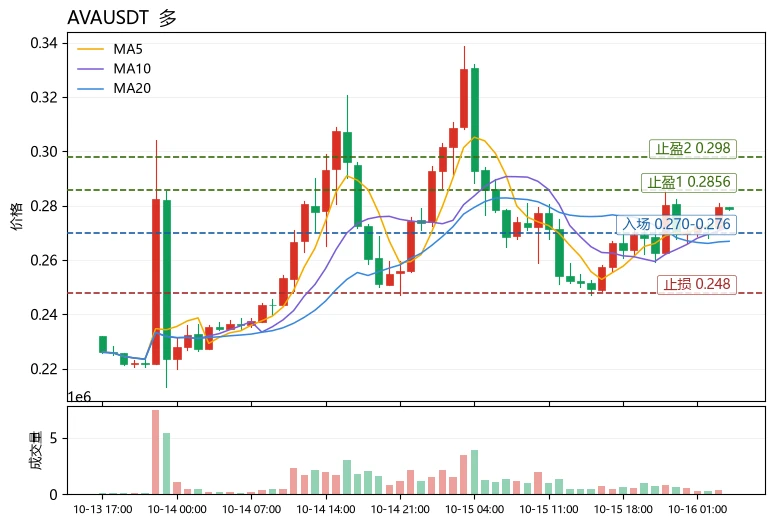
Many people reflexively buy the dip as soon as they see a 15% drop in 24 hours, while ignoring broader market sentiment and sector correlation—this is the most typical trading misconception. The Fear and Greed Index is 53, neutral but leaning cautious. There has been neither panic selling nor greedy capital stepping in, so looking at a coin’s decline in isolation is meaningless at this point.
$AV Down 15.18% today, with a trading volume of only 6.2M USDT, a typical low-volume sharp drop. However, the technicals have not deteriorated: MA5=0.27448 remains above MA20=0.26686, so the medium-term
post-image
XPL+8.96%
Bruh over 100+ degens showed up & turned up in Phuket tonight 🌴✈️🇹🇭🌎
Appreciate all the homies flying in sponsors supporting & the hosts for a smooth night 👌
We just getting started 😈
post-image
$JASMY coin looks like it is back to pumping vibes.
The recent drop now looks like it was just a backtest of the main support zone, From here a quick 5 wave structure looks like the trajectory in the short term.
JASMY+2.52%
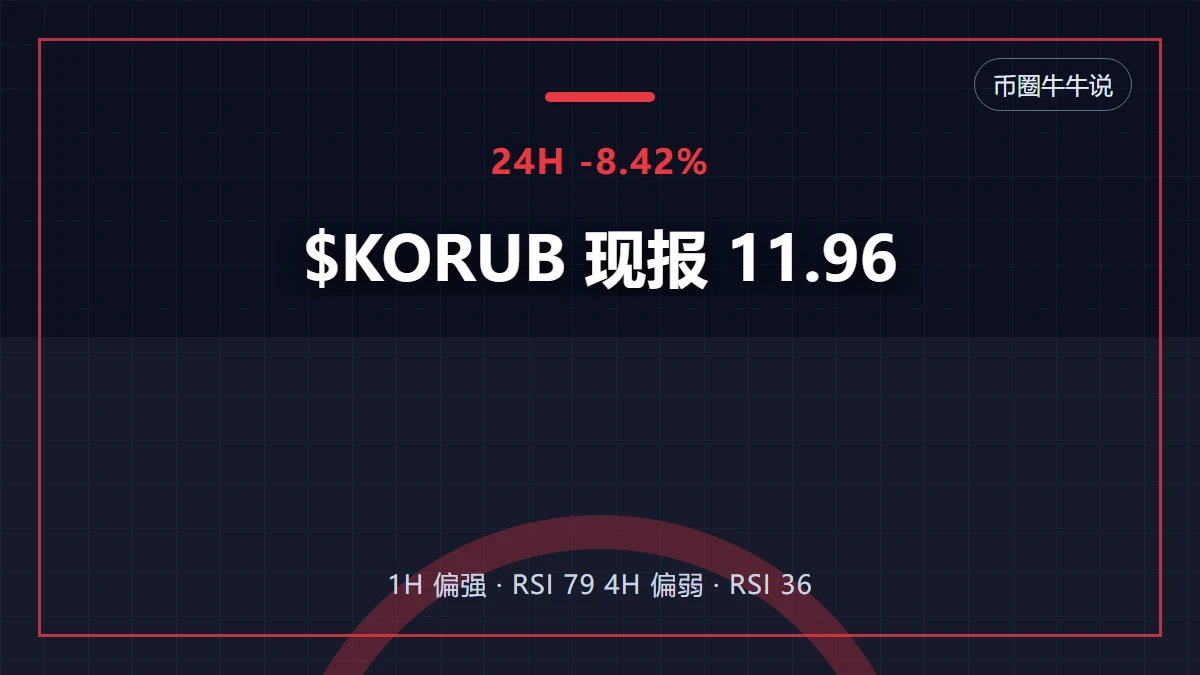
If I could leave only one note for $KORUB today, it would be: don’t let -8.42% make the decision for you.
What is really worth discussing is that $KORUB moved first on the 1-hour chart, while the 4-hour chart still hasn’t acknowledged it. $KORUB is currently at 11.96, down -8.42% over 24 hours. The 1-hour support is 10.07, resistance is 12.99, and current volume is 0.18 times the average volume of the past 20 candles.
The 1-hour trend is relatively strong, with RSI at 79; the 4-hour trend is relatively weak, with RSI at 36. This combination makes me temporarily accept the following interpreta
post-image
As Bitcoin attempts to hold its ground at the $82,400 level, the market is simultaneously navigating a heavy flow of macroeconomic data. Over the past 24 hours, the price dipped to as low as $79,795 before recovering to test the $82,630 mark. This movement cannot be attributed to a single factor; rather, several distinct pressures have come into play at once.
PPI surprise and interest rate expectations
The Producer Price Index (PPI) data released in the U.S. for September came in significantly higher than anticipated. On an annual basis, the PPI rose by 6.3%, reaching its highest level in four
post-image
BTC+0.60%
GT-0.09%
ETH+1.62%
SOL+1.92%
XRP+1.33%
  • 6
  • 2
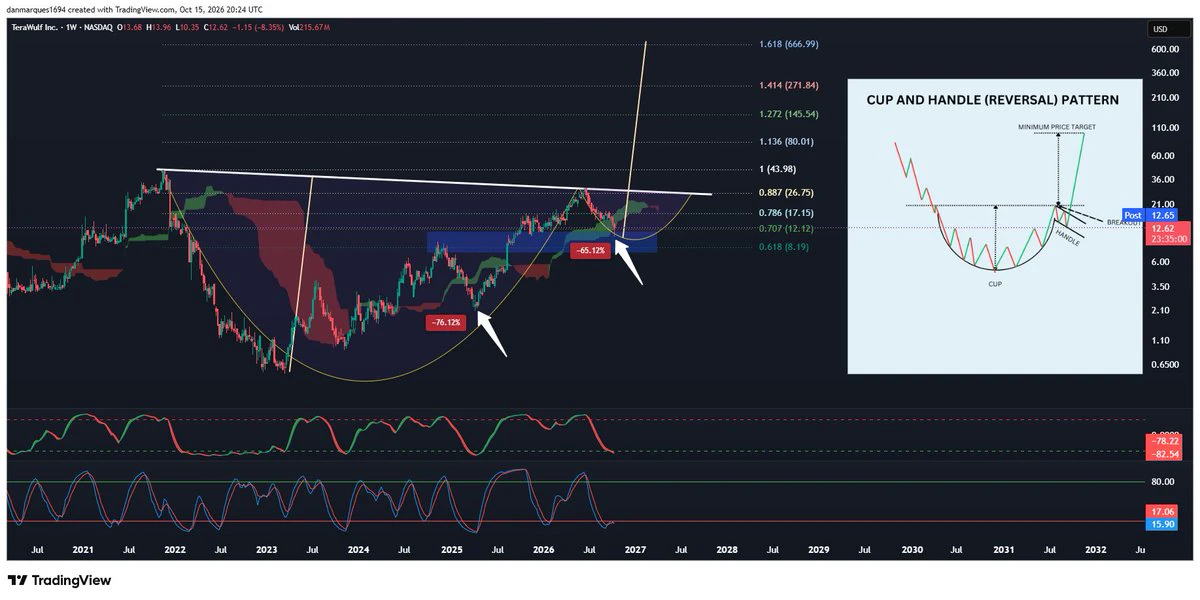
$WULF had an intraday recovery of +20% which is pretty significant. It was down -65% from its high of $29 at some point today which still isn't as bad as the pullback in April 2025 where it saw -75% drawdown, but I'd say the sentiment in the space was just as bad
It almost seems irresponsible to show this chart. But it's currently forming a handle in this cup & handle pattern.
I don't make the fibs either, price currently found support around the 0.707 fib and if we get back above 0.786 and 0.887 fib then the upside targets could get wild. I don't see them happening anytime soon. For no I'd e
post-image
WULF+9.27%
In 2006, I went online for the first time and casually bought 1,000 Bitcoin.
Back then, Bitcoin was worthless, so I just treated it like in-game currency.
post-image
BTC+0.60%
Load More

Join 40 M users in our growing community

⚡️ Join 40 M users in the crypto craze discussion

💬 Engage with your favorite top creators

👍 See what interests you

Trending Topics

USSeptemberPPIBeatsExpectations

91.35k Views1.87k Discussing

US September PPI came in at 6.3% YoY, well above the 5.3% market expectation, pointing to renewed producer-side inflation pressure. Weekly jobless claims were 199K, broadly in line with forecasts. Could hotter inflation further reduce room for rate cuts, and what does it mean for $BTC, US stocks, and gold?

DrLinHanSpeaksAtOxfordUnion

135.63k Views1.86k Discussing

JapanAndKoreaStocksPlunge

47.27k Views1.76k Discussing

View More