

Share your thoughts
placeholder
Article
Never FOMO...
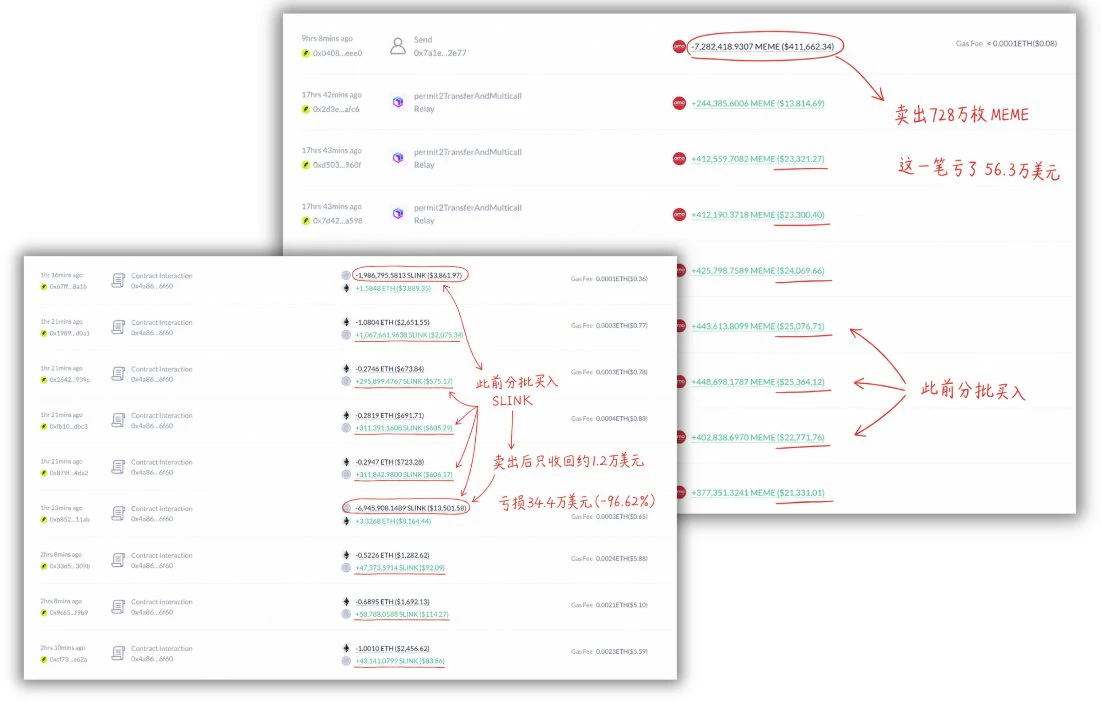
A trader chased the pump twice in one day today, losing more than $900,000.
It started when he saw MEME suddenly surge and chased in with $916,500, buying 7.28 million tokens at an average price of $0.126.
But after he bought, MEME quickly began to retreat, so he sold his entire position, recovering only $353,000 and losing $563,000 on the first trade.
However, this loss did not make him stop trading.
After selling MEME, he immediately redirected almost all of the recovered funds into another token, SLINK, which was rising, spending $356,000 to buy 8.93 million tokens at an avera
post-image
MEME+4.84%
The market is leaning slightly toward a September Fed hike again, but I am still taking the opposite side of that trade: no hike.
The reason is not blind optimism.
It is probability.
After Warsh's hawkish Jackson Hole message, rate-hike expectations briefly jumped toward 65%–68%. Then Waller challenged the more aggressive interpretation on September 4, pushing those expectations back toward 50%. Today's August payrolls came in at 162K, far above the roughly 55K consensus, sending hike expectations back toward approximately 57%.
So yes, the market currently has a modest hawkish tilt.
But it is
NFP-4.26%
  • 1
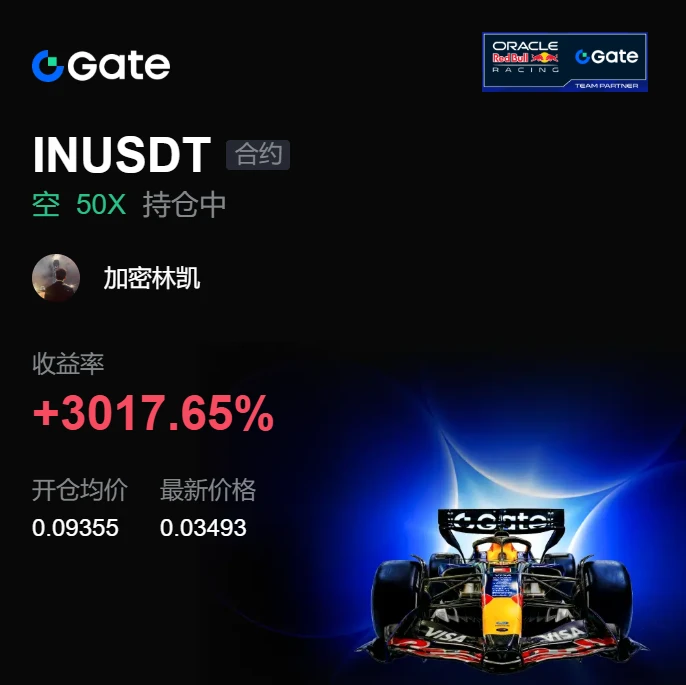
#Gate事件合约晒单挑战
GT BREAKS ABOVE $9
GT has entered a much more important technical zone after breaking through the $9 psychological level. With GT trading around $9.15, the token is now holding above a level that previously acted as a major resistance reference. The key question is no longer whether GT can reach $9 it is whether buyers can turn $9 into sustainable support and build the next leg higher.
THE BREAKOUT STRUCTURE
The move from the recent $8 area toward $9+ represents a strong short-term expansion. Recent market data shows GT previously reached around $8.65 before pulling back, while
post-image
GateSquare
🔥 Gate Square Event Contract Screenshot Challenge Starts Today!
Confident in the market? Don’t just place orders—show off your analysis too 👇
Post your market view with #Gate事件合约晒单挑战 , or share screenshots of your positions, trades, or settlements after completing a transaction to participate!
🎁 The first valid screenshot post wins a 5 USDT fee cashback voucher
🛡️ New users can receive compensation of up to 5 USDT for losses on their first order
🏆 15 users win USDT, trial coupons, and official traffic support every day
🍀 Post your first entry today, then participate for 3 cumulative days for a chance to win 10 USDT
👉 Participate now: https://www.gate.com/campaigns/6081
📄 Event details: https://www.gate.com/announcements/article/101442

repost-content-media
GT+6.85%
  • 4
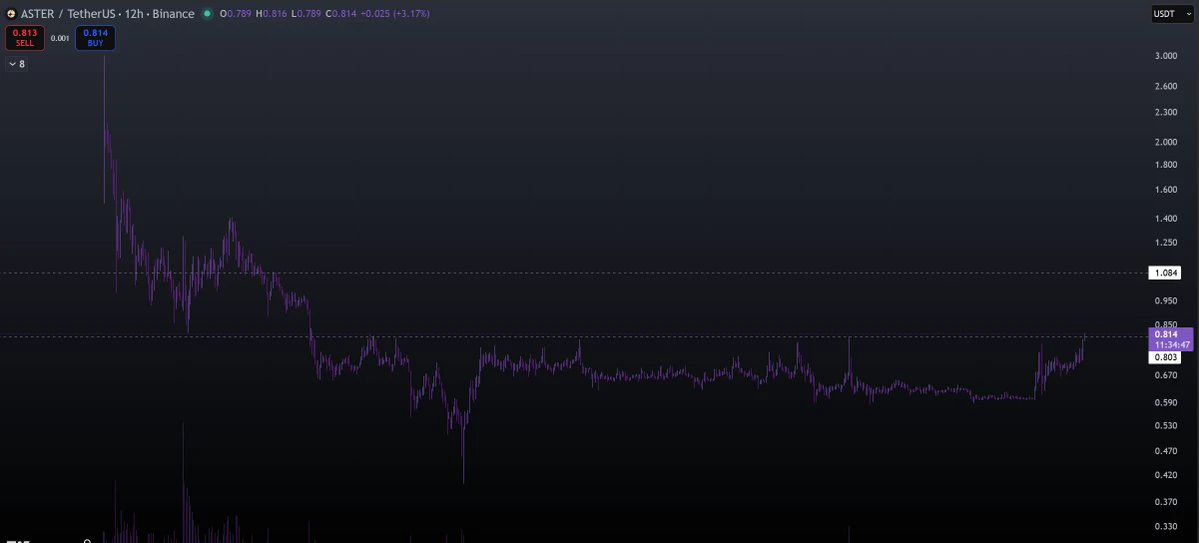
It seems one of the boring coins aster-2:native broke out.
And when boring becomes interesting, then it gets very very interesting.
post-image
ASTER+8.02%
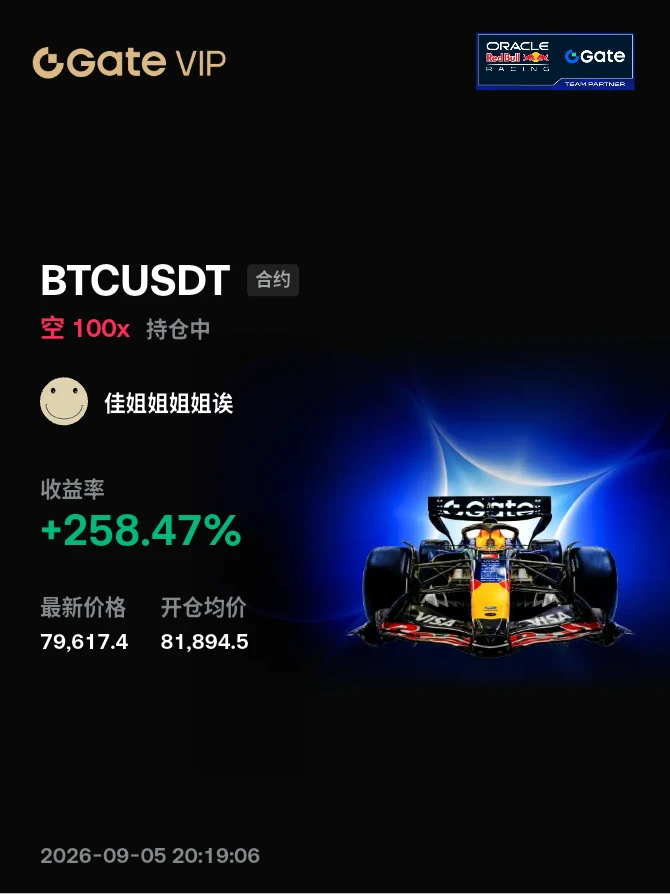
#晒出我的持仓收益 Fucking hell, it's stuck sideways!!! The market's not cooperating.
post-image
Most traders think $SLX /USDT is breaking out—the 4h chart says they’re about to get squeezed.

$SLX /USDT - SHORT

Trade Plan:
Entry: 0.07001 – 0.07035
SL: 0.07181
TP1: 0.06896
TP2: 0.06814
TP3: 0.06692

Why this setup?
Why now? The 1D trend is locked in a range, and our 4h bias is SHORT with 55% confidence—not a coin flip, but a lean. RSI on the 15m sits at 45, meaning no oversold bounce fuel left. Entry at 0.07018 with TP1 at 0.06896 (a 1.7% drop) is the first exit before the real meat at TP2 (0.06814). If price slips below 0.06946, the setup is invalidated—so we’re not married to the tr
SLX+0.33%
Everyone’s staring at DOGE at 0.0861—but the 4h chart just whispered a secret most retail missed.

$DOGE /USDT - SHORT

Trade Plan:
Entry: 0.0859 – 0.0863
SL: 0.0876
TP1: 0.0850
TP2: 0.0843
TP3: 0.0832

Why this setup?
- 1D trend is *range*, not breakout—so bulls are renting, not owning.
- RSI on 15m at 57.6 is cooling off a local pump, giving sellers a clean re-entry window.
- ATR (0.000608) says volatility is compressed—when that snaps, it snaps fast.
- Short bias at 55% conviction means the path of least resistance is down to TP1 (0.0850) before TP2 (0.0843).
- Why now? The 4h st
DOGE-1.66%
Everyone’s watching gold’s breakout—but the 4h chart just flashed a quiet SHORT signal that most retail missed.

$XAU /USDT - SHORT

Trade Plan:
Entry: 4433.66 – 4438.72
SL: 4460.50
TP1: 4417.96
TP2: 4405.80
TP3: 4387.56

Why this setup?
- $XAU /USDT is sitting at 4436.19 with a **range-bound 1D trend**—no momentum to chase longs.
- RSI on 15m is neutral (49.95), but the 4h structure favors downside mean-reversion.
- TP1 at 4417.96 is only 0.4% away; TP2 at 4405.80 is the real magnet if 4433.66 breaks.
- ATR (1h) at 10.13 means we have room to breathe, but the invalid zone is tight at
XAU-0.76%
No trades, no analysis, just sheer luck—this track record is embarrassing even to talk about. 😂
When the screen was full of green, I was unusually calm. The rebound looked lively, but the buying support below was clearly weak. Selling came wave after wave, and a rise without enough support is ultimately just a paper tiger. The order I placed before bed a few days ago was filled by the time I woke up. Solid. With the entry positioned well, I could even sleep soundly.
Don’t let profits inflate your ego, and don’t despair over a pullback. I’d rather miss a limit-up move than catch a falling knif
post-image
XRP-3.04%
ADA-3.48%
crypto market prediction
live-cover
LIVE659
9.5 ETH Analysis
ETH rose sharply on the one-hour chart before turning lower, with the current price constrained by resistance from the moving average at the Bollinger middle band. This is a weak rebound within a downtrend, not a trend reversal. RSI has not formed a valid reversal, while MACD shows an apparent bullish divergence, representing an impulsive correction during the decline. 2458.90 above forms a supply-zone resistance level; if bulls fail to complete a pullback confirmation, the rebound space will be limited. 2445.32 below is the intraday liquidity support level. Once it breaks dow
post-image
BTC-1.81%
GT+6.85%
BTC update
live-cover
LIVE1,643
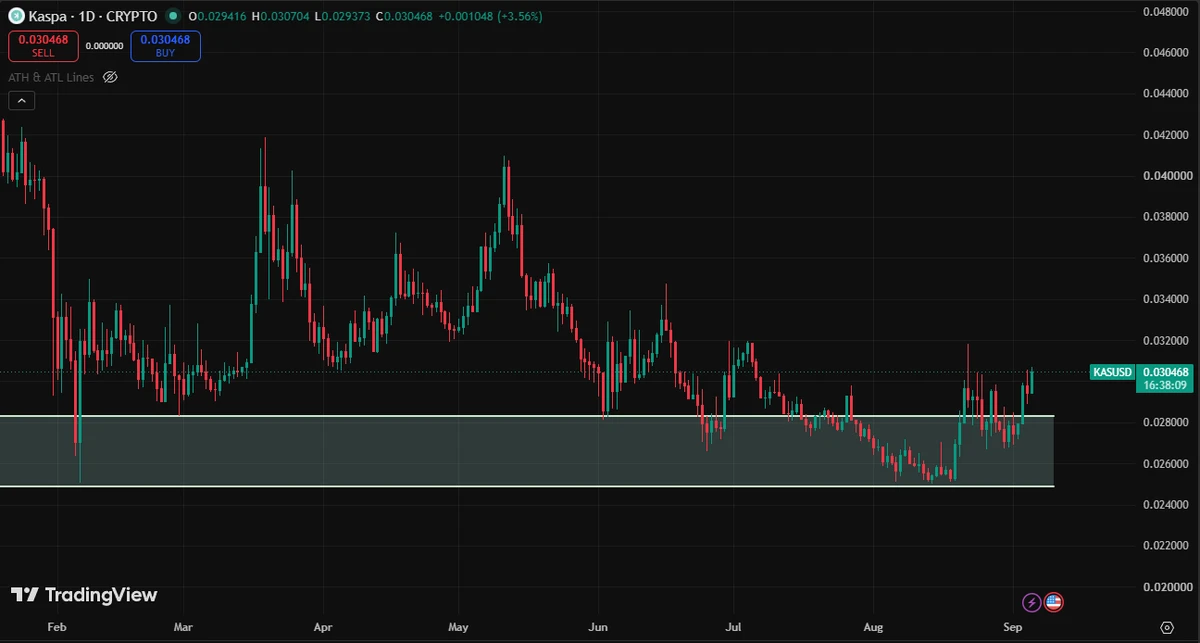
The $KAS train has officially left town, are you ready for its huge comeback?
$0.03 line reached and the chart looks turbo-bullish
$0.04 is next in line 👀
post-image
KAS-0.36%
⚡ TSLAX/USDT Technical Breakdown: Healthy Retracement or Trend Reversal? 📉📈
Tesla xStock (TSLAX) is currently trading around the $355.30 mark on Gate.io, experiencing a short-term cooldown after an impressive rally. Let’s dive into the charts to see what the moving averages and momentum indicators are telling us across multiple timeframes.
📅 Daily Timeframe (1D) :
The Macro View
Taking a step back on the daily chart, TSLAX has shown incredible resilience. After bottoming out near $294 in late July, the asset staged a massive recovery.
TSLA-5.96%
SPCX-1.19%
  • 6
  • 1
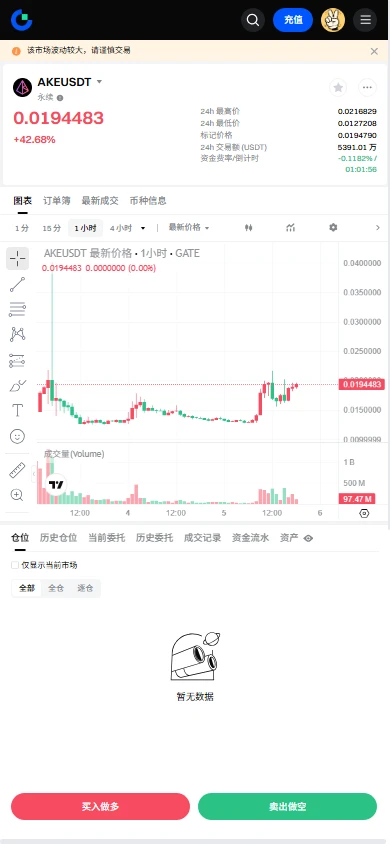
$AKE Signal】Long + negative funding rate short squeeze structure
$AKE Funding rate -0.1425%, shorts continue to pay. The 1H MACD histogram is 0.0004, with long momentum showing no signs of weakening. Sell-side order book depth is more than 3 times that of buy orders, while the price remains firmly around 0.0194.
🎯Direction: Long
⚡Entry/limit order: 0.01939065 - 0.01944900
🛑Stop-loss: 0.01847655
🚀Target 1: 0.02090768
🚀Target 2: 0.02163701
🛡️Trade management:
- Execution strategy: Reduce the position by 50% after reaching Target 1, and move the stop-loss up to breakeven. If the price falls
post-image
AKE+38.59%
BTC-1.81%
ETH-2.55%
SOL-1.51%
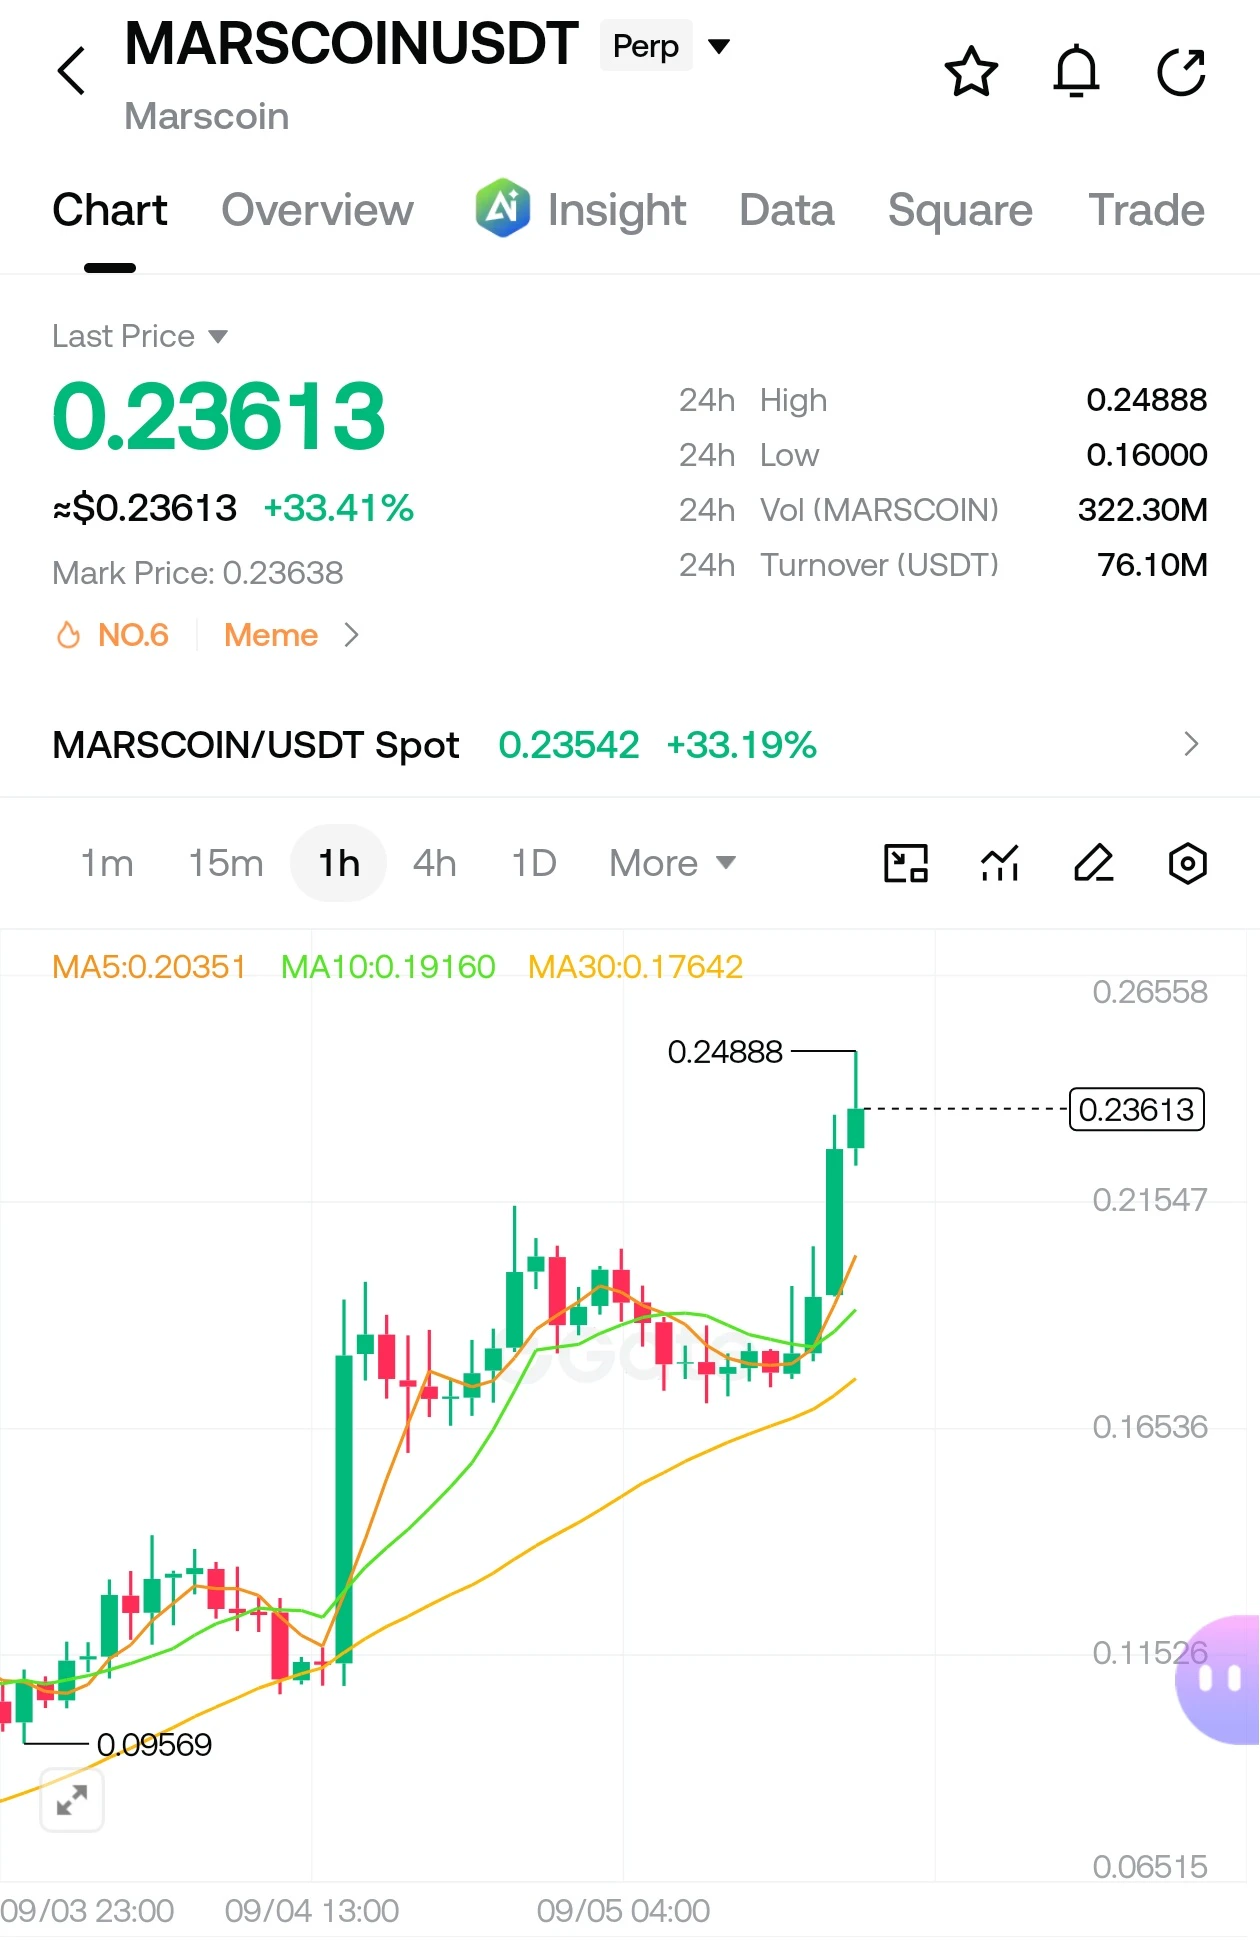
$MARSCOIN MARSCOIN/USDT
Direction: 🟢 LONG
Entry: 0.2300 – 0.2340
TP1: 0.2450
TP2: 0.2550
TP3: 0.2650
SL: 0.2180
Confidence: 82%
⚠️ Price already pumped hard, so don’t chase above 0.2400. Better entry is on a small pullback/retest.
post-image
MARSCOIN+32.90%
$BTC
Direction: Long
Entry: 79500-78200
Stop loss: 77500
Take profit: 80200-81000-81700
Flexible entry, no need to time it precisely; it is currently a very short-term, narrow-range consolidation. Pay attention to protecting the cost basis.💰 ‌
post-image
BTC-1.82%
wtf 🤣 #BSC
#我踏马来了USDT #I'm fucking here
I'm fucking here
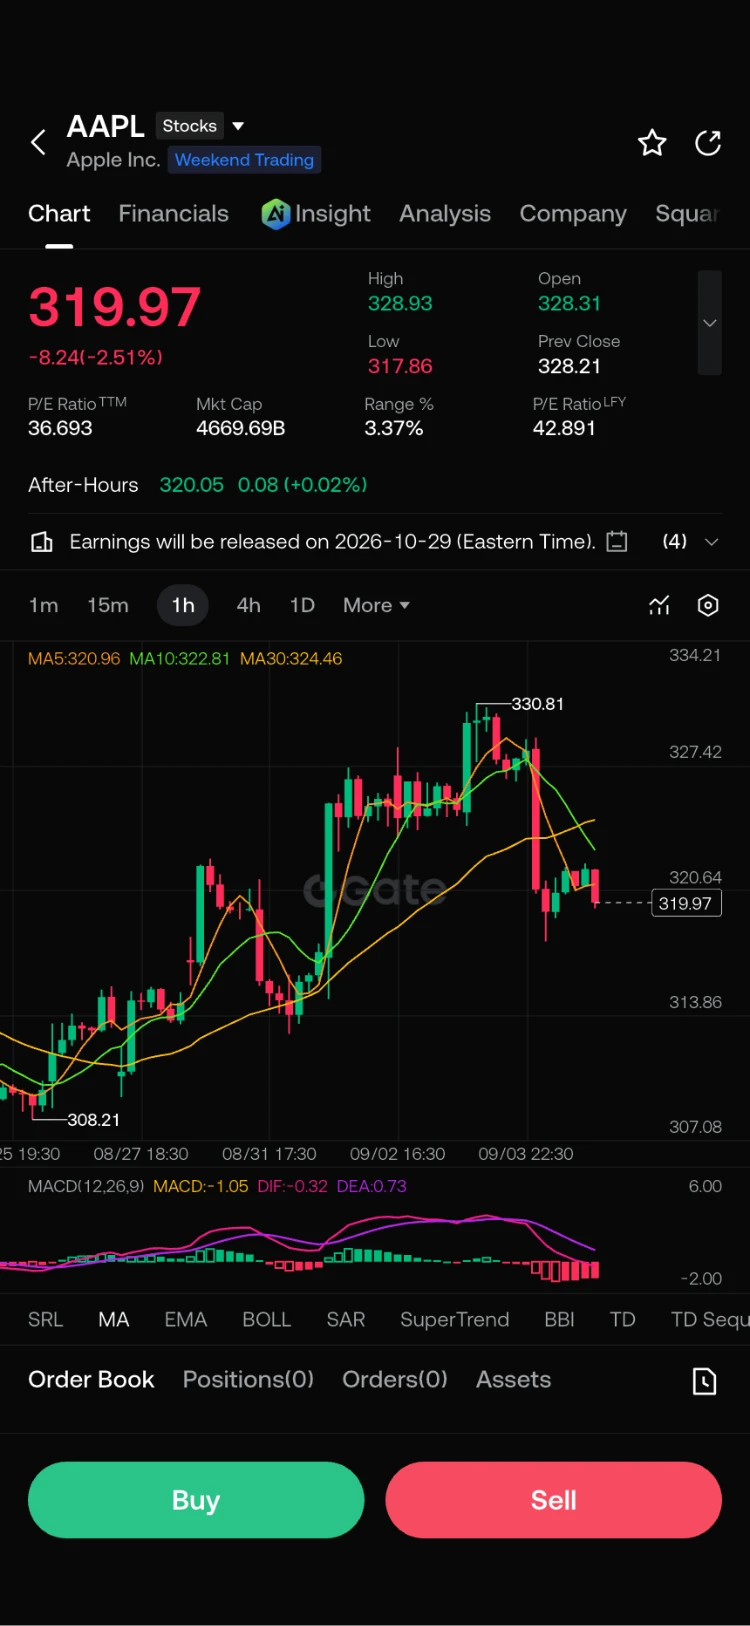
$AAPL remains a key stock to watch as market momentum develops. 📈 #STOCKS
post-image
AAPL-2.51%
Why has middle-class favorite Lululemon suddenly taken such a huge hit?
Its stock plunged 20% over the past few days, with guidance for the sell-off proving to be a complete bombshell $LULU
The data says it all: second-quarter revenue came in at $2.42 billion, down 4% year over year, while global same-store sales plunged 9%, with the North American market suffering an even steeper 12% decline. Most seriously, the company lowered its full-year revenue forecast to $10.35 billion–$10.5 billion, while third-quarter revenue is expected to plunge 10% to 11% year over year. Sales of its core yoga pa
post-image
LULU-17.39%
GAP+0.40%
NKE-0.86%
Load More

Join 40 M users in our growing community

⚡️ Join 40 M users in the crypto craze discussion

💬 Engage with your favorite top creators

👍 See what interests you

View More