




Square
Following
Hot
News
Profile
Share your thoughts
placeholder
Article
Which #MemeCoin will do a 100X in 2026?
post-image
MEME-1.19%
MEMECOIN-9.67%
I think we're overlooking how much of the current negative sentiment could be coming from the sheer number of new people trading with leverage.
The nonstop promotion of perp DEXs, trading incentives and farming opportunities has created an environment where people feel increasingly pressured to participate, often without properly understanding the risks involved.
Most people simply don't know how to manage leverage, yet we're proudly throwing them into the fire and calling it growth.
I suspect this has contributed to sentiment deteriorating far more than the market itself would suggest. A rela
post-image
SOXL-1.13%
Trenches
AGT
A
bade
b
AGT
0x5d...e274
Market Cap
$.
Change
.
24h Vol
$.
Holders
.
CNPY
C
bade
b
CNPY
0xc6...ddd2
Market Cap
$.
Change
.
24h Vol
$.
Holders
.
FOLIO
F
bade
b
FOLIO
0x5f...e411
Market Cap
$
Change
.
24h Vol
$.
Holders
.
Q
Q
bade
b
Q
0xc0...0589
Market Cap
$.
Change
.
24h Vol
$.
Holders
.
FTR
F
bade
b
FTR
DFMt...pump
Market Cap
$.
Change
.
24h Vol
$.
Holders
.
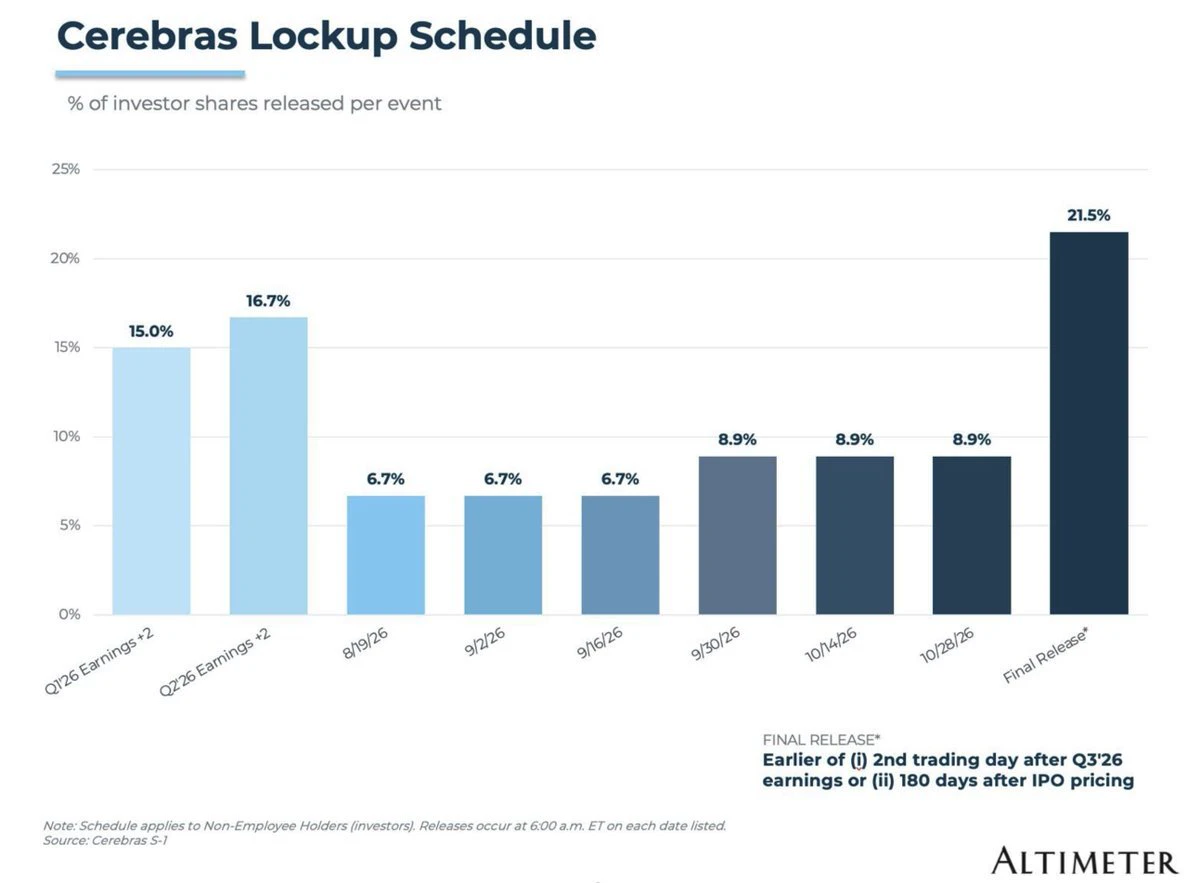
$CBRS lockups still have a way to go
I wonder how much selling we'll actually see. It'll be an interesting signal
post-image
CBRS-10.51%
US producer prices rose 6.3% in the 12 months to September, the fastest pace since December 2022. The Fed, which raised rates in September for the first time since July 2023, meets again on Oct 27-28.
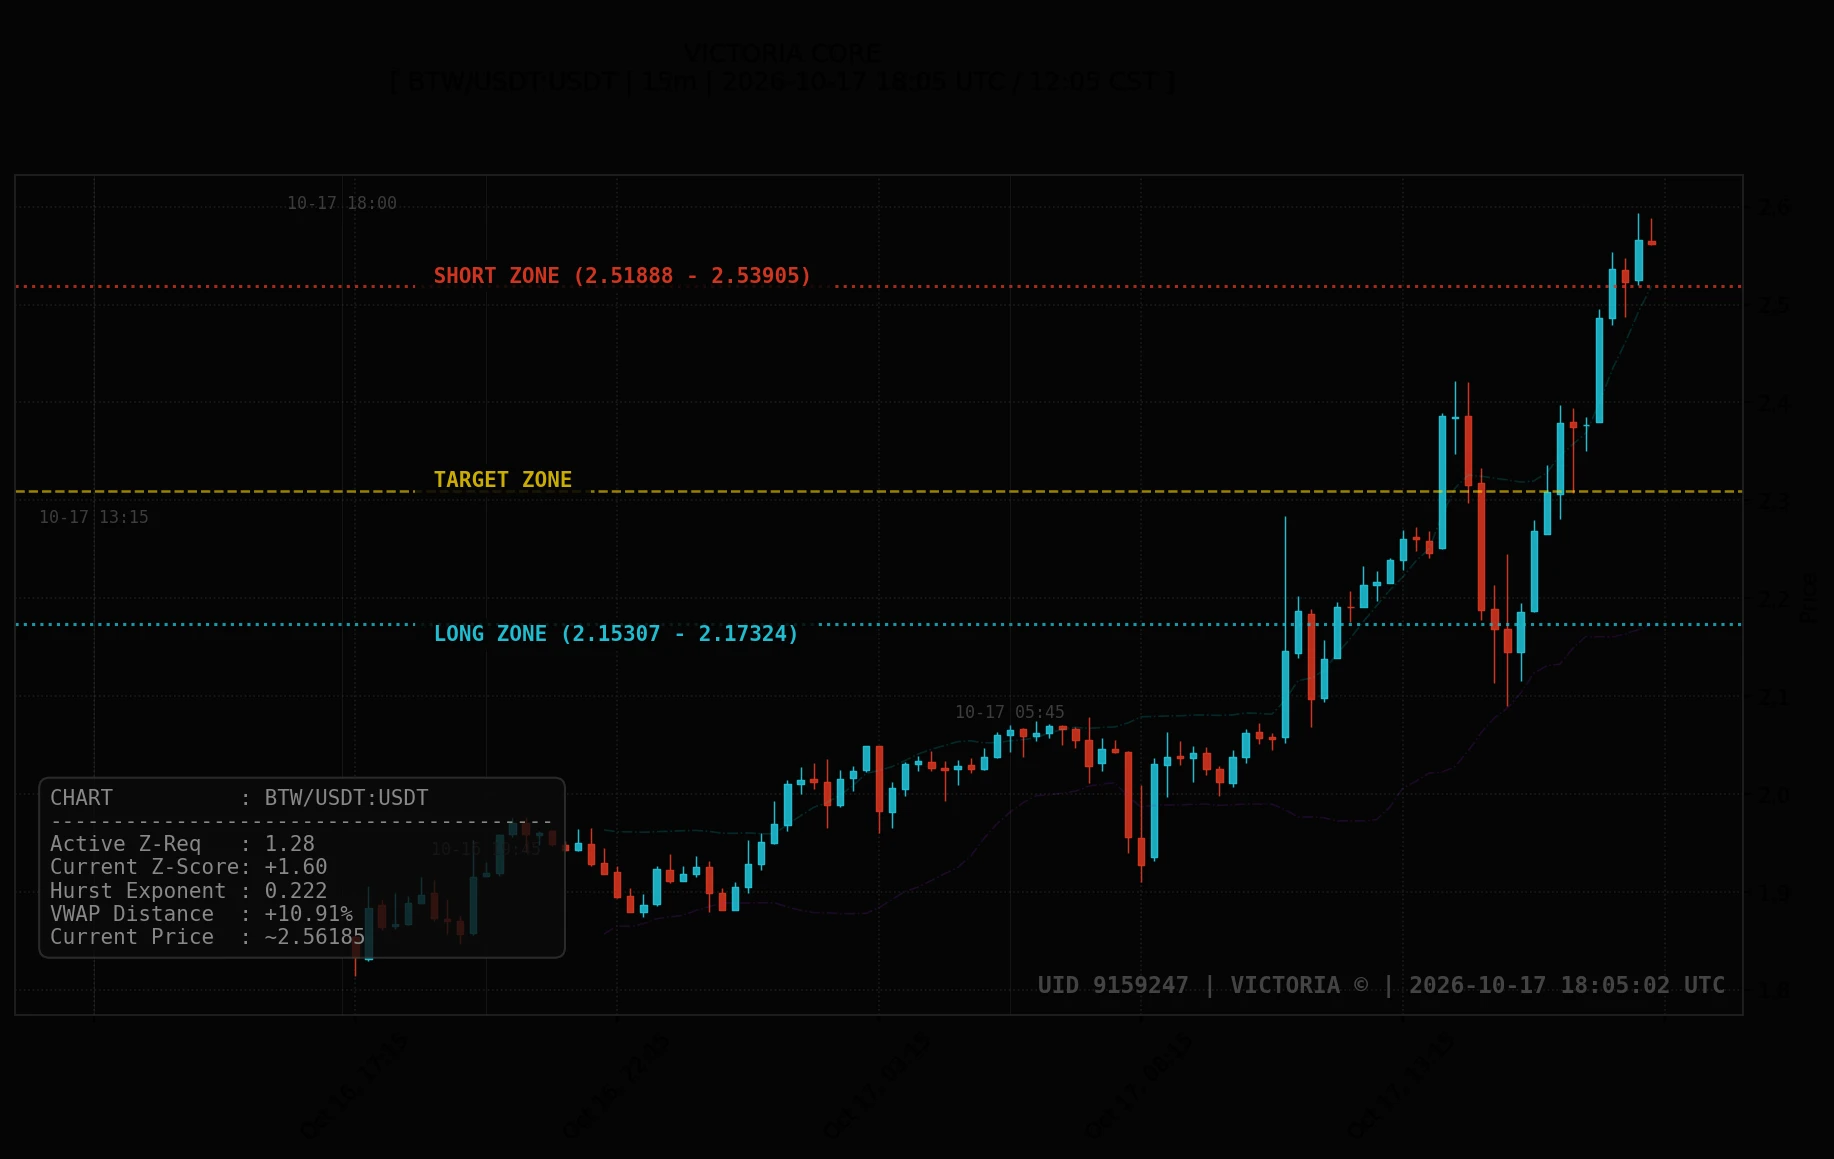
2026-10-17 18:05 UTC. Following a clean double-target hit on BTC in our previous session, BTW/USDT swept both liquidity extremes over the last four hours and is now trading at ~2.56185 USDT, extended well above its upper boundary. With price currently stretched past the SHORT ZONE (2.51888 - 2.53905 USDT) and structural support anchored at the LONG ZONE (2.15307 - 2.17324 USDT), we watch for momentum exhaustion to pull price back toward the equilibrium TARGET ZONE (~2.3099 USDT).
BTC/USDT also holds a clean structure (SHORT: 81543.4 - 81560.4 | LONG: 81235.8 - 81252.7 | TARGET: ~81357.5 USDT)
post-image
BTC+0.02%
BTW+40.83%
SOL+0.71%
  • 1
Retail investor: Make it make sense. Inflation came in HOT & bond yields went DOWN??
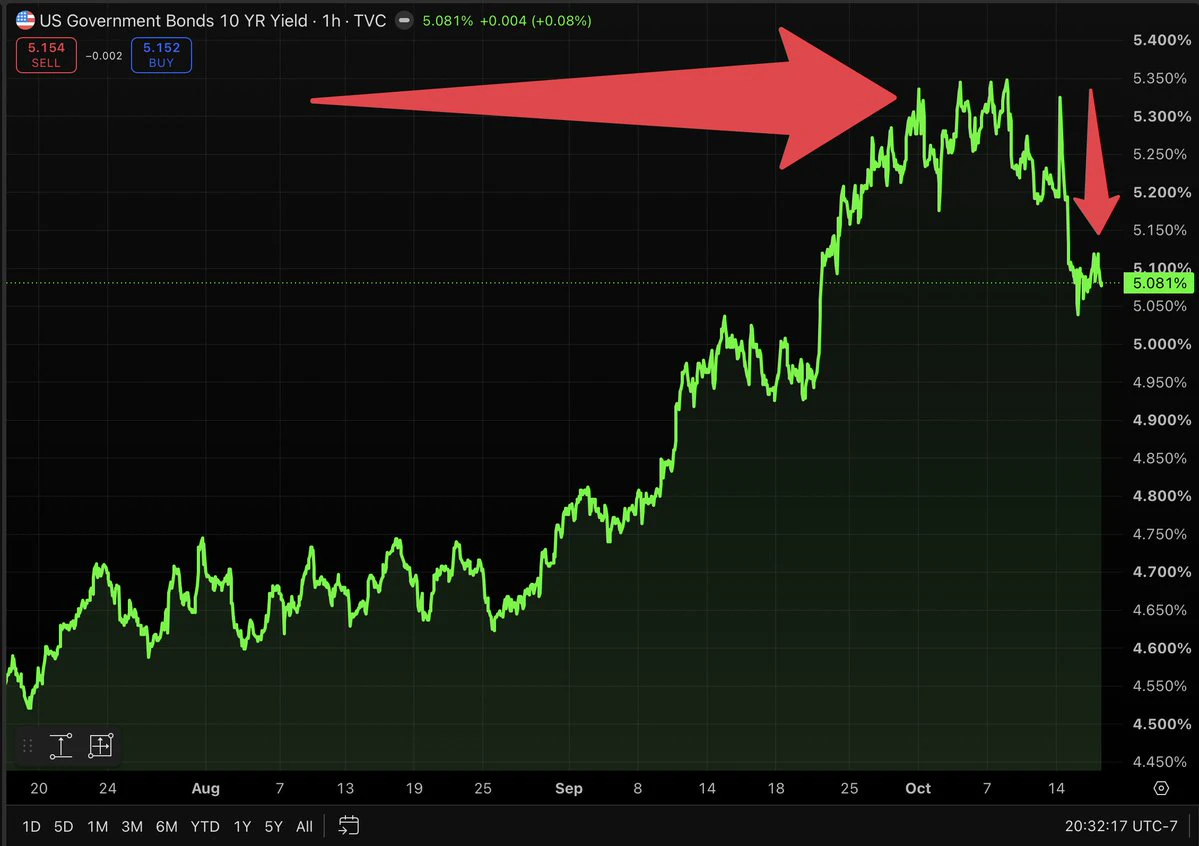
Me: Yep. 10 year went from about 5.35% to 5.08% in like 24 hours
Retail investor: but hot inflation should mean higher rates
Me: That’s the logic. The market doesn’t always follow logic in the short run
Retail investor: so why’d it happen
Me: People got scared of stocks & ran to bonds. When everybody buys bonds, bond prices go up... & when bond prices go up, yields go down. They move opposite
Retail investor: so it’s just fear
Me: Mostly. Money rotating out of stocks into “safety”
Retail investor: is that bad?
post-image
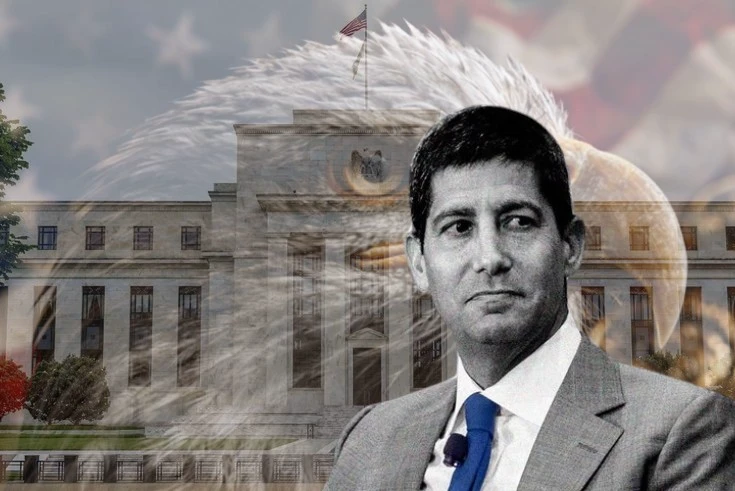
A discussion between Fed official Kevin Warsh and IMF Managing Director Kristalina Georgieva has provided clarity on the signals markets were seeking regarding the central bank’s next move. Taking place in Bangkok on the sidelines of the IMF-World Bank Annual Meetings, the conversation featured Warsh’s most comprehensive assessment of the global economy since he assumed his role 148 days ago.
The backdrop for the discussion was a set of inflation figures that exceeded expectations. The Consumer Price Index (CPI) for September rose by 3.7% year-on-year—surpassing forecasts—while core inflation
post-image
User_any
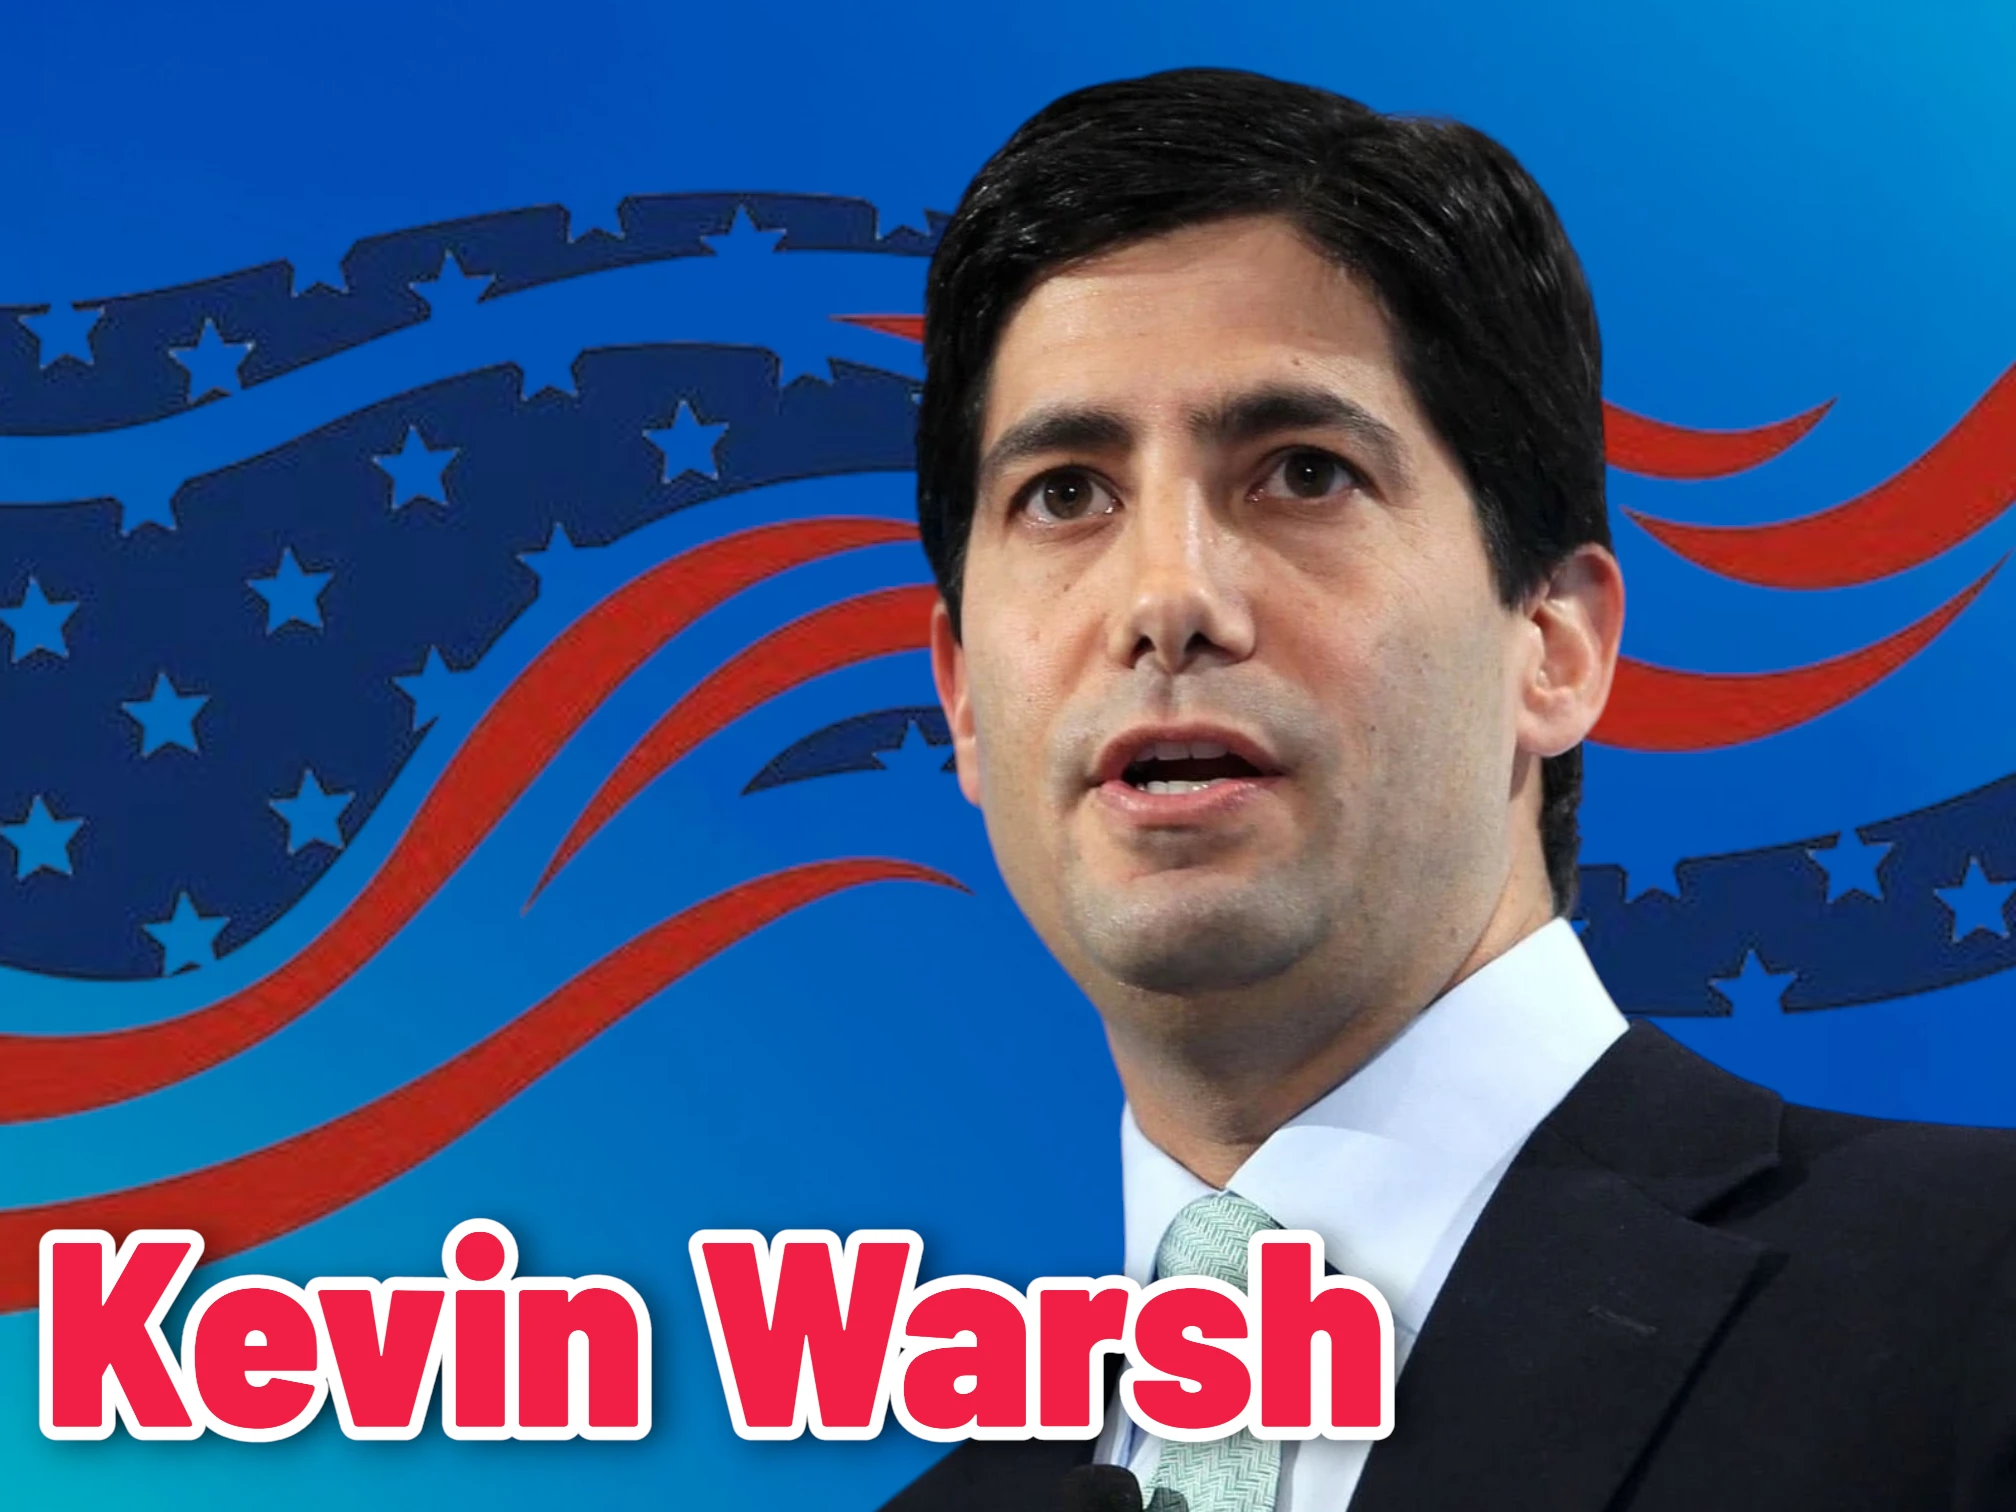
#WarshIMFSpeech Who is Kevin Warsh?
Kevin Maxwell Warsh is an American economist and former Federal Reserve governor nominated to lead the central bank in 2026. Born in Albany, New York, he built his career at the intersection of finance, policy, and academia.
Warsh earned degrees from Stanford University and Harvard Law School, combining public policy training with legal analysis. Early professional experience included a senior role at Morgan Stanley in mergers and acquisitions.
He joined the White House as Special Assistant to the President for Economic Policy and served on the National Economic Council during the Bush administration. In that capacity he represented the United States at G20 meetings and advised on crisis response.
President George W. Bush appointed Warsh to the Federal Reserve Board of Governors in 2006, where he served until 2011. He was the youngest appointee in Fed history at the time and participated actively during the 2008 financial crisis.
After leaving the Fed, Warsh became a distinguished visiting fellow at Stanford's Hoover Institution and joined the Group of Thirty. He later partnered at Duquesne Family Office and serves on corporate boards including UPS.
Financial disclosures filed in 2026 show assets exceeding $100 million, including significant investments and consulting income. Policy priorities include balance sheet normalization, enhanced Fed transparency, and preserving monetary independence.
As of May 2026, Warsh awaits Senate confirmation to succeed Jerome Powell as Fed chair, with a vote scheduled ahead of Powell's May 15 term conclusion. His background blends market experience with crisis-era policymaking credentials.
𝑰𝒏 𝒕𝒉𝒆 𝒔𝒉𝒐𝒓𝒕 𝒓𝒖𝒏, 𝒕𝒉𝒆 𝒎𝒂𝒓𝒌𝒆𝒕 𝒊𝒔 𝒂 𝒗𝒐𝒕𝒊𝒏𝒈 𝒎𝒂𝒄𝒉𝒊𝒏𝒆 𝒃𝒖𝒕 𝒊𝒏 𝒕𝒉𝒆 𝒍𝒐𝒏𝒈 𝒓𝒖𝒏, 𝒊𝒕 𝒊𝒔 𝒂 𝒘𝒆𝒊𝒈𝒉𝒊𝒏𝒈 𝒎𝒂𝒄𝒉𝒊𝒏𝒆. - 𝑩𝒆𝒏𝒋𝒂𝒎𝒊𝒏 𝑮𝒓𝒂𝒉𝒂𝒎
#FED
#KevinWarsh
#ShareWeekly #PlanYourTradesThisWeek
repost-content-media
MU-5.66%
NVDA-1.42%
NAS100-2.28%
EURUSD+0.15%
BTC+0.02%
  • 3
$DUSK 's chart looks ready, and the trend is now starting to emerge.
Very pleased with the progress this time. Good results. Keep an eye on these two today: $AG and $BTW .
post-image
DUSK+0.53%
AG-0.65%
BTW+40.83%
$Q Going long while telling others to go short? Definitely an insider
Q+121.49%
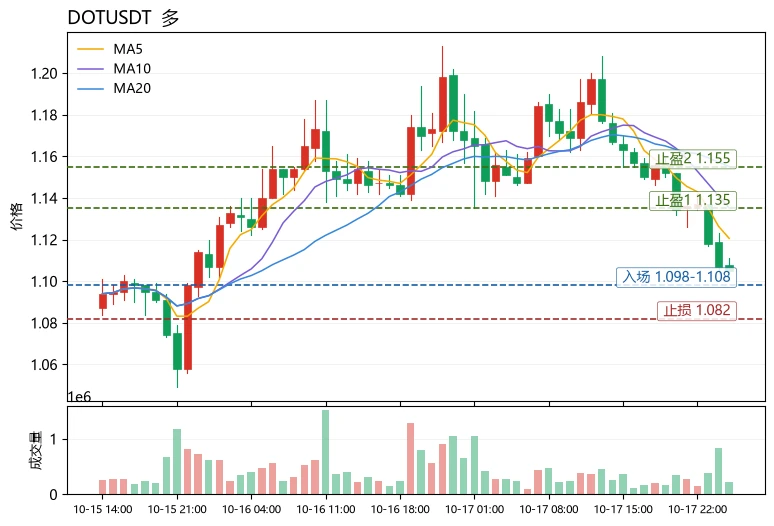
$DOT is currently in a clearly weak position relative to others in the same sector, but this extreme oversold condition is precisely what warrants attention. Conclusion first: bullish on a short-term rebound, but this is a countertrend recovery rather than a trend reversal.
Compared with the other candidates in the same batch, $EPIC is up 30.66% over 24h, with MA5 crossing above MA20, bullish MACD, and RSI at 58.4—a typical strong performer; $BNB is down just 1.31%, with a 2.97% price swing, making it a heavyweight asset with relative downside resilience. Meanwhile, $DOT is down 6.04%; MA5
post-image
DOT-2.28%
EPIC+8.30%
BNB-0.74%
crypto market overview
live-cover
LIVE16
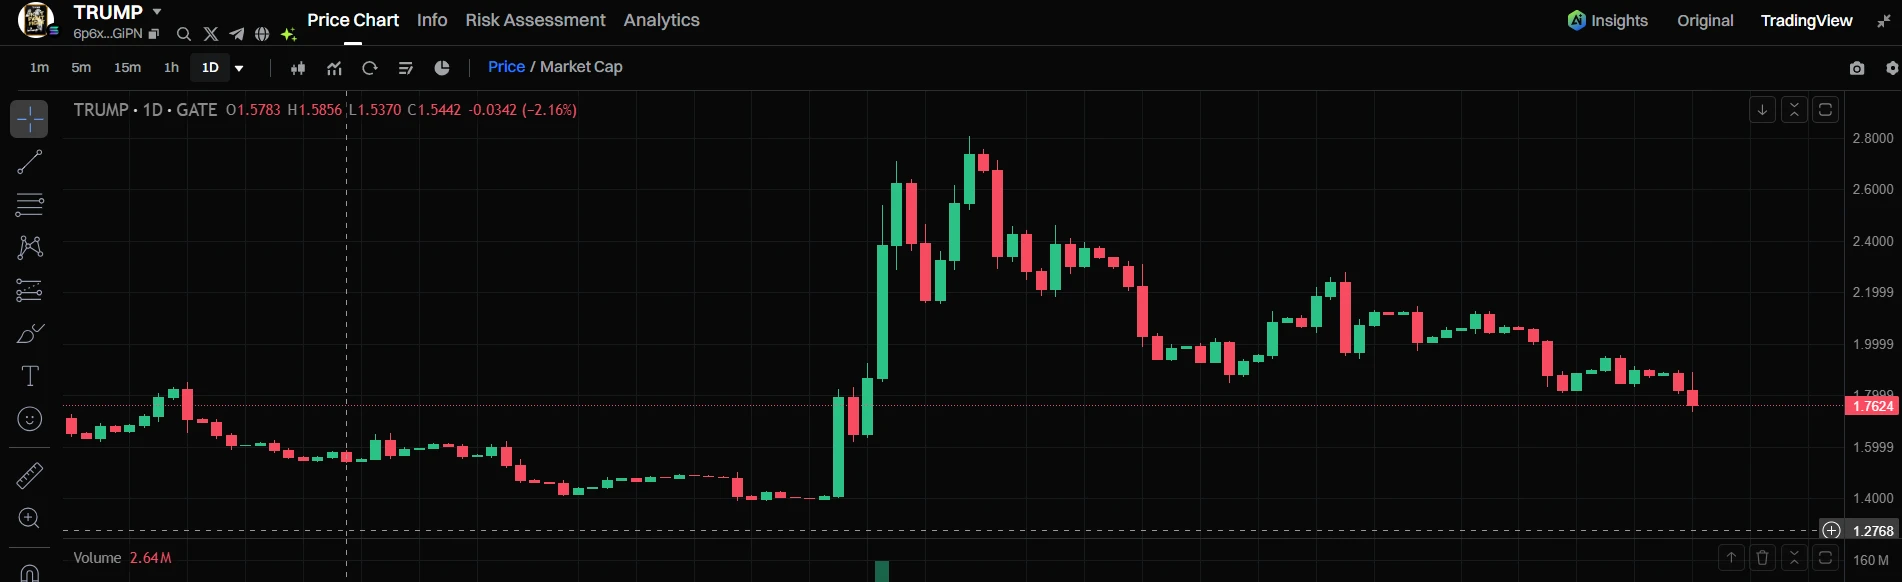
$TRUMP : the price only moves when the headline does
Look at this chart from left to right.
November: near $9. Now: $1.76. The all-time high was over $70.
The interesting part is not the fall. It’s the jumps. Every time the price shot up, it came from news: a headline, a political event, the White House crypto summit in August. Then it slid back to where it started.
August gave the biggest bounce in months, close to $3. Weeks later, most of it is gone.
That tells me who this token works for. It doesn’t have users or a product to hold the price up. It has attention, and attention fades once the
post-image
TRUMP-1.55%
TRUMP-1.53%
Bang bang bang, take off three zeros.
When you accidentally press the sell button
post-image
Crypto Trade Today
live-cover
LIVE1,665
#CryptoMarketTurnsGreedy
Crypto Market Turns Greedy: Is a New Bullish Wave Beginning?
The cryptocurrency market is showing signs of renewed optimism as investor sentiment shifts toward greed. After periods of uncertainty, traders are once again looking for opportunities in Bitcoin, Ethereum, and promising altcoins. But the big question remains: Is this the beginning of a stronger market rally, or are investors becoming too confident too quickly?
📈 Why Is Crypto Sentiment Turning Greedy?
Several factors can contribute to improving market sentiment:
1. Bitcoin Leads Market Confidence
Bitcoin r
BTC+0.02%
ETH+0.15%
MEME-1.19%
$SUI shows signs of a potential bullish rebound
After an extended downtrend, buyers are trying to regain control near the bottom. If momentum continues and key resistance levels are broken, SUI may begin a stronger recovery. My upside targets: TP1: $1.04TP2: $1.09TP3: $1.15Stop-loss: 0.90
The first major test is to reclaim $1.00 and hold above it. If it breaks through successfully, the price could move toward $1.20, ultimately reaching $1.50. Before expecting a bigger move, I’ll first watch for confirmation. $SUI
post-image
SUI-2.45%
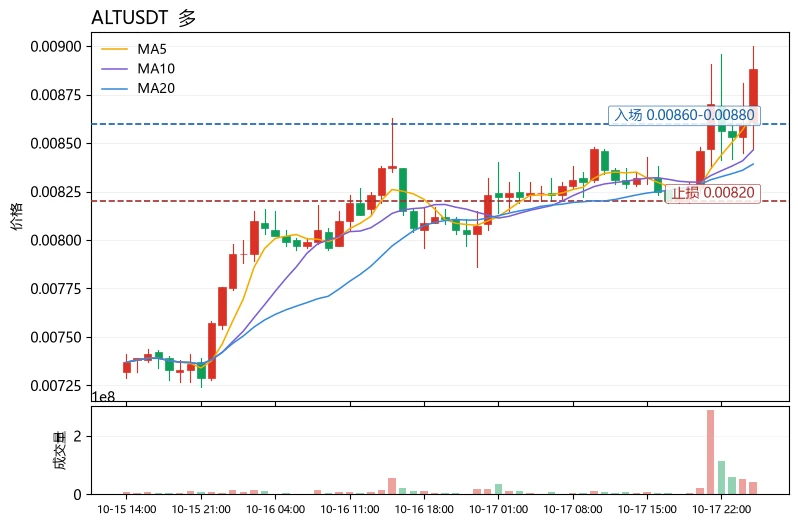
Chasing a coin solely because of its gains is one of the most common mistakes retail investors make when comparing assets. $ALT is up +8.61% today, which looks strong, but comparing it with the rest of the sector reveals its relative strength: $SOL is down -0.78% and $BTC is down -0.22% over the same period. With major assets flat to weak while ALT rallies independently, it suggests funds are rotating into small-cap Altcoins—a signal worth watching, not a simple reason to chase gains.
Technically, ALT is currently at 0.00896, above its short-term moving averages and breaking out on rising v
post-image
ALT+14.68%
SOL+0.71%
BTC+0.02%
$ALEO jogged all the way
post-image
ALEO-18.35%
Load More

Join 40 M users in our growing community

⚡️ Join 40 M users in the crypto craze discussion

💬 Engage with your favorite top creators

👍 See what interests you

Trending Topics

USSeptemberPPIBeatsExpectations

91.35k Views1.93k Discussing

US September PPI came in at 6.3% YoY, well above the 5.3% market expectation, pointing to renewed producer-side inflation pressure. Weekly jobless claims were 199K, broadly in line with forecasts. Could hotter inflation further reduce room for rate cuts, and what does it mean for $BTC, US stocks, and gold?

GateWCTCS9GlobalTradingCompetition

37.87k Views6.67k Discussing

GateBTCAndETHFuturesVolumeRanksTop3

53.8k Views1.81k Discussing

View More