Square
Following
Hot
News
Profile
Share your thoughts
placeholder
Article
$AGT BOOM😨 It’s flying up again, damn. LONG was doing great, then turned around and went SHORT. Nothing to do but keep grinding; the rewards will come soon😎😎
SHORT SHORT SHORT🔥🔥AGT congabeo$BT $MAGMA
CPIWatch
post-image
MAGMA+2.67%
Market anylysis today BTC and other coin 👛🪙
live-cover
LIVE1,320
Trenches
AGT
A
bade
b
AGT
0x5d...e274
Market Cap
$.
Change
.
24h Vol
$.
Holders
.
CNPY
C
bade
b
CNPY
0xc6...ddd2
Market Cap
$.
Change
.
24h Vol
$.
Holders
.
Q
Q
bade
b
Q
0xc0...0589
Market Cap
$.
Change
.
24h Vol
$.
Holders
.
COVENANT
C
bade
b
COVENANT
0xcd...de79
Market Cap
$.
Change
.
24h Vol
$.
Holders
.
Gato
G
bade
b
Gato
55A3...pump
Market Cap
$.
Change
.
24h Vol
$.
Holders
.
My friend shorted $AGT , $Q and $BTW today. All three. Same day.
His logic was solid: “It’s already up 65%. It can’t go higher.”
$AGT hit 0.1048 and kept going.
Then he said, “Okay, $Q is up 119%. That’s insane. Now THIS one has to dump.” It printed another green candle while he was typing the order.
By then he was angry, so he went for the third one: “$BTW is only up 34%, there’s still room for a clean short.” The chart made a new high and he made a new lesson.
The funny part is that Q’s funding was negative. Shorts were paying longs to stay in the trade. He literally paid a fee to be wrong
post-image
AGT+40.60%
Q+117.46%
BTW+26.01%
  • 1
Some things don't need to be seen to be trusted.
Opportunities are reserved for those who are prepared!!!
  • 1
$DOGE Current price: 0.07909. The first resistance above is 0.0799, where the Bollinger midline and MA20 converge. Support is at the lower Bollinger Band at 0.0786; a break below opens up room to 0.0780. The chart is in a bearish alignment: MA5 at 0.07937 is below MA20 at 0.07989, the MACD histogram remains negative at -5.47e-05, and RSI at 41.3 is weak but not oversold. The 30-candle range is only 5.17%, indicating a low-volume drift down rather than panic selling.
The real point of contention is the funding rate: at -0.0009%, it is negative, with shorts continuously paying longs, indicating
post-image
ZEC-1.98%
$ELA SEND IT TO THE STARS!
post-image
ELA+11.90%
BTC falls 0.62% in 24 hours, with $31.89 million in sell volume in the final hour
Gate spot BTC/USDT is currently quoted at 81285.5 USDT, down 0.62% over 24 hours, with a high of 81818.4 and a low of 80817.0. That 0.62% is almost negligible on the daily chart, but the final hourly candle was different: it opened at 81647.1, plunged to a low of 80817.0, and closed at 81124.9, with 31.89 million USDT in hourly trading volume—more than three times the previous hour’s approximately 8.71 million.
What I’m more interested in is whether this drop was accompanied by volume. Looking at the latest 48 ho
BTC-0.25%
  • 3
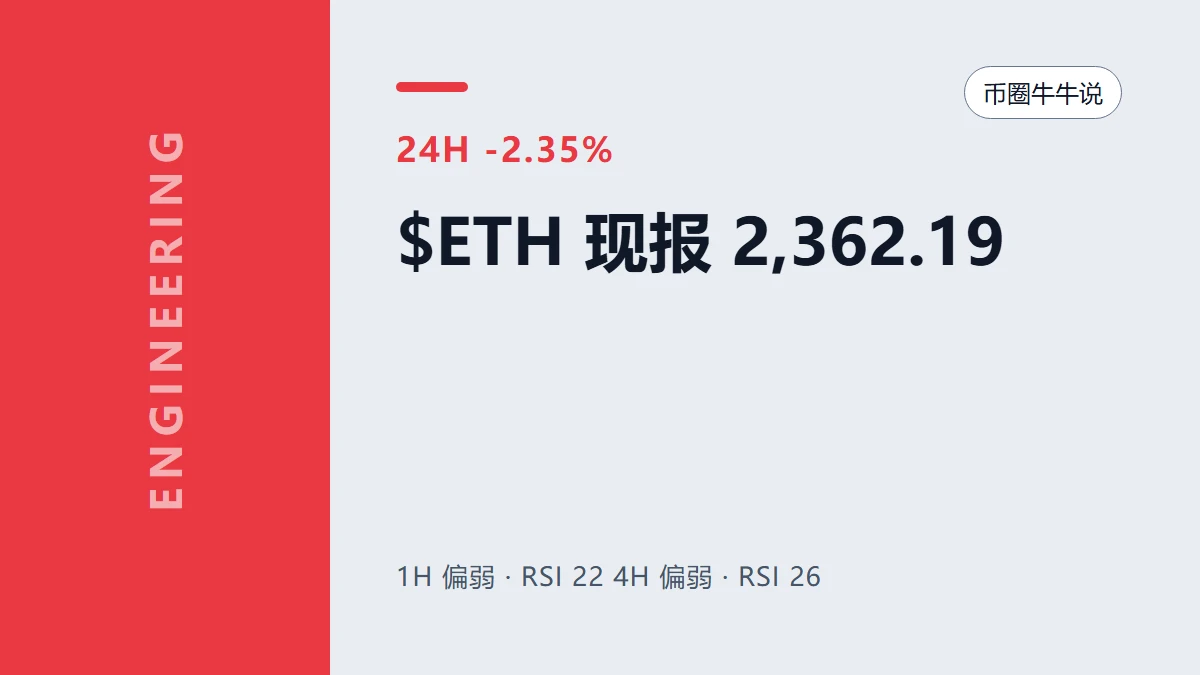
Same range just chop all around for $ETH .
Deviation? Continuation? Or still chop
ETH-0.93%
📗Macro Schedule (Time)

✅10.19 Monday
14:00 Opening ceremony of the Financial Street Forum Annual Meeting; senior officials from the central bank, SAFE, and CSRC to speak; Fed discount rate closed-door meeting (no exact public time)
✅10.20 Tuesday
09:00 LPR loan prime rate announcement; Fed governors' closed-door meeting
✅10.21 Wednesday
Morning APEC Finance Ministers' Meeting and post-meeting press conference (Hong Kong venue)
✅10.22 Thursday
Evening European Parliament vote on a resolution related to Black Sea shipping
✅10.23 Friday
Evening U.S. consumer and manufacturing economic data rel
post-image
$CT I took the full -12.73% hit on this move: entered at 0.385, cut at 0.34, down 11 points. The post-mortem is simple: greed. Before the Fed minutes, I clearly saw $CT 24h volume shrink to just over 20M and large on-chain transfers start flowing out, but I still fantasized that dovish minutes would spark a rally. Instead, the minutes were hawkish, and $CT plunged straight through 0.35, hitting a low of 0.3155. I set my stop at 0.34 and at least stuck to my discipline, but the entry thesis itself was wrong—loading up on a small-cap token ahead of a macro event; correlation is no excuse, I was
CT-14.82%
$GTC Strong rebound from the key FVG area on the 1-hour chart; expected to pull back to the major liquidity zone around $0.255 to $0.260.‼️
Long $GTC Entry: 0.235 - Current price Take profit: 0.257 Stop loss: 0.215 Trade here $GTC 👇
post-image
Online Lending Life with a market cap of 110k—are you sure you don't want to buy?
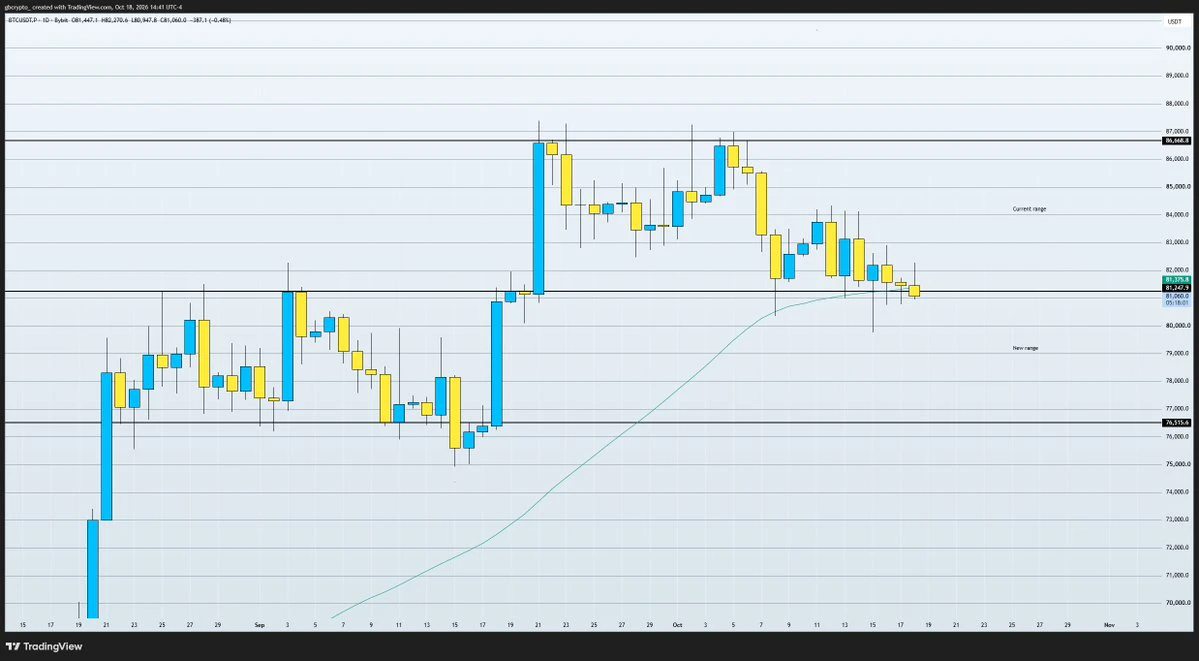
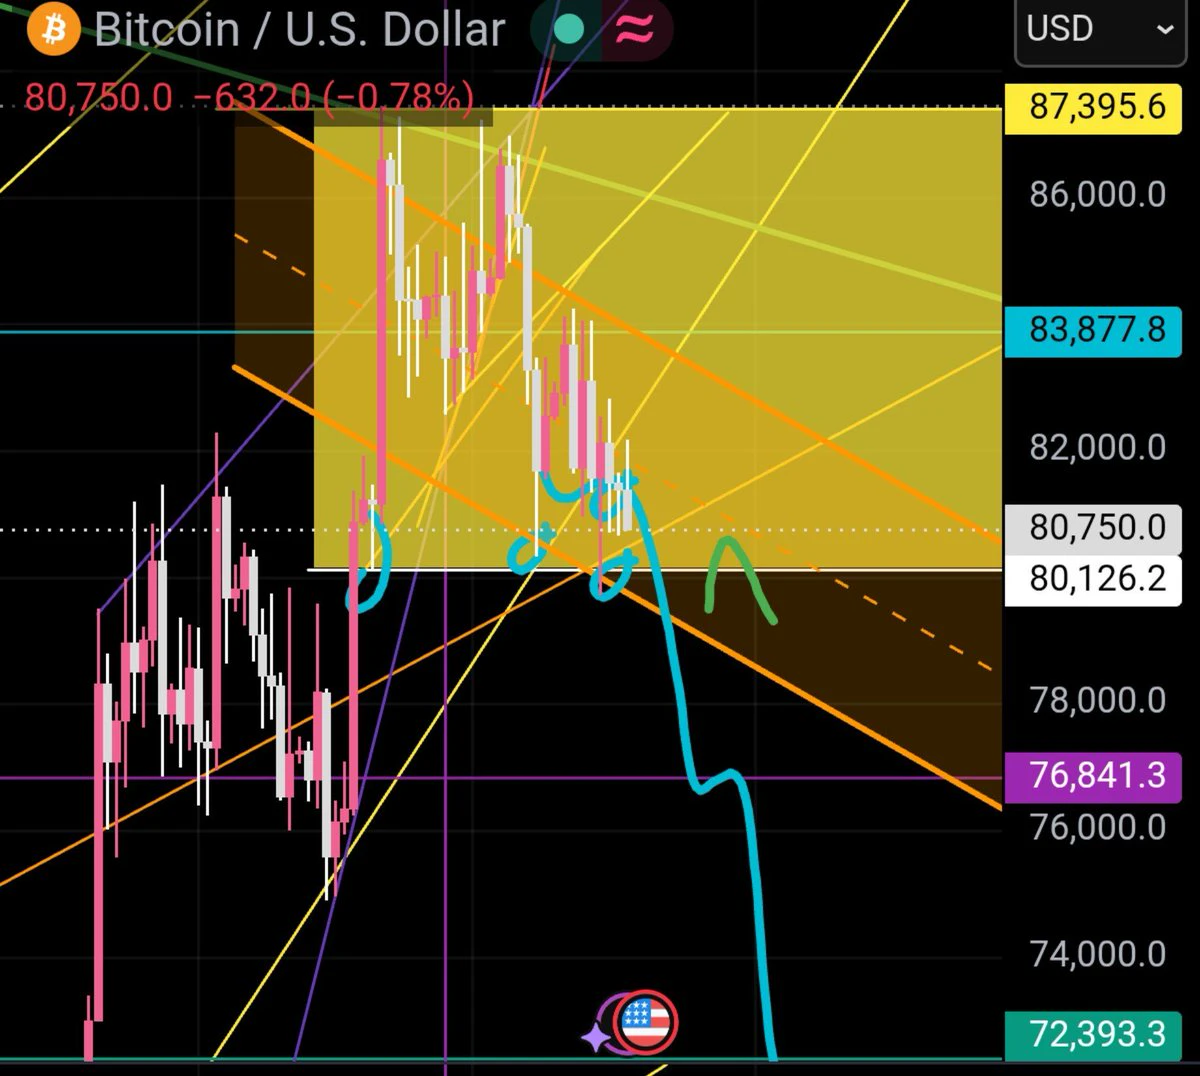
Strong rebound after sweeping the lows—the bulls fought tooth and nail to defend 80.7k. Try going long on $BT .
Entry range: 80,804.0 - 81,210.1Take-profit targets: 82,824.1 - 84,277.7Stop-loss: 79,996.0Note: If it fails to reclaim the 1-hour MA25, it may test the range low again. Don’t go all in, guys. Size your position according to your account. It’s time to go long! 👇👇👇These caught my attention today: $AV and $AGT .
post-image
AGT+40.60%
BTC at $81,303, ETH at $2,392, SOL at $103: Volume-price differences across three bearish candles
📊 Gate spot snapshot (October 17, 23:08 UTC): three bearish candles, but the declines are nowhere near the same magnitude: BTC -0.54%, ETH -1.33%, SOL -1.35%. BTC edged down, while ETH and SOL fell more than twice as much.
First, BTC. The current price is 81,303.2 USDT, with a 24-hour high of 81,791.5 and a low of 80,817.0. The day's range is less than 1.2%, with a trading volume of 233 million USDT. The price is hovering in a narrow range just above 81,000, and the 80,817 low has not been breach
post-image
BTC-0.25%
ETH-0.93%
SOL-1.04%
Crypto Market update
live-cover
LIVE1,042
Set it up this way to automatically clean up 99% of comments.
$PI If you insist on holding and refuse to sell, capital will insist on staying out of the market. The price will keep fluctuating, wearing you down until you’re completely broke—then let’s see if you’ll finally cut your losses. Capitalists have plenty of money and no urgency. But you’re poor and need money for all sorts of things; you can’t wait.
Someone asked, “When will it go up?” A rise may only happen after all of you have sold the coins you’re holding.
post-image
PI-1.20%
  • 3
Next week: October 19 (Monday) — October 25 (Sunday) Daily Macro + Geopolitical Preview

Sources: CCTV, Cailian Press, Federal Reserve website, public schedules

✅October 19 Monday
📊Macro: The Financial Street Forum Annual Conference opens, with senior officials from the PBOC, SAFE, and CSRC delivering policy speeches; the Federal Reserve holds a closed-door discount rate meeting
🌍Geopolitics: Ukraine-U.S. talks may begin; the European Parliament opens discussions on Black Sea shipping security

✅October 20 Tuesday
📊Macro: China announces its LPR loan prime rate; closed-door meeting of F
$2 won’t make you rich. 72 good trades might.
Start with $2 USDT. Make 20% on a trade and reinvest it:
10 trades → $12
30 trades → $475
50 trades → $18,000
72 trades → $1,000,000+
At 30% per trade, you get there in 51.
Look at trade 30. That’s when $2 stops feeling like a joke and starts looking like a real account.
Nobody posts their $2 day. Everyone waits until the account looks impressive. I’d rather show the beginning.
Every big account was small once. Day 1 was never the problem. Quitting before Day 30 was.
So this is my challenge. $2. One setup. Every trade written down, wins and losses.
post-image
Load More

Join 40 M users in our growing community

⚡️ Join 40 M users in the crypto craze discussion

💬 Engage with your favorite top creators

👍 See what interests you

Trending Topics

USSeptemberPPIBeatsExpectations

91.35k Views1.93k Discussing

US September PPI came in at 6.3% YoY, well above the 5.3% market expectation, pointing to renewed producer-side inflation pressure. Weekly jobless claims were 199K, broadly in line with forecasts. Could hotter inflation further reduce room for rate cuts, and what does it mean for $BTC, US stocks, and gold?

GateWCTCS9GlobalTradingCompetition

37.87k Views6.68k Discussing

GateBTCAndETHFuturesVolumeRanksTop3

53.8k Views1.81k Discussing

View More