Square
Following
Hot
News
Profile

Fun_Trader

vip
Peak Tier 5
Quant Trader
Diamond Hands
Trading For What's?
8
Following
2.9k
Followers
4.5k
Liked
EVAA has the same name as my ex. My ex often hurt me. I hope this coin with the same name won't hurt me :).
#美国中期选举
$EVAA
post-image
EVAA-0.42%
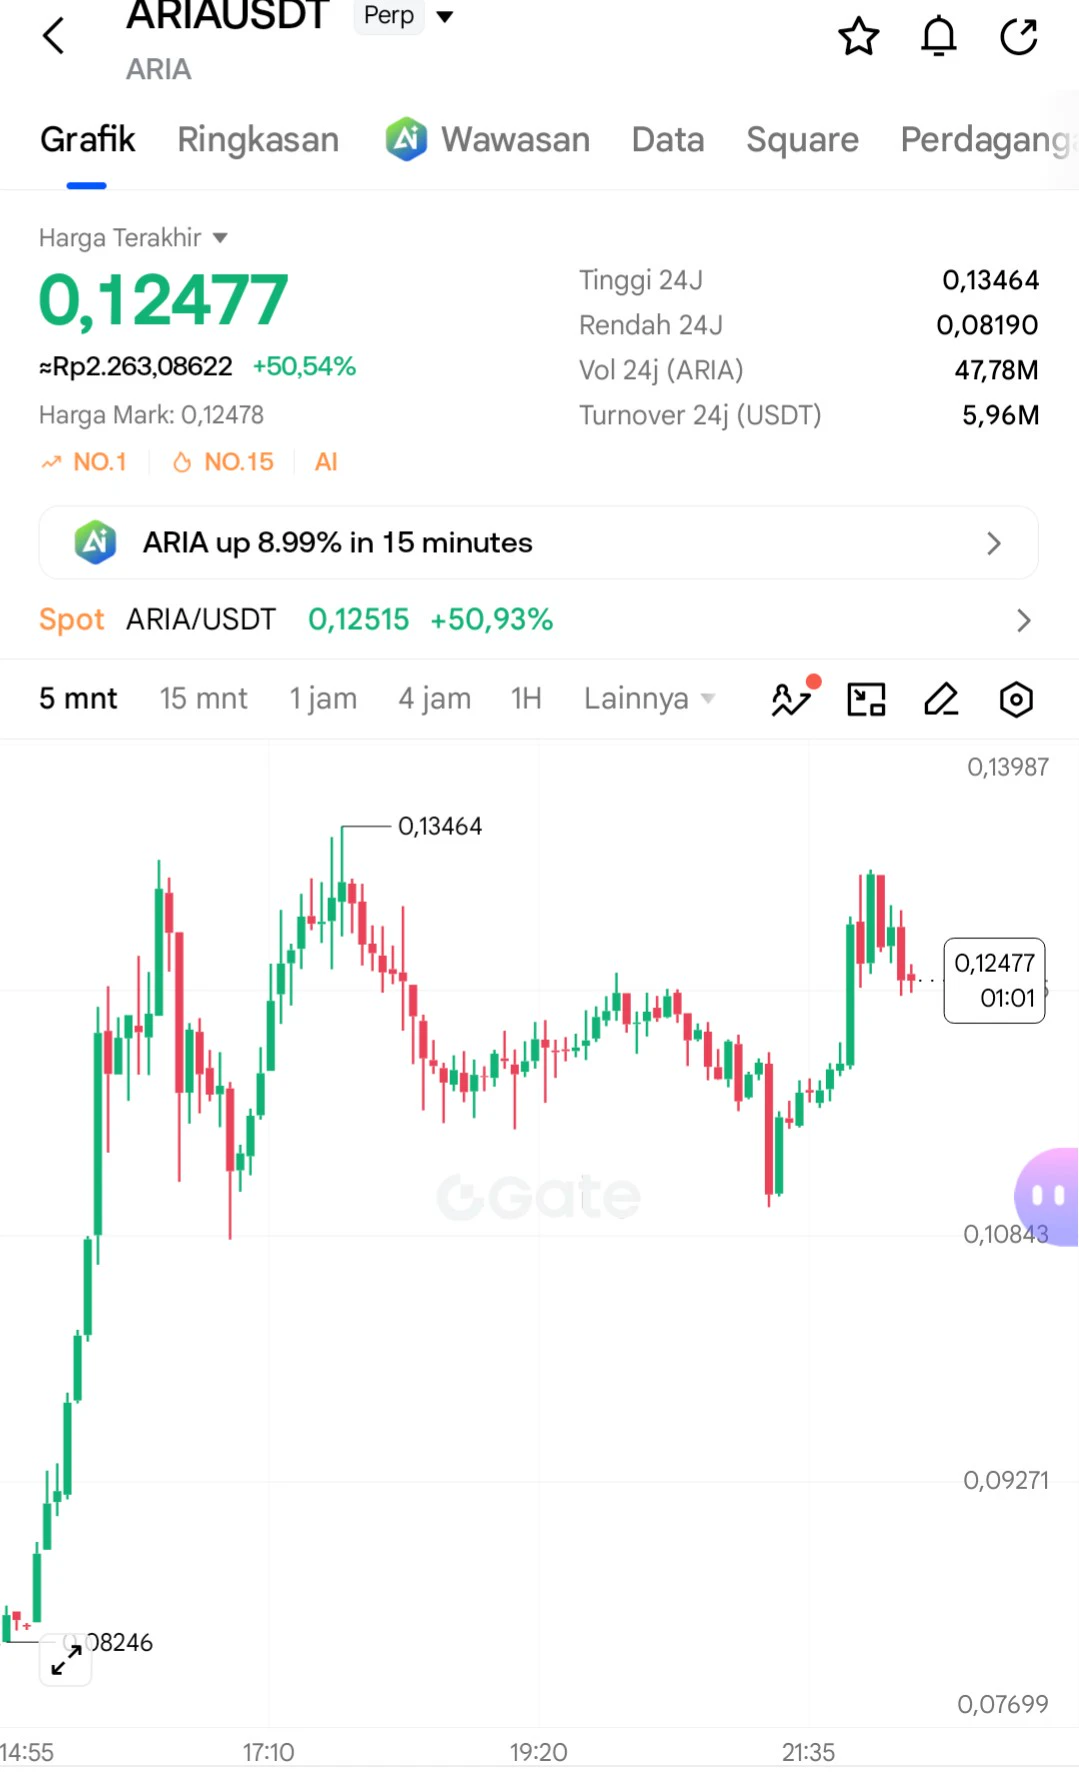
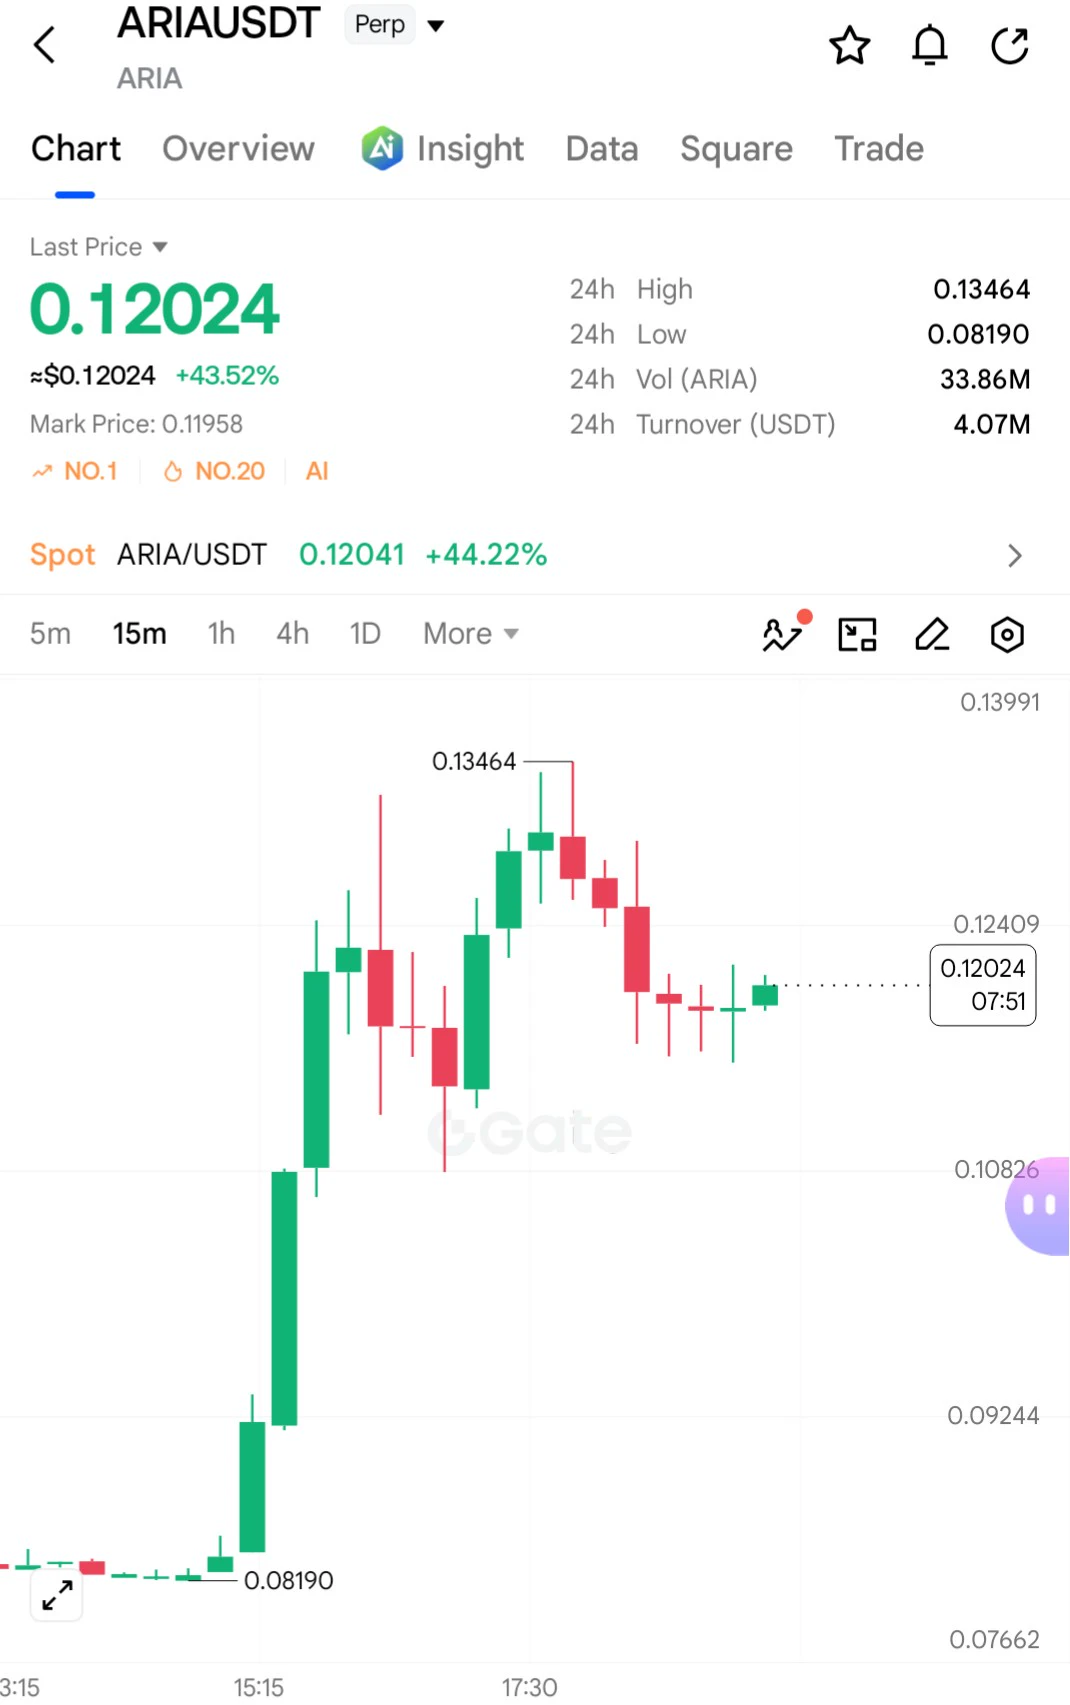
ARIA/USDT, I entered again. I already closed the previous position. SL 0.14
$ARIA
post-image
Fun_Trader
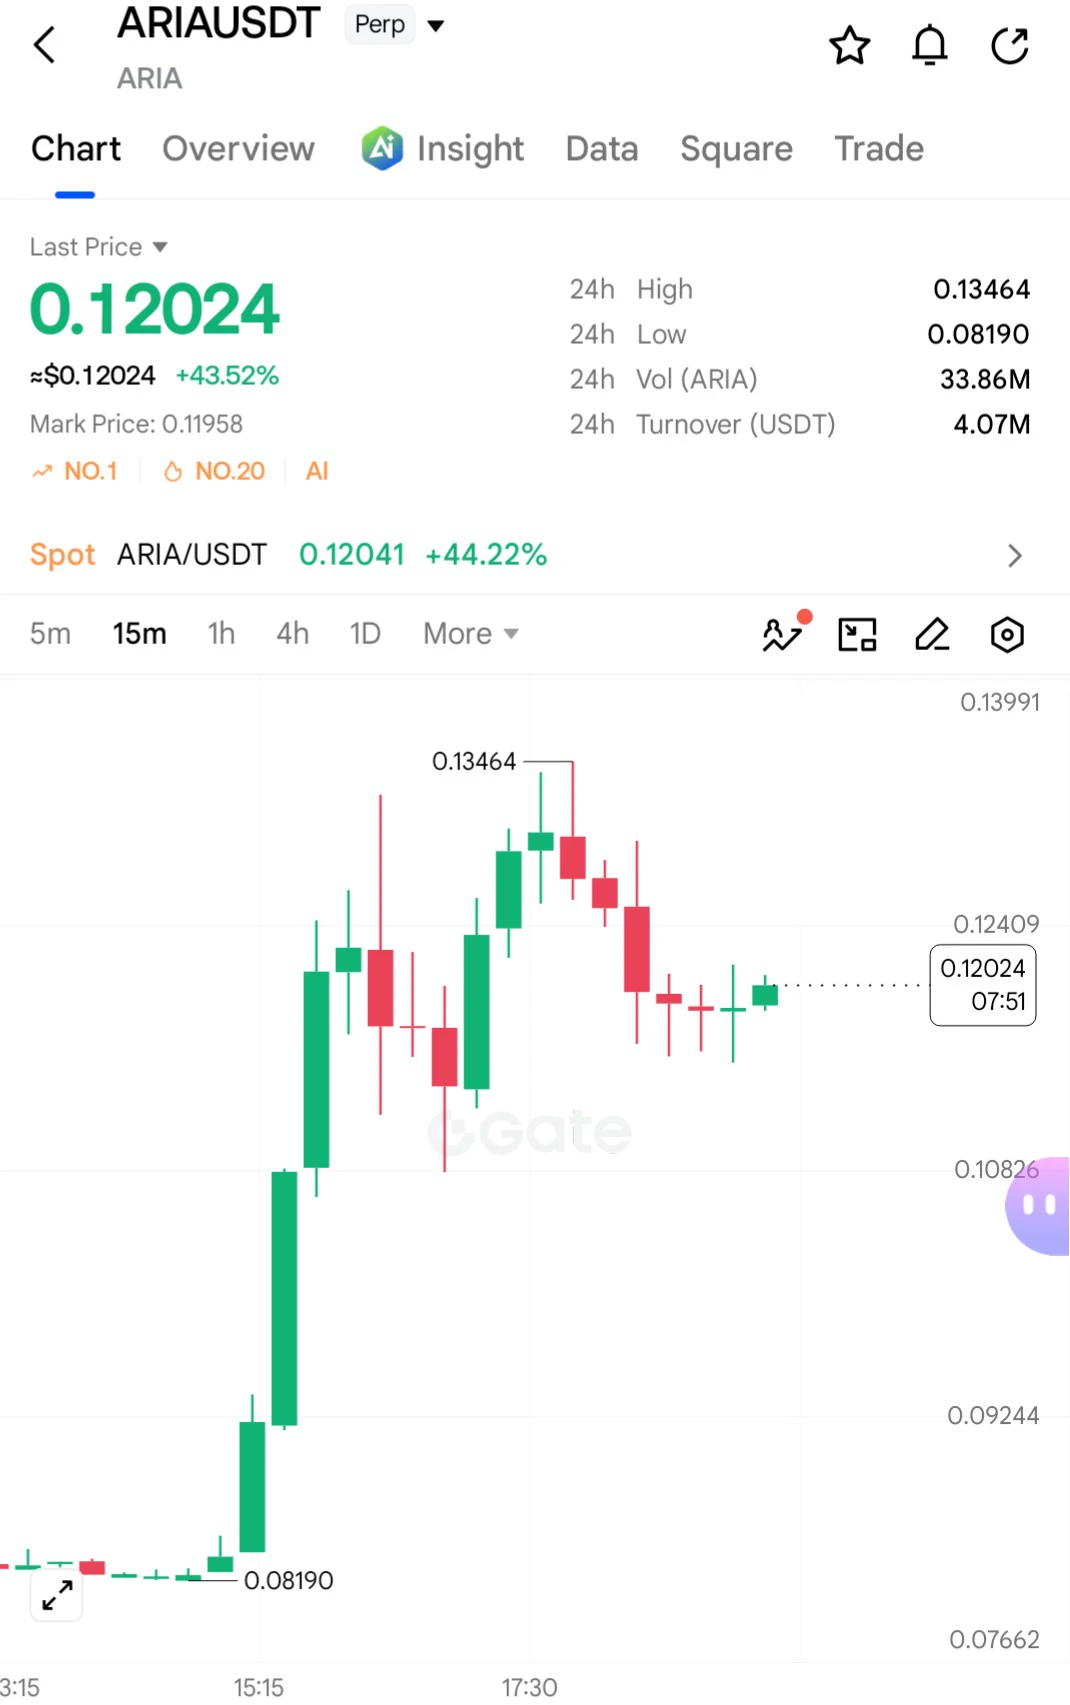
ARIA seems likely to rise again. Maybe I'll close my short position.
#CLARITYActExpandsCryptoInformationSharing
$ARIA ‌
repost-content-media
ARIA+21.92%
  • 1
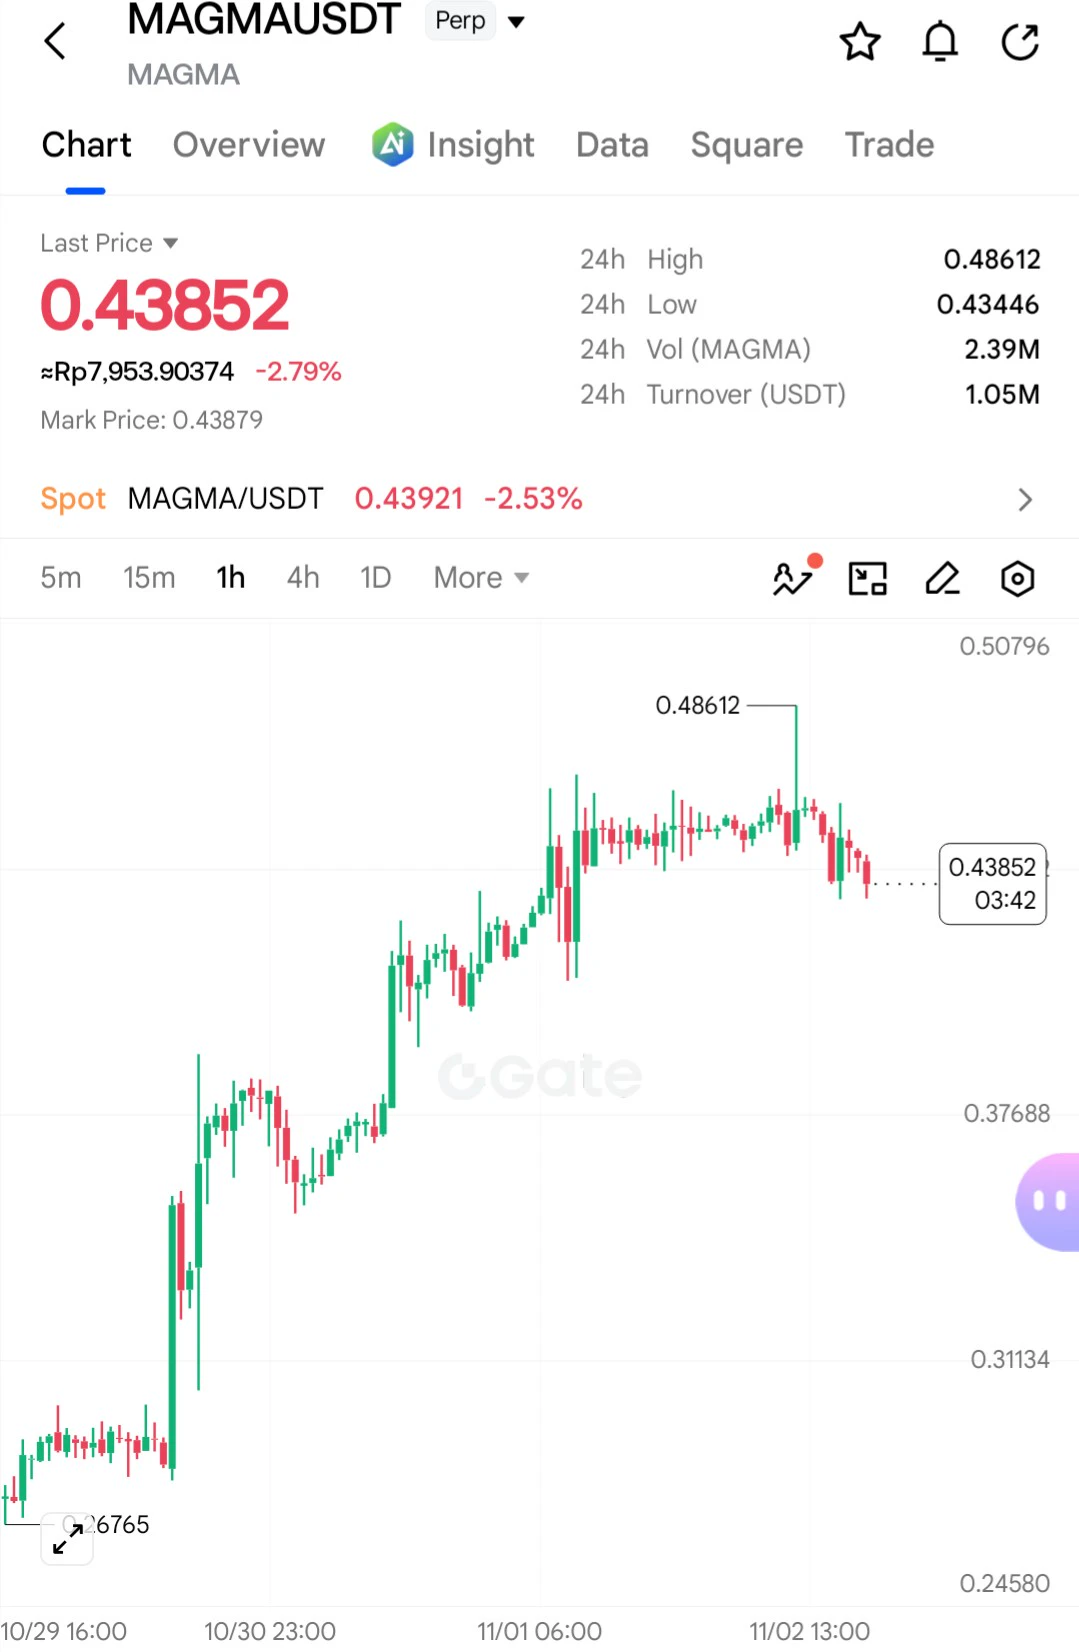
MAGMA/USDT is holding on tight. Buckle up. The price is going to plunge.
#GateWCTCS9
$MAGMA
post-image
MAGMA-0.95%
  • 2
ARIA seems likely to rise again. Maybe I'll close my short position.
#CLARITYActExpandsCryptoInformationSharing
$ARIA ‌
post-image
ARIA+21.92%
  • 2
  • 1
IDOL. This rise is just a correction before continuing to fall to its lowest price.
#美国中期选举
$IDOL
IDOL-7.01%
  • 1
#GateSquareHalloween
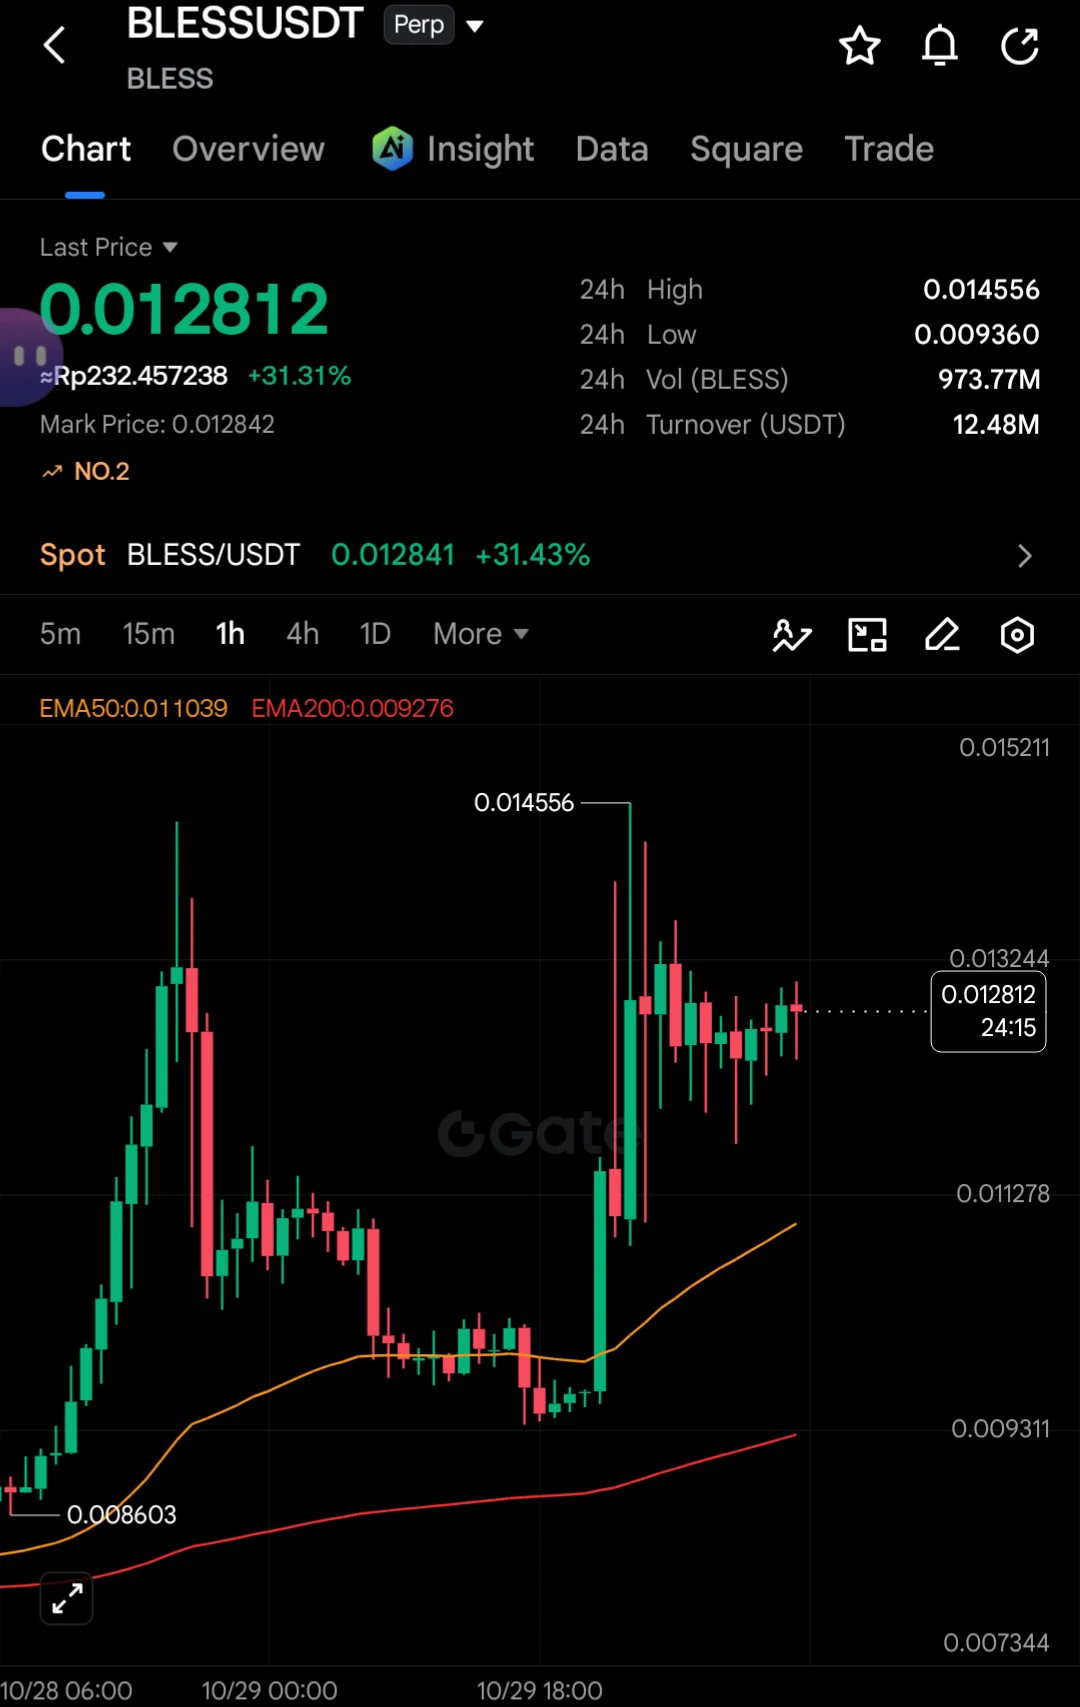
BLESS/USDT is showing a strong bullish trend, driven by a price surge of +31.31% to 0.012812, above the 50 EMA and 200 EMA. High trading volume reached 973.77M BLESS.
​Trading Opportunities:
​Buy on Dip: Wait for a healthy correction near the support area at 0.011278 or the 50 EMA line.
​Breakout: Enter a buy position if the price breaks through the 0.013244 resistance with strong volume.
​Target & Stop Loss: Set a profit target around 0.014556 and limit risk (stop loss) below 0.011278.
​Note: Always use risk management because crypto volatility is very high. $BLESS
post-image
BLESS-2.03%
  • 2
#GateSquareHalloween
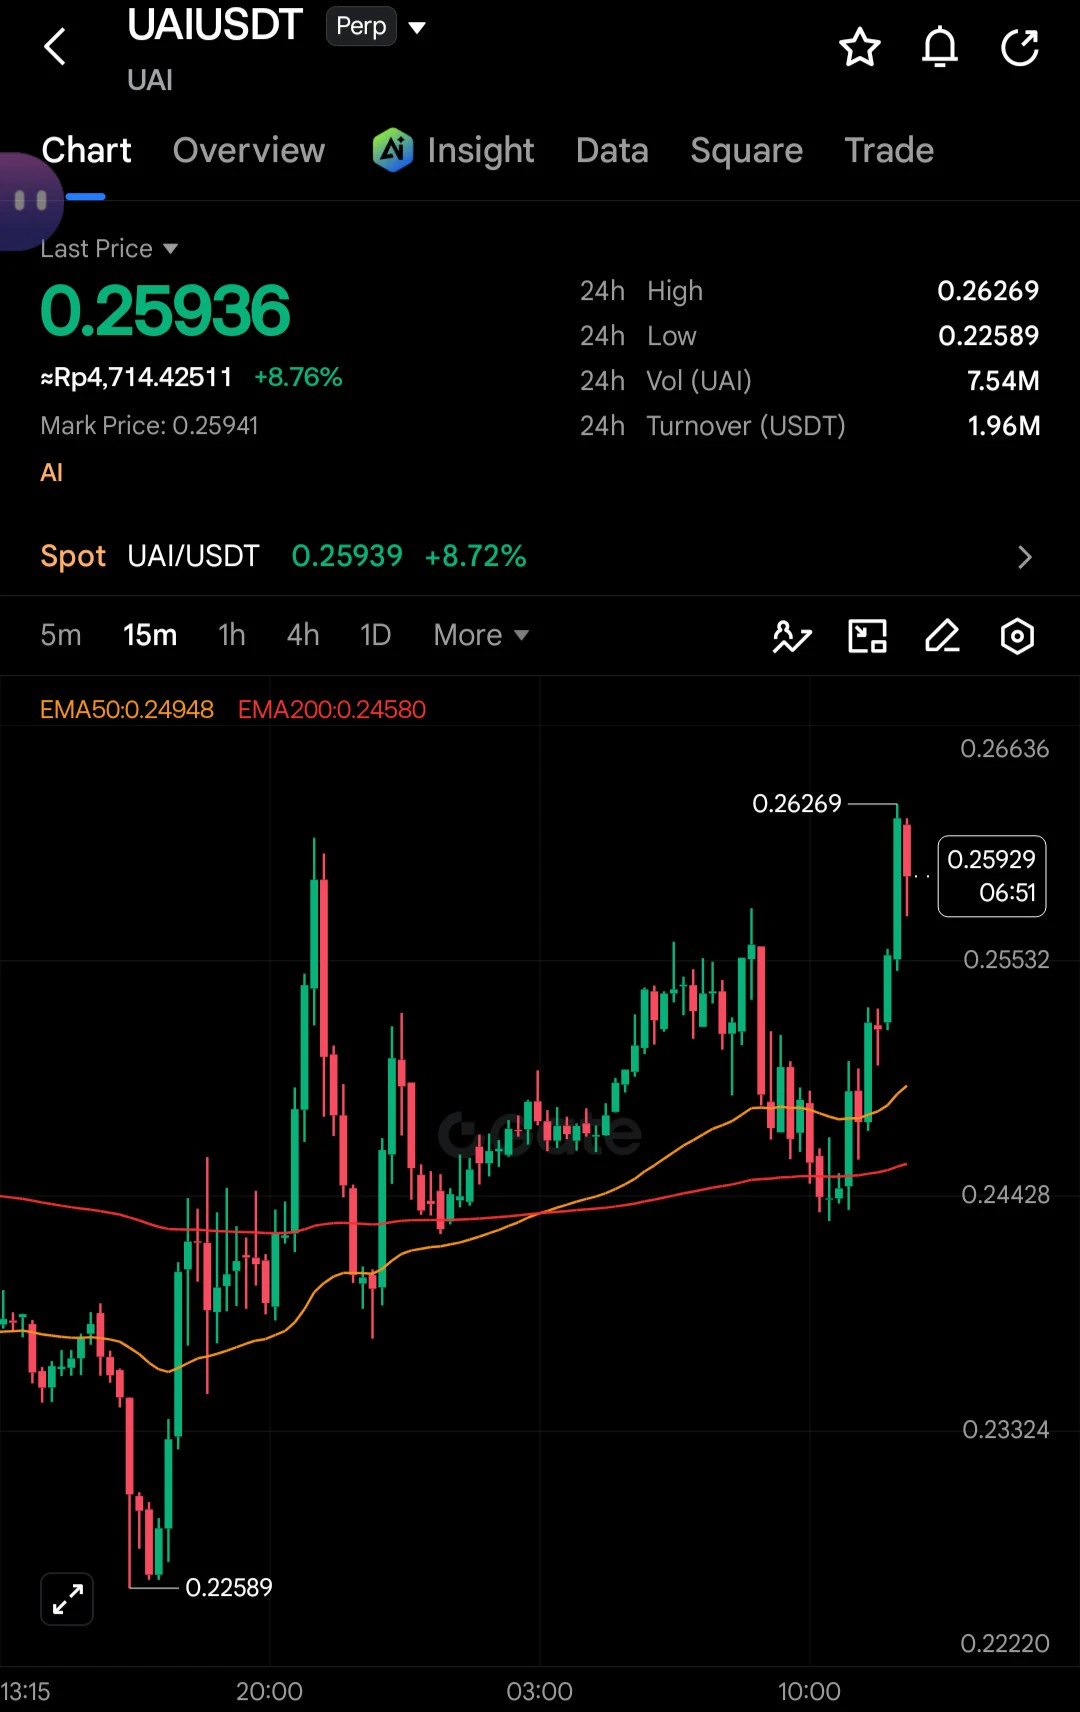
UAI/USDT, the current trend shows strong bullish momentum after a price surge broke above the previous high to 0.26269. The price is well above the EMA 50 (0.24948) and EMA 200 (0.24580), indicating strong buyer dominance.
​Trading Opportunities:
​Buy/Long: Look for buying opportunities (pullbacks) if the price undergoes a healthy correction toward the nearest support area or the EMA 50 line around 0.249 - 0.252.
​Target (TP): Retest resistance at 0.262 - 0.266.
​Stop Loss (SL): Place it below the EMA 50 to anticipate a short-term trend reversal.
Note: This position is on
post-image
UAI-7.51%
  • 1
Ha ha ha ha 😂
$DOS
Fun_Trader
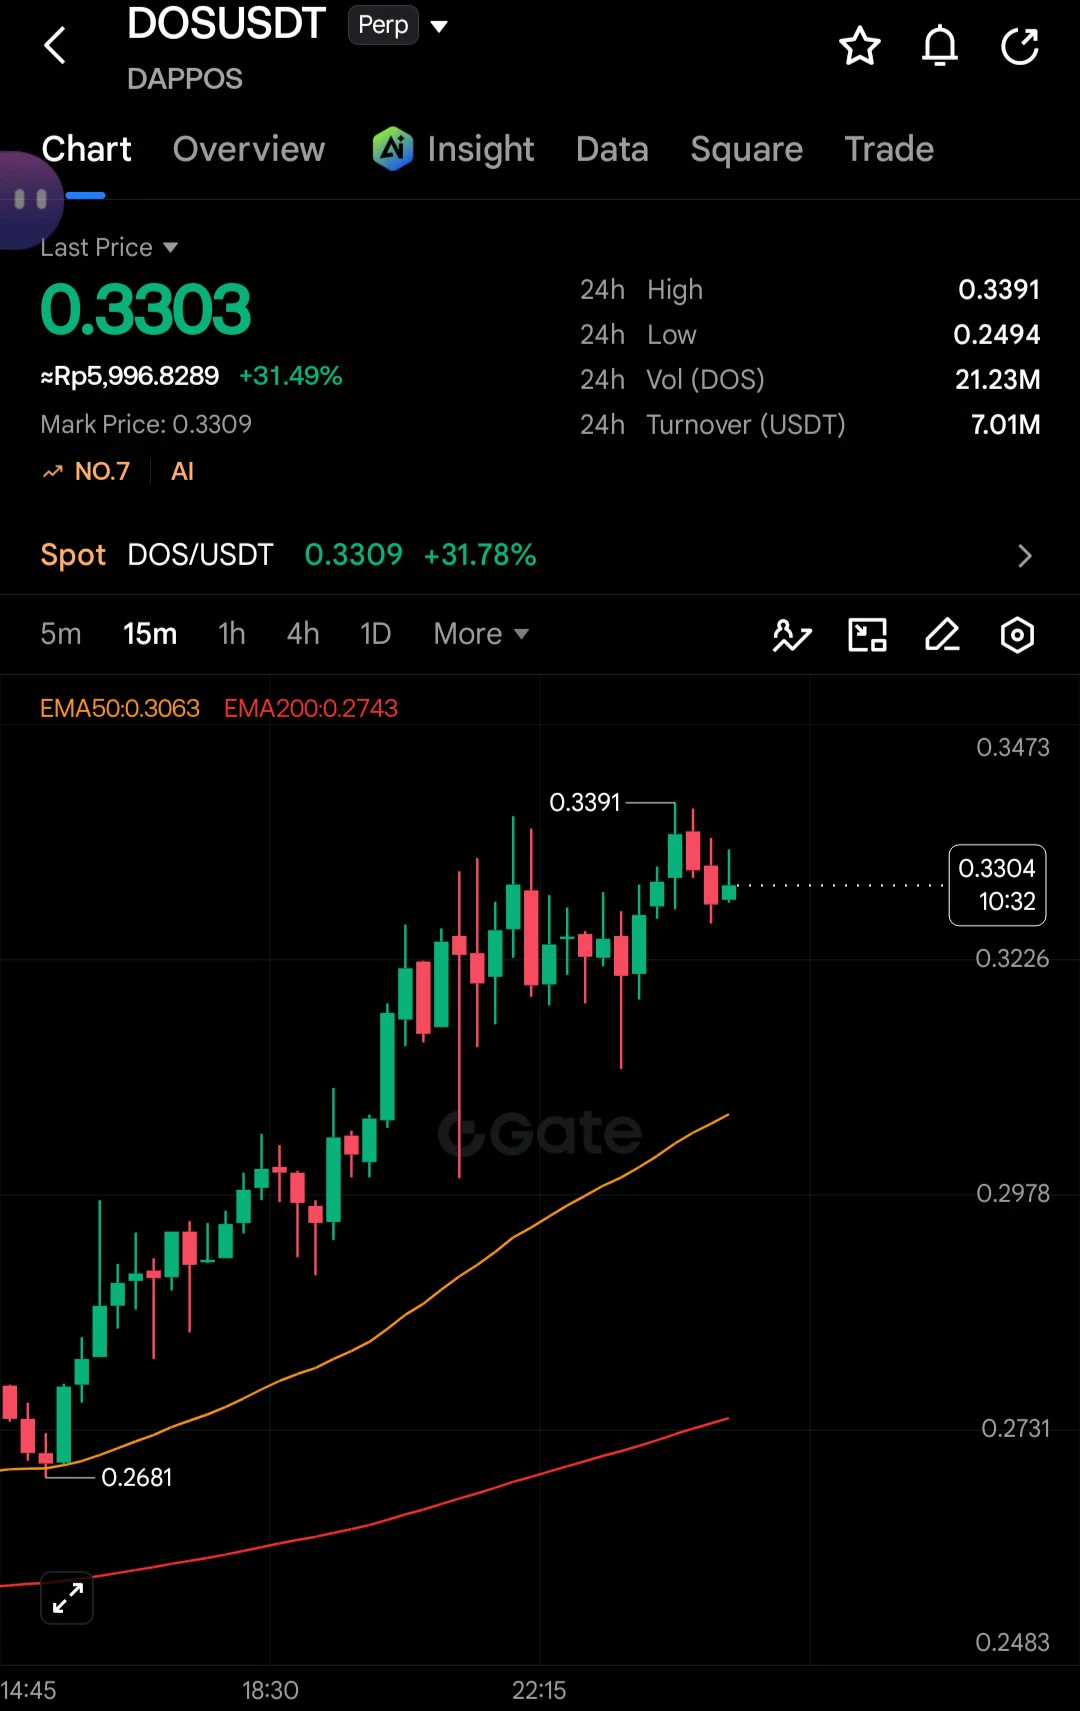
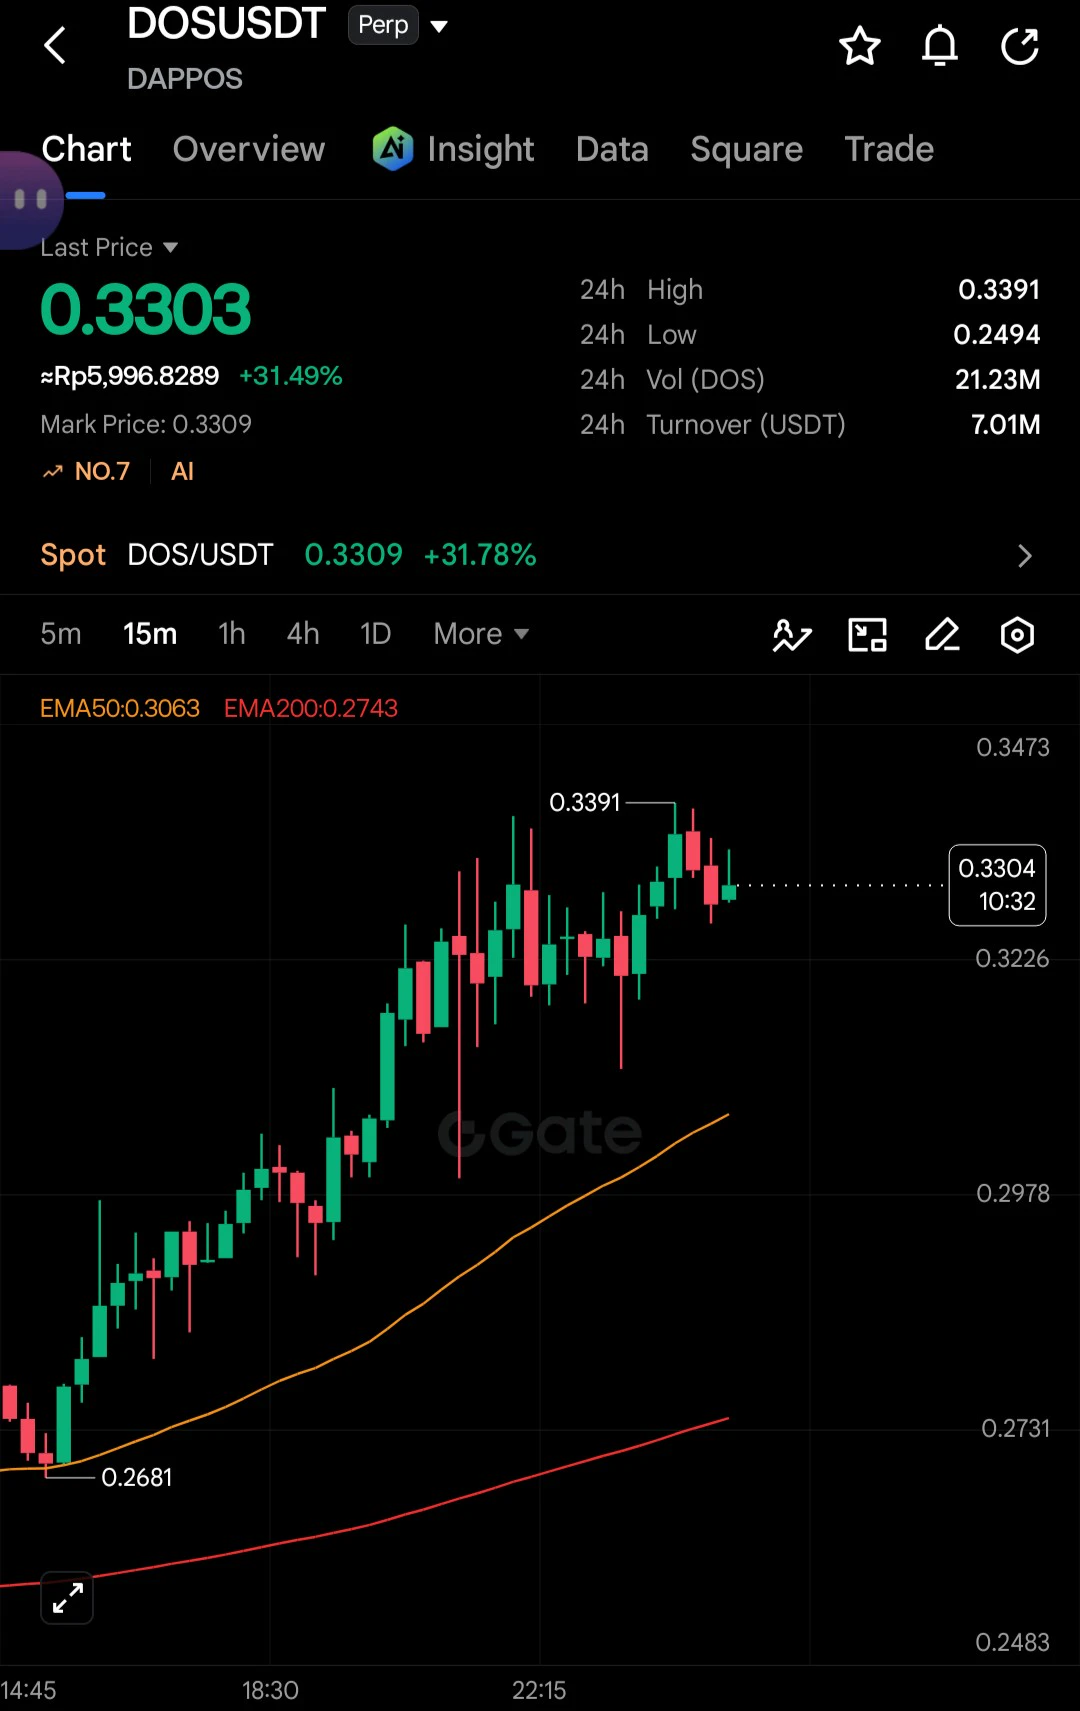
DOS next Target 0.2 😝 remains resilient and holds firm 💪. The previous candle was dumped very deeply.
$DOS
repost-content-media
DOS+14.84%
DOS next Target 0.2 😝 remains resilient and holds firm 💪. The previous candle was dumped very deeply.
$DOS
post-image
DOS+14.84%
  • 3
  • 1
#GateSquareHalloween
Momentum: The daily chart shows a sharp surge from the lower area toward resistance at 0.2568. On shorter timeframes, the price is undergoing a healthy correction after touching that high.
Indicator: The price is above the EMA lines, signaling strong buyer dominance.
Trading Opportunities:
Strategy: Look for buy-on-dip opportunities around the support area or short EMA (around 0.210 - 0.213).
Targets & Risk: Set staggered take-profit targets near 0.256, and limit risk with a stop loss below 0.190 to account for a trend reversal.
$INIT
INIT-1.74%
  • 1
#GateSquareHalloween
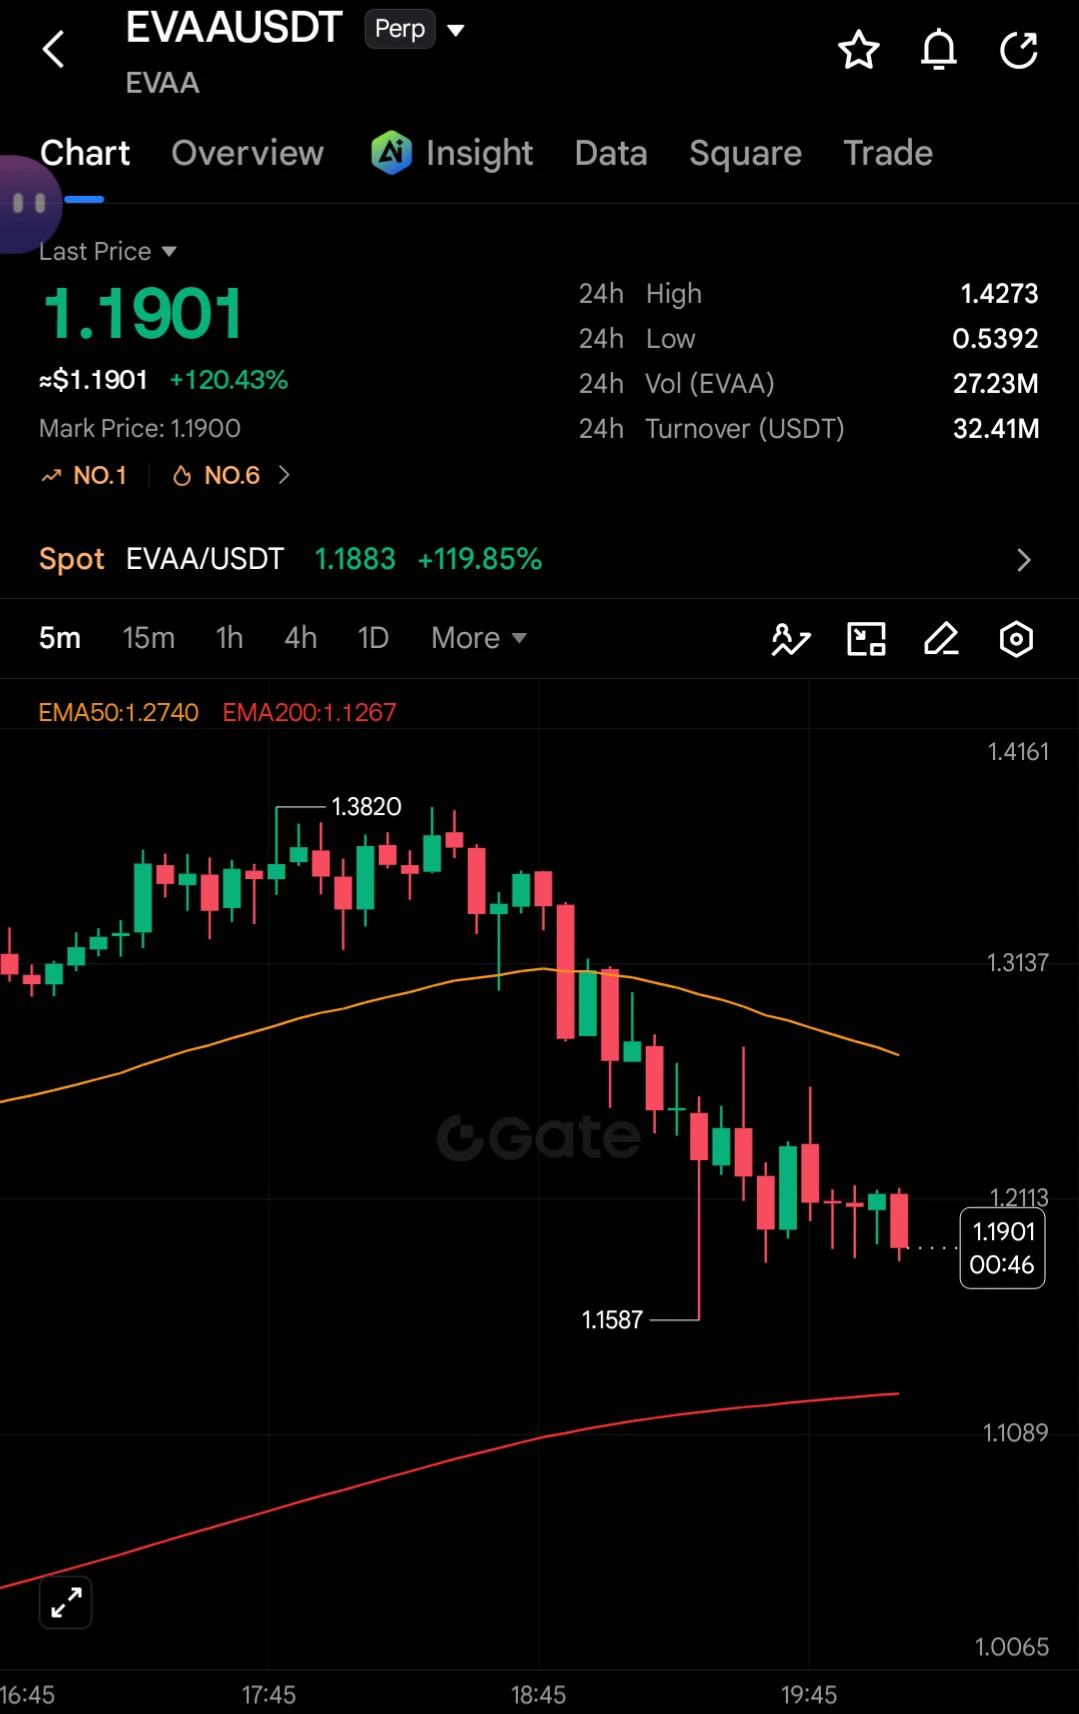
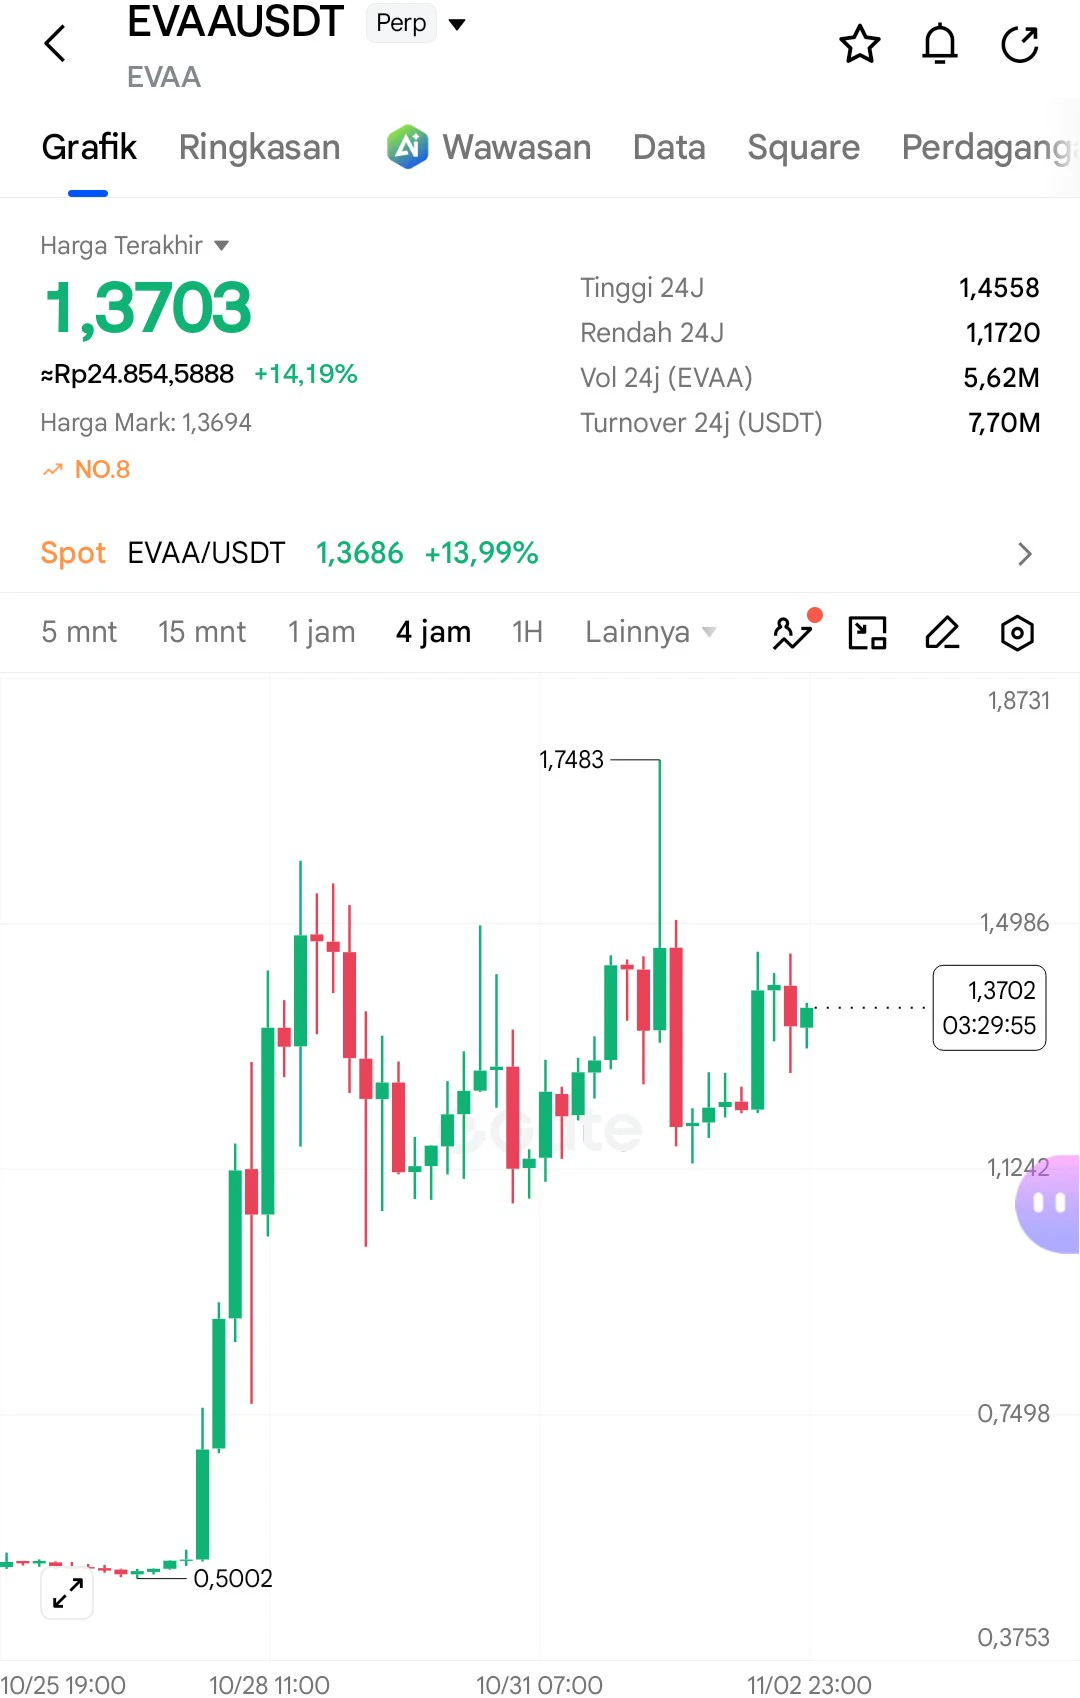
EVAAUSDT is showing a short-term correction trend after a massive price surge of +120,43%, with the daily high reaching 1,4273. The price is currently at 1.1901, trading below the EMA50 indicator and testing the dynamic support area around the EMA200 in the 1.1267 range.
Potential trading opportunities:
Buy on Dip: Look for a reversal signal (rebound) in the 1.12–1.15 support area, with staged profit targets toward 1.30.
Breakdown Short: If the price breaks down below 1.12, anticipate the downtrend continuing.
Always use risk management and a tight stop loss, given
post-image
EVAA-0.42%
  • 1
#GateSquareHalloween
Analysis of APR/USDT. The current price is 0.04677, up +32.46%. The short-term trend shows a healthy correction after reaching the daily high of 0.06085. The price remains above the EMA 50 (0.04193) and EMA 200 (0.03728), indicating that the broader trend is still bullish.
Trading Opportunities:
Buy on Dip: Consider buying in the support area near the EMA 50 or in the 0.04190–0.04300 range if further weakness occurs.
Take Profit (TP): Set staggered take-profit targets in the resistance range from 0.05479 to the previous high of 0.06085.
Stop Loss (SL): Place the risk
post-image
APR-10.63%
  • 1
#GateSquareHalloween
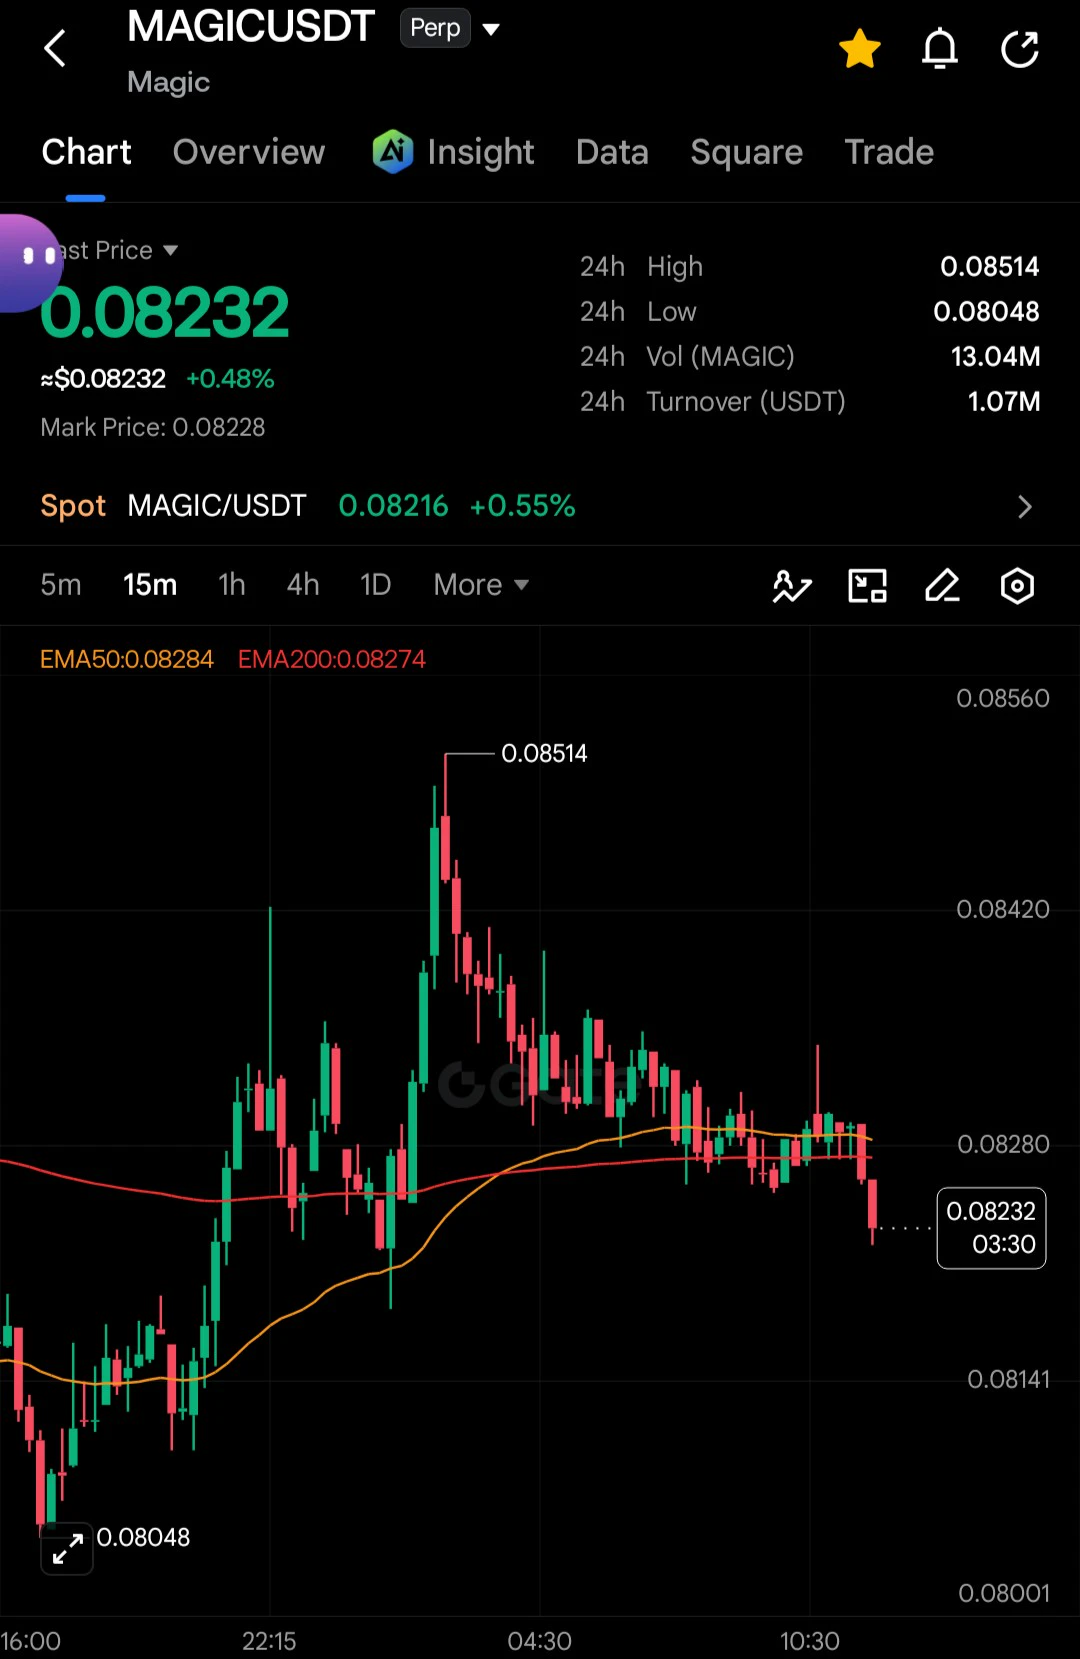
MAGIC/USDT is in a short-term downtrend after touching a high of 0.08514.
​Current Price: 0.08232.
​Indicator Position: Price is moving below EMA50 (0.08284) and EMA200 (0.08274), indicating dominant selling pressure (bearish).
​Support & Resistance:
​Nearest support: 0.08048 (previous low).
​Nearest resistance: EMA area at 0.08274 – 0.08284.
​Summary: The current trend is leaning bearish. If the price fails to hold above the support area at 0.08048, the decline could continue. Conversely, a break above 0.08284 is needed to trigger a price recovery.
$MAGIC
post-image
MAGIC-3.69%
  • 1
#GateSquareHalloween
MAGIC/USDT
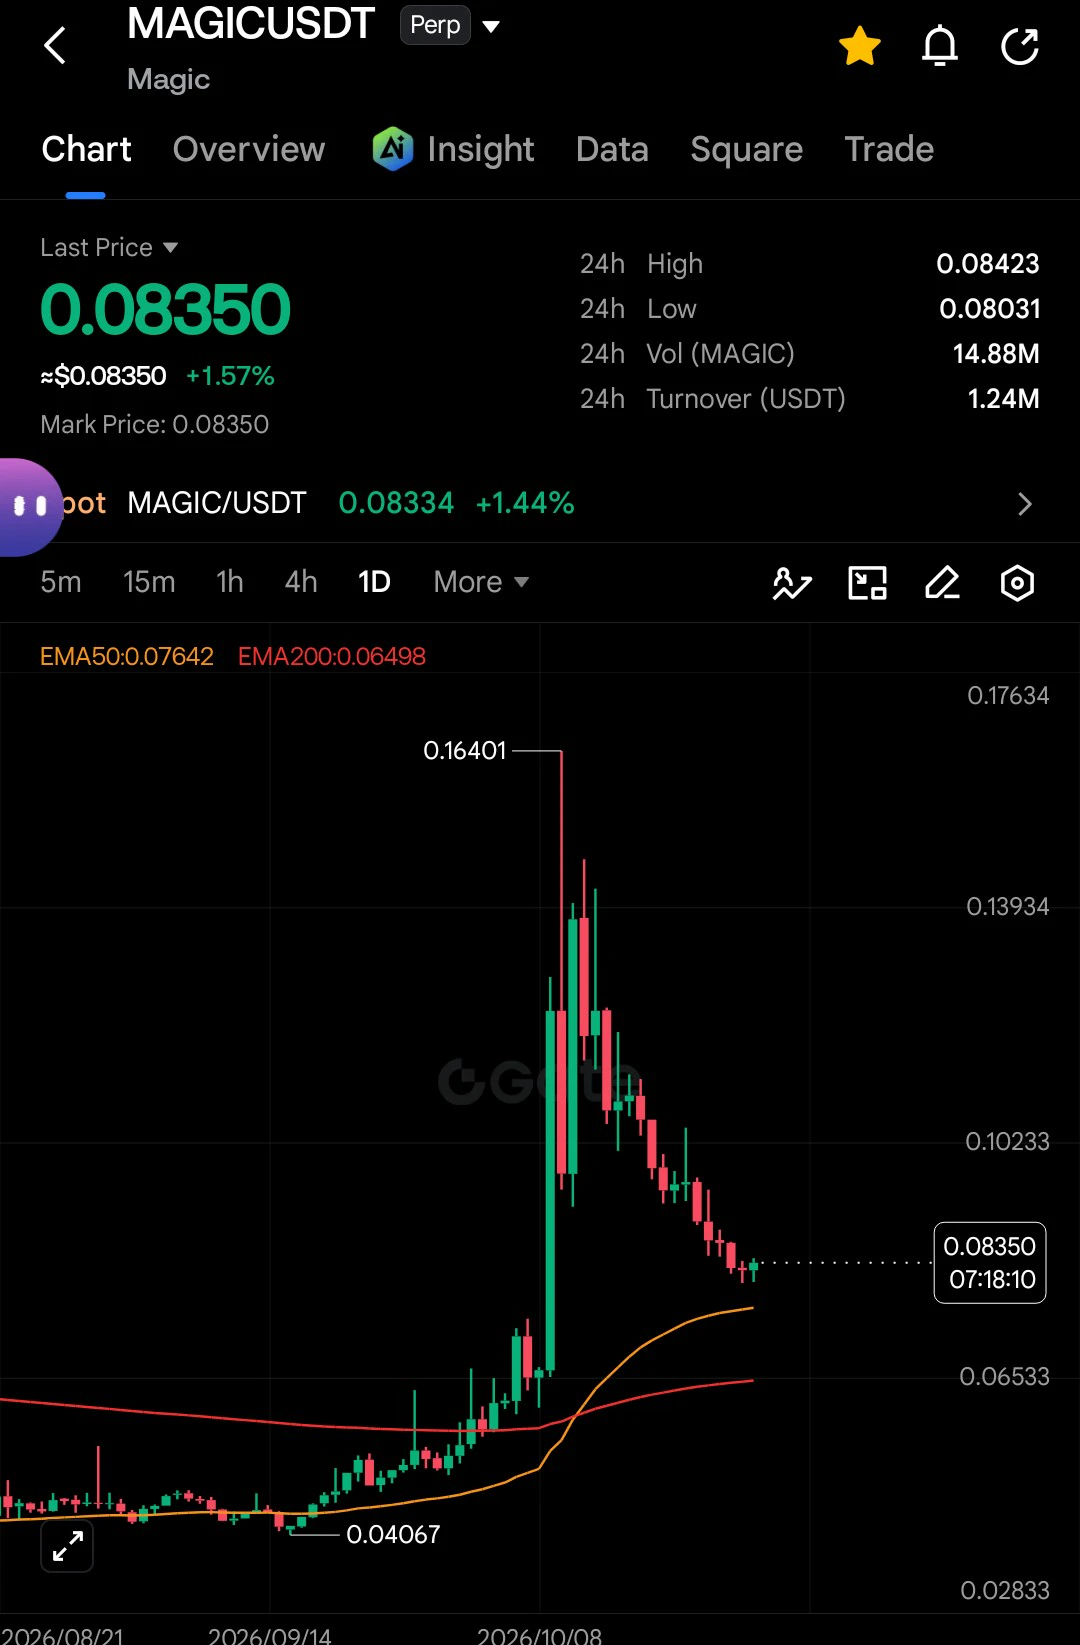
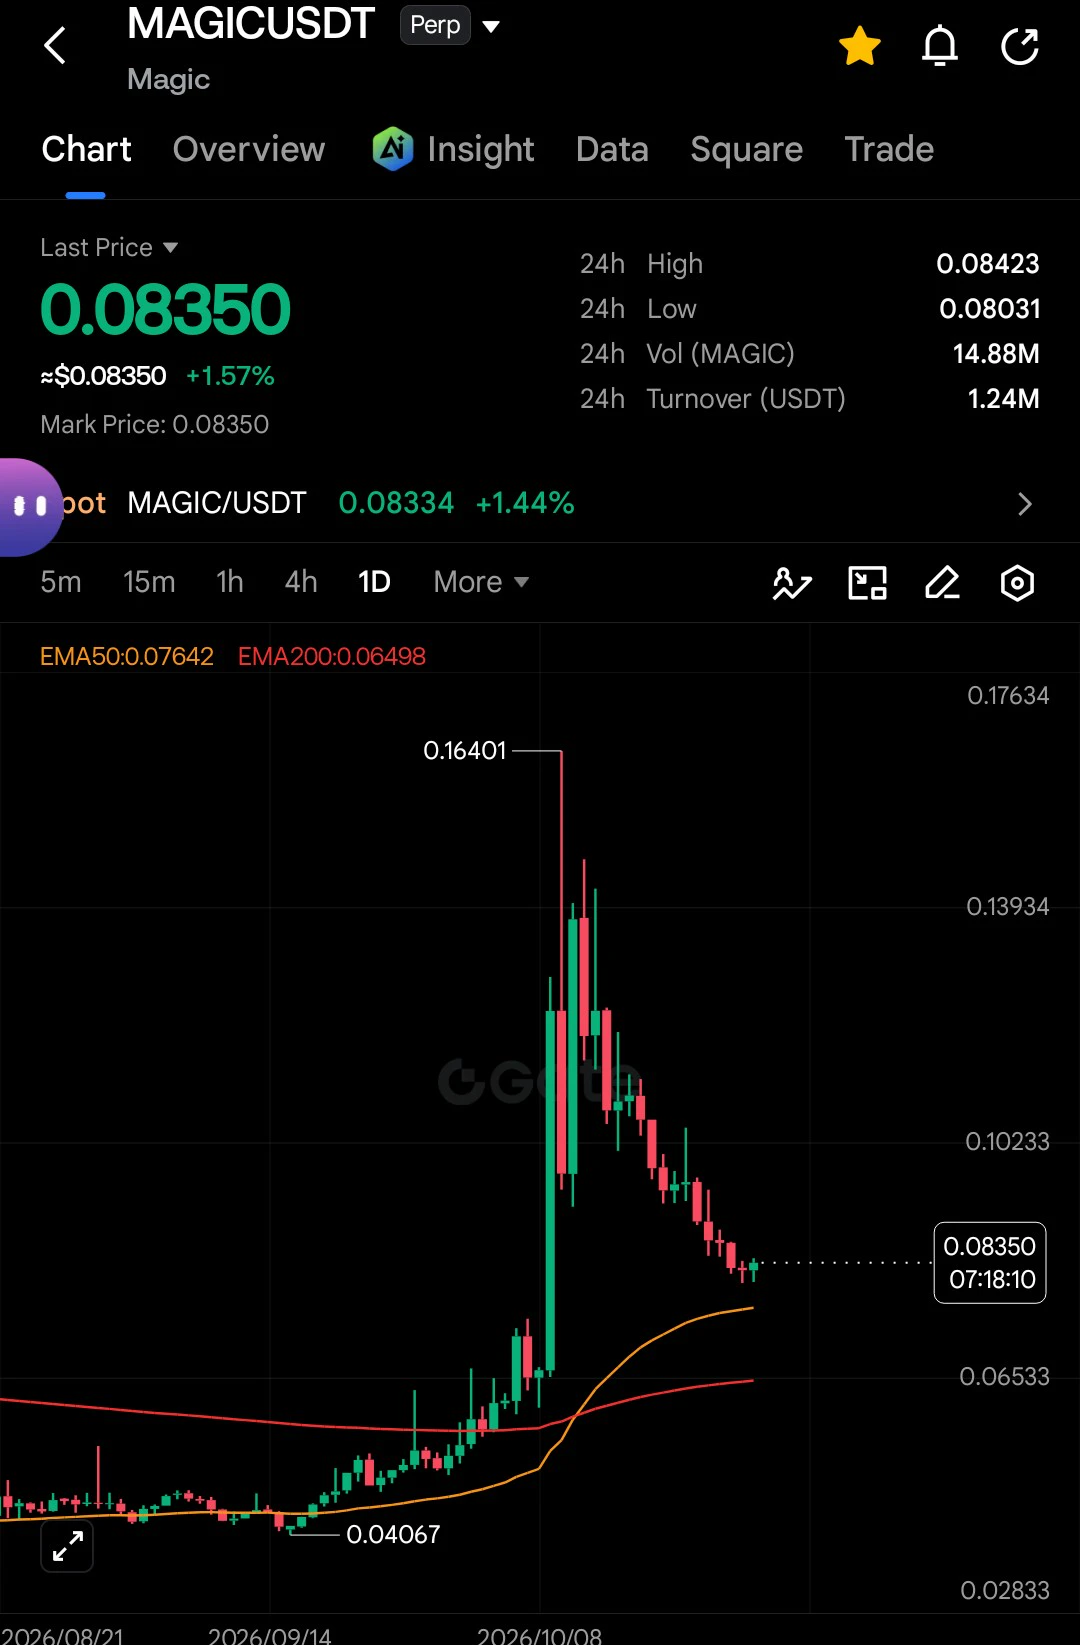
​Trend Analysis: The current price is 0.08350, down sharply from its peak of 0.16401. However, the price is still holding above the EMA 50 (0.07642) and EMA 200 (0.06498), indicating the medium- to long-term trend remains bullish.
​Trading Opportunity: A bounce is possible as the price approaches the EMA 50 dynamic support area.
​Strategy: Consider scaling into a buy around the current area while placing a stop-loss below the EMA 50 to guard against further downside risk. Always manage risk wisely!
$MAGIC
post-image
MAGIC-3.69%
#GateSquareHalloween
ETH/USDT, the short-term trend shows strong bullish momentum after the price bounced from the 2.296 support area. The price is currently at 2.348, holding firmly above the EMA 50 (2.329) and EMA 200 (2.320), and testing daily resistance at 2.354.
​Trading Opportunities:
​Buy/Long: Enter the market on a healthy pullback near the EMA 50 area or the 2.330 level, with a staggered profit target at 2.360.
​Risk Management: Always place a stop-loss below 2.315 to guard against a sudden trend reversal and protect capital from the high volatility of the crypto market.
$ETH
Fun_Trader
#GateSquareHalloween
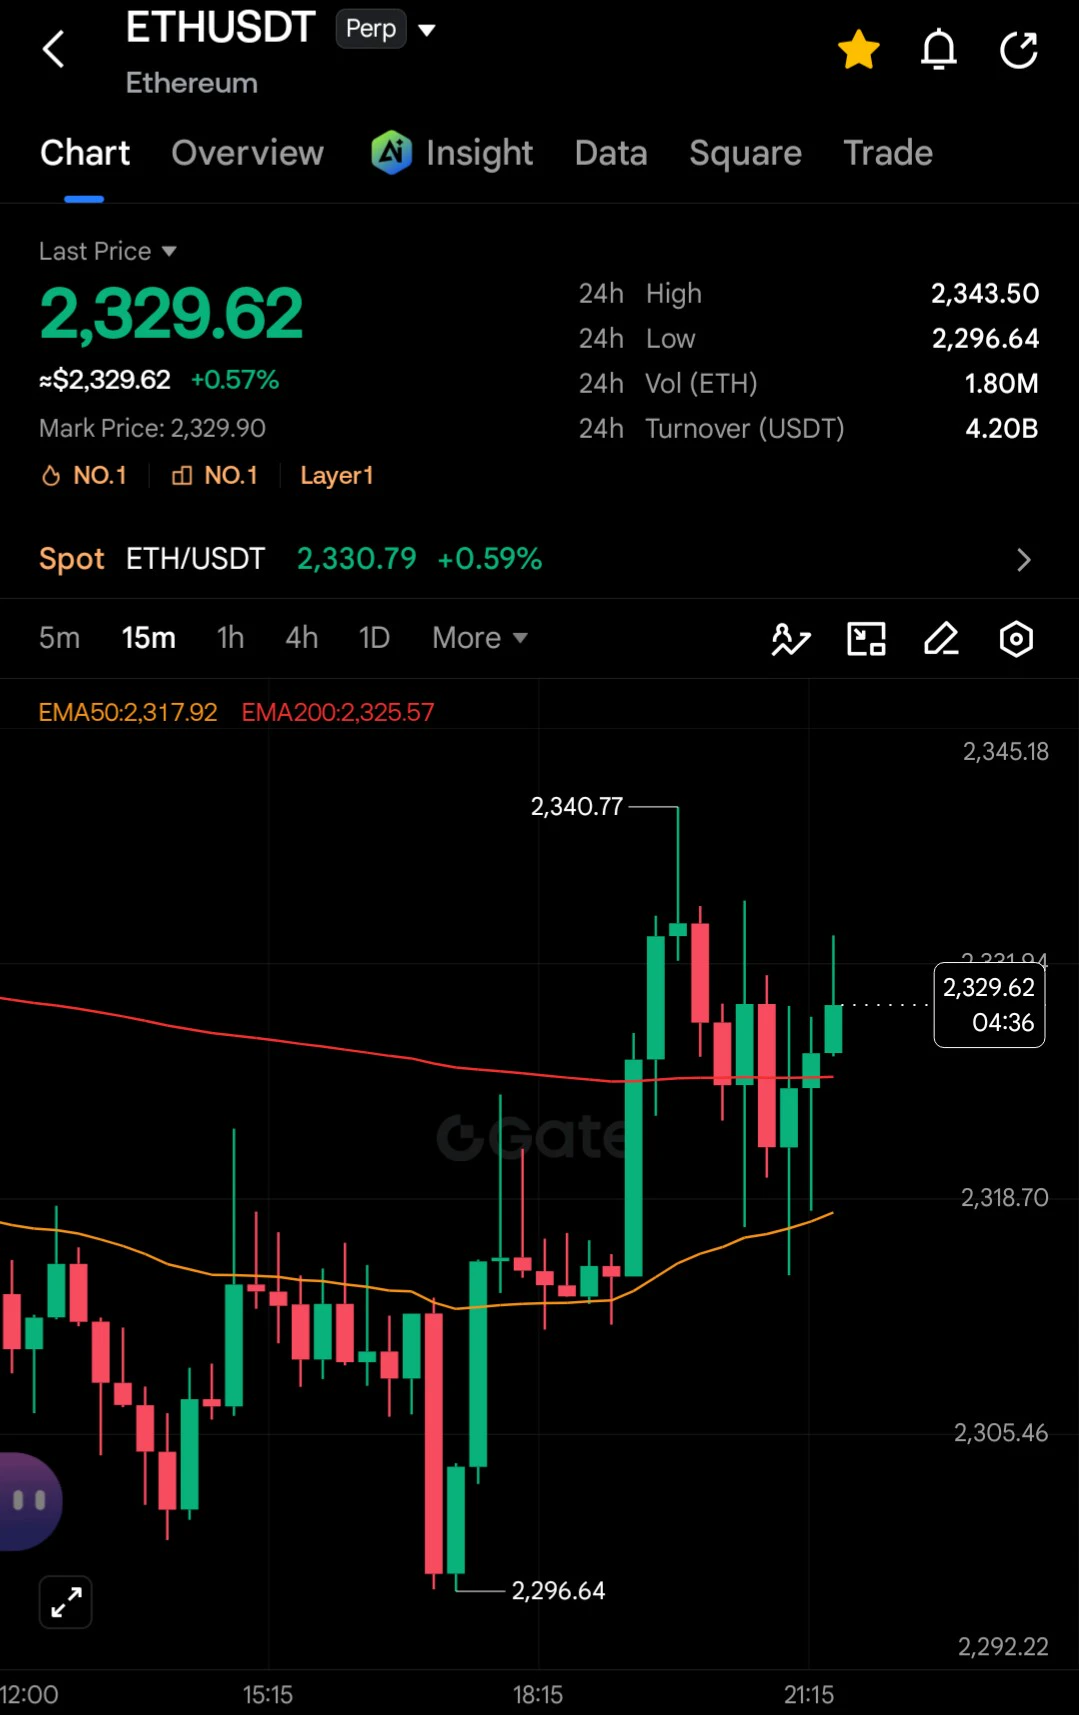
ETH/USDT, the short-term trend shows strong bullish momentum following a surge from 2,296 to 2,340. The price is currently trading at 2,329.62, holding firmly above the EMA 50 (2,317) and EMA 200 (2,325), which are acting as dynamic support.
Trading Opportunities:
Buy/Long: Enter a buy position if the price bounces from the nearest EMA support area.
Take Profit (TP): Target the previous resistance area at 2,340.
Stop Loss (SL): Place protection below 2,315.
Always apply disciplined risk management and a risk-to-reward ratio, given the high volatility on short timeframes.
$ETH
repost-content-media
ETH-1.23%
#GateSquareHalloween
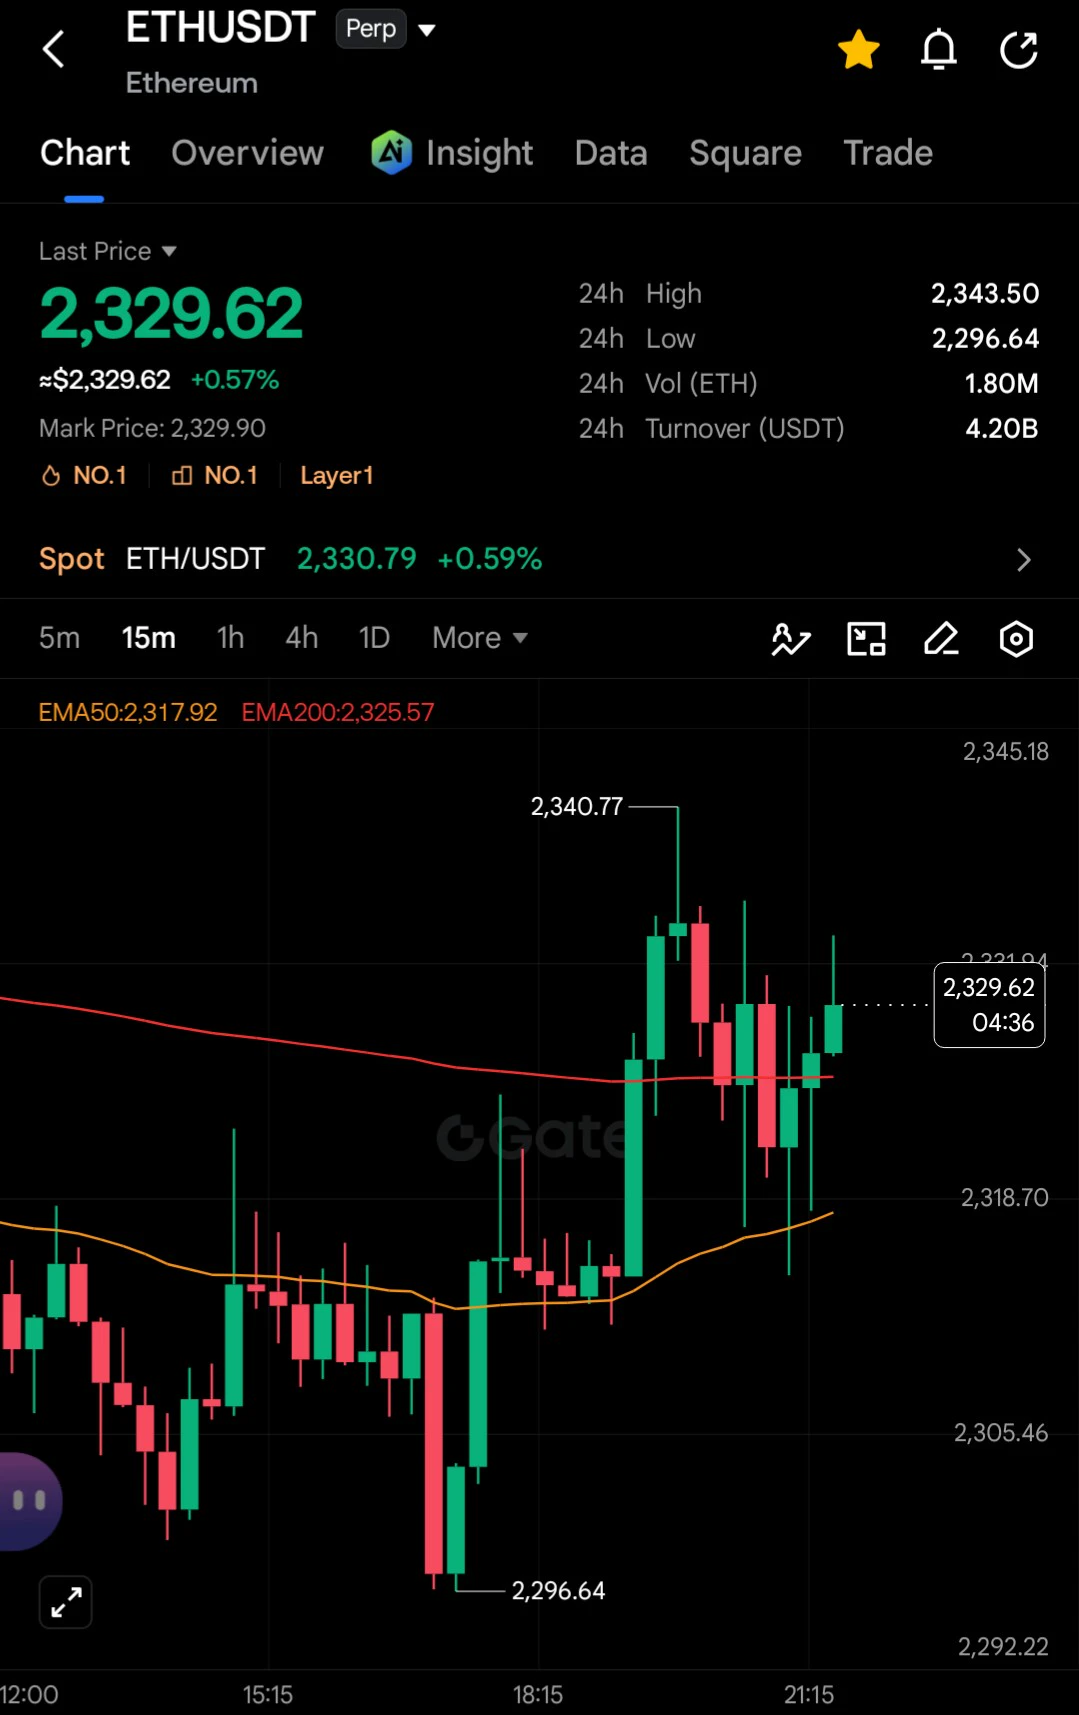
ETH/USDT, the short-term trend shows strong bullish momentum following a surge from 2,296 to 2,340. The price is currently trading at 2,329.62, holding firmly above the EMA 50 (2,317) and EMA 200 (2,325), which are acting as dynamic support.
Trading Opportunities:
Buy/Long: Enter a buy position if the price bounces from the nearest EMA support area.
Take Profit (TP): Target the previous resistance area at 2,340.
Stop Loss (SL): Place protection below 2,315.
Always apply disciplined risk management and a risk-to-reward ratio, given the high volatility on short timeframes.
post-image
ETH-1.23%
  • 1
#GateSquareHalloween
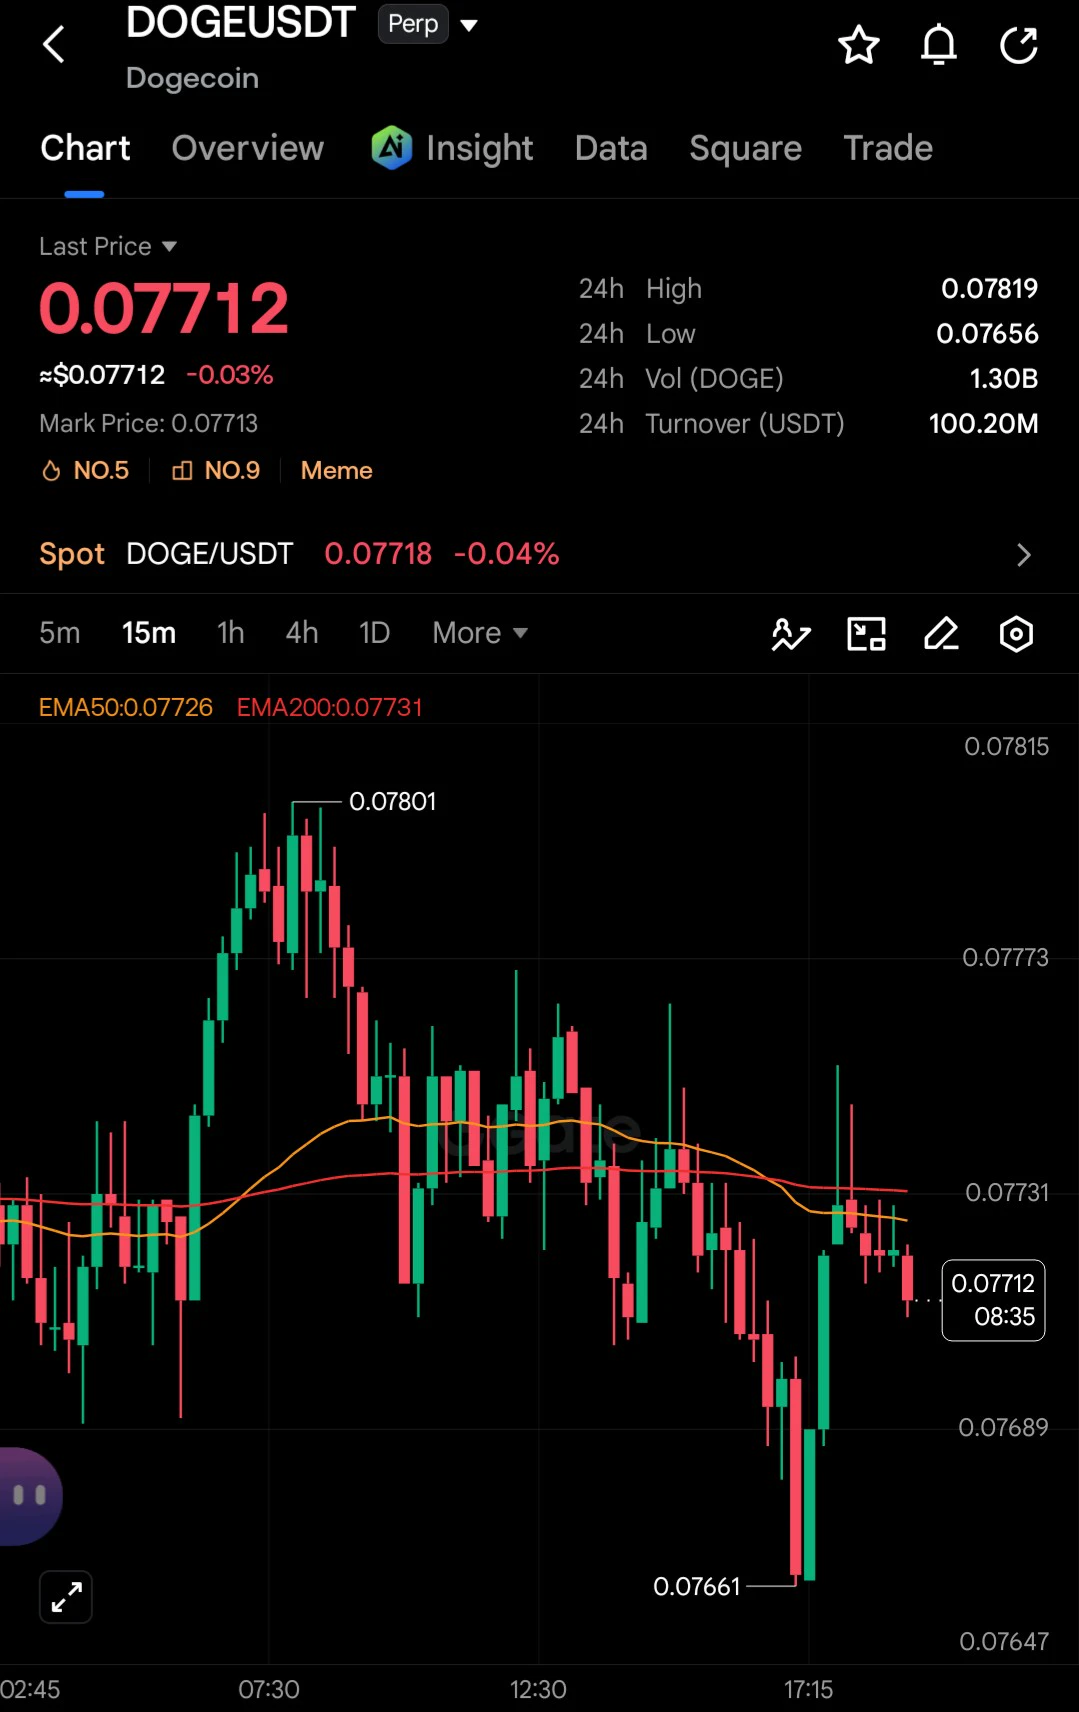
Trading Opportunity Strategy for DOGE/USDT
Strong Support: 0,07656 - 0,07661 area. If the price bounces from here, you can look for a buying opportunity with a nearby target at the EMA around 0,07730.
Resistance: The nearest upper boundary is at 0,07801 - 0,07819.
Risk Management: Always place a stop-loss below the support level to guard against further declines.
$DOGE
post-image
DOGE-0.18%
  • 1
#GateSquareHalloween
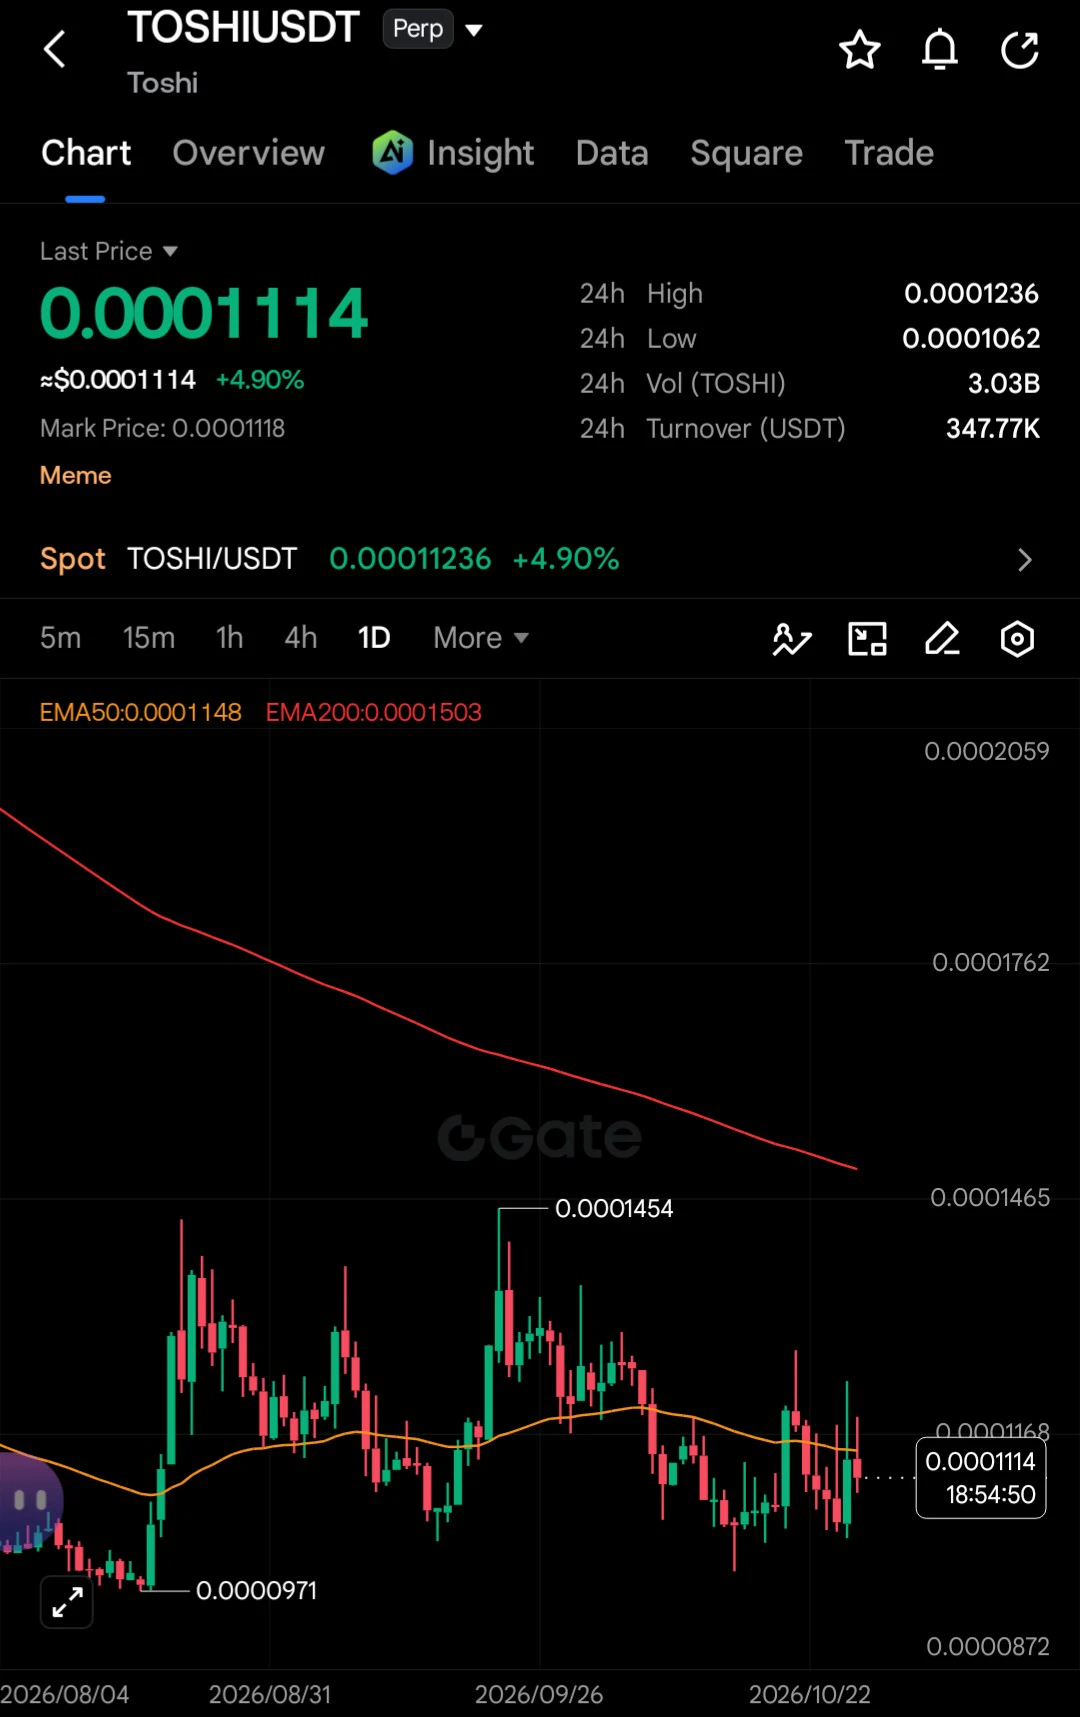
Trading Opportunities & Potential Scenarios
​This asset is classified as a meme token (which has very high volatility), and its long-term trend remains under the shadow of the EMA 200. Here are two potential trading scenarios to consider:
​Scenario A: Breakout Strategy (Bullish / Trend Continuation)
​Condition: Wait for the price to break and close above the EMA 50 line (0.0001148) and move past the upper boundary of the daily range near 0.0001236.
​Entry (Buy): After confirmation of a daily candle breakout above 0.0001150.
​Take-Profit Targets (TP):
​TP 1: 0.0001300
​TP
post-image
TOSHI+0.92%
  • 1
Only scalping, not holding positions for too long because BULLA is very bullish ✅.
#GateSquareHalloween
$BULLA ‌
BULLA+10.92%
  • 3
$ETH ‌
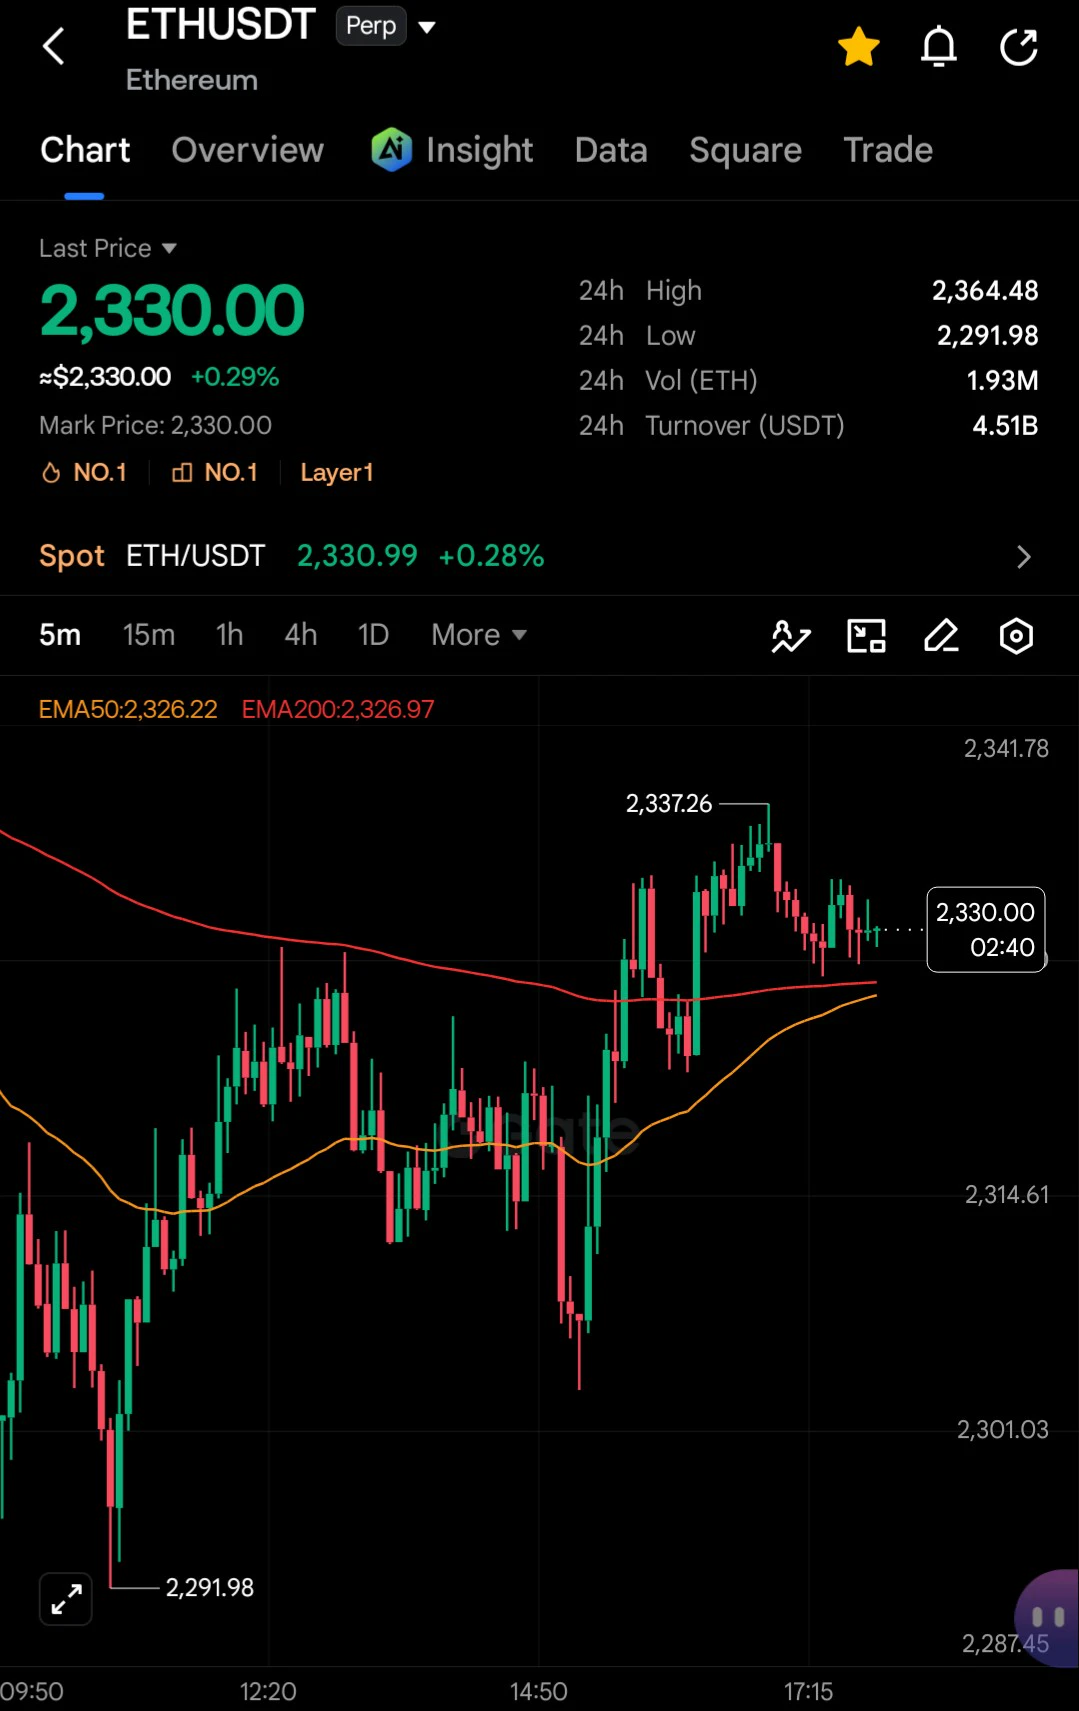
Ethereum is currently trading at 2,330.00, up slightly by +0.29%. The 24-hour price movement recorded a low of 2,291.98 and a high of 2,364.48, accompanied by trading volume of 1.93 million ETH.
​The EMA50 (2,326.22) and EMA200 (2,326.97) are converging closely, indicating that the market is in a consolidation or sideways phase with no dominant trend. The price sitting slightly above both EMA lines signals short-term neutral-to-bullish momentum. Traders are advised to wait for a confirmed breakout from this price range before opening new positions.
#GateSquareHalloween
#ShareWeekly
post-image
ETH-1.23%
  • 1
Load More