
Share your thoughts
placeholder
Article
I wasn't even expecting to break even, but it directly put me in profit. This service really came through🙏. Held $LINK from 11.416 all the way to 12.761, +834.7%. All that waiting was worth it—really worth it.

The last thing I saw before bed was the market still grinding sluggishly, and I was honestly a little nervous too. But bottom consolidation is the most honest signal: funds were quietly accumulating, not buying blindly. So I didn't hesitate much—I placed a long order as planned and waited for the market to give me an answer. It really did, and rather forcefully.

I closed 75% of the
post-image
LINK+2.79%
BNB-1.49%
ADA-0.27%
Now that’s Called the Breaking News @fomo has surpassed @Pumpfun to become the #1 revenue-generating protocol on $SOL ANA in the last 24 hours,
post-image
SOL-1.61%
🚀 Gate Launches Trenches — On-Chain Trading Just Got Easier!
Gate has officially launched Trenches, a new on-chain trading product designed to bring Meme & emerging on-chain assets closer to traders. 🔥
💥 Key Highlights:
• 🟢 0.5% trading fee on both Buy & Sell
• ⛽ Limited-time ZERO GAS FEES for trading Robinhood Chain assets
• 🌐 Multi-chain support
• 📊 Real-time market data & charts
• 🧠 Social trading features, including Callout & KOL leaderboards
• ⚡ Find a token, check the market, and trade directly
The zero-gas promotion is available for a limited time, making this an interesting oppo
post-image
MEME-0.05%
MULTI-16.41%
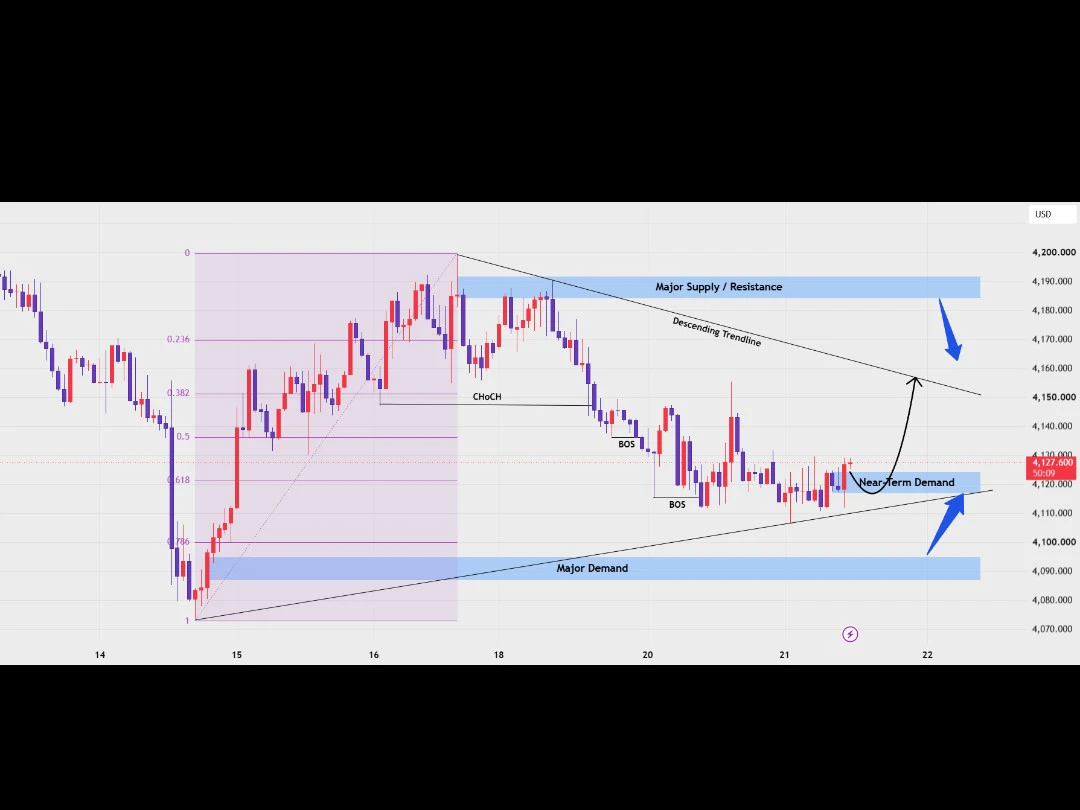
Insiders are quietly stacking shorts on $XAU /USDT while the 1h price holds a suspiciously flat range.

$XAU /USDT - SHORT

Trade Plan:
Entry: 4411.58 – 4417.00
SL: 4440.26
TP1: 4394.81
TP2: 4381.82
TP3: 4362.35

Why this setup?


Debate:
Are we about to sweep 4456 and trap the shorts, or is this range about to explode downward?

⚠️ Personal market analysis only. NFA — manage risk and DYOR.
Educational content, not investment advice or a recommendation to buy, sell, deposit, or withdraw any asset. No paid promotion or referral/affiliate links.
XAU-0.37%
I didn’t even do anything—I just went to the bathroom, and when I came back, the candlestick chart had already done the work for me. A few days ago, I was still watching the market before bed. $DELL had spent most of the day grinding without breaking below my entry price, with the key level at 453.65 holding firmly and funds quietly flowing in. This kind of bottoming consolidation is the easiest time to trick people into selling; I chose to hold steady.
When I opened the charts this morning, it had jumped straight to 525.22, bringing my unrealized profit to +760.31%. The sleepless nights paid
post-image
DELL+0.06%
ETH-0.35%
SNDK-0.10%
Insiders are watching $LINK /USDT squeeze past 12.80 with quiet confidence.

$LINK /USDT - LONG

Trade Plan:
Entry: 12.695 – 12.801
SL: 12.241
TP1: 13.129
TP2: 13.382
TP3: 13.763

Why this setup?
Why now? The daily trend is bullish, the 1h ATR of 0.211428 signals expanding volatility, and the 15m RSI at 30.93 shows oversold relief. The entry zone sits between 12.695 and 12.801, targeting TP1 at 13.129 and TP2 at 13.382, with the 1h price currently at 12.748. Invalidation is drawn hard at 11.747, which is the line in the sand that protects the long bias.

Debate:
Are we hitting TP2 or getti
LINK+2.79%
Insiders are watching $ZEC /USDT like a hawk right now.

$ZEC /USDT - LONG

Trade Plan:
Entry: 1156.80 – 1168.38
SL: 1106.97
TP1: 1204.31
TP2: 1232.12
TP3: 1273.84

Why this setup?
Why now? The daily trend is bullish with high conviction, the 1h price sits at 1162.59 inside a tight entry zone, the 15m RSI at 48.0 shows room to run without being overbought, and the 1h ATR of 23.18 confirms active volatility. Target 1 is 1204.31, target 2 is 1232.12, and the invalidation level of 971.33 acts as the hard line in the sand protecting the long.

Debate:
Are we heading to TP2 at 1232.12 or is 971
ZEC-5.30%
BTC, Gold, and Crude Oil Analysis
live-cover
LIVE2,557
I was just about to go to the forum and rant, but then I saw my balance and thought, never mind—the market is always right.
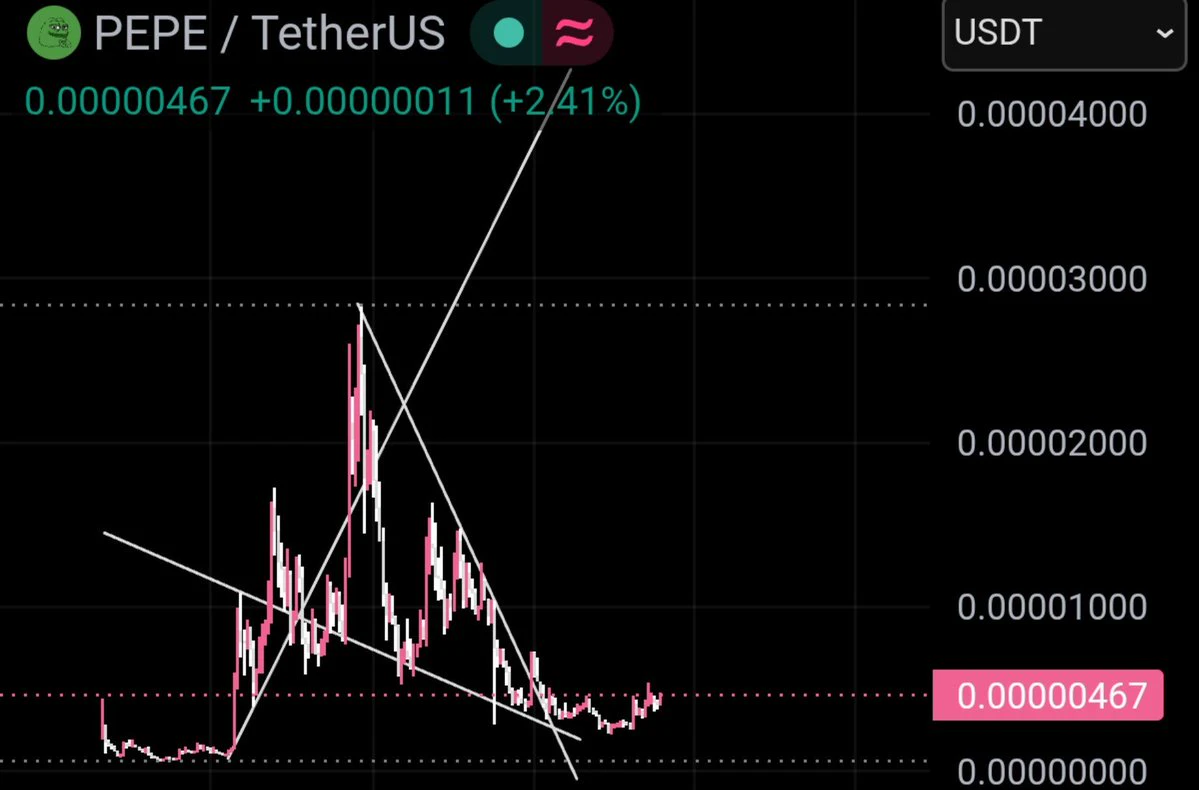
When I opened the charts this morning, while the whole screen was still flashing green, $PEPE had already stopped falling. Being unable to drop further is the best signal. It kept grinding at the bottom, but every sell-off was absorbed. I made it clear at the time: at this level, stop scaring yourself. Wait for it to stabilize before making a move.
Looking back now, I’m really glad I took a second look. From 0.000003539 to the current 0.000003611, this long position has
post-image
PEPE+0.42%
SOL-1.65%
ETH-0.35%
$ACE
UPDATE
#ACE is getting a good support here. In this move we can see 100%+ gain here ✍🏻
#ACEUSDT #ACEBTC #BTC #Bitcoin #NFTs
post-image
ACE+16.23%
BTC-0.93%
$1000 to $100,000 Crypto Trade Challenge Today
live-cover
LIVE1,556
During the early session, the price pulled back to around 140.53 and stabilized, so I went long directly. The plan is simple: as long as the hourly candle body does not break down, the upside target is the high-volume trading zone, with the stop-loss placed simultaneously.

After entering, it consolidated for a short while, with one wick in between, but I held the position. Once the hourly candle closed bullish again and pushed upward on increased volume, I took 70% off at the first target, and moved the stop-loss on the remaining position directly above the breakeven line.

The subsequent m
post-image
SOL-1.65%
BNB-1.49%
Nobody is talking about the SYMBOL setup hiding in plain sight right now.

$CL /USDT - SHORT

Trade Plan:
Entry: 92.22 – 92.44
SL: 93.39
TP1: 91.53
TP2: 91.00
TP3: 90.20

Why this setup?
Why now? The 1h price sits at 92.33 inside a tight entry zone between 92.22 and 92.44, and the daily trend is range-bound, which means a directional breakout is overdue. The 15m RSI reading of 48.15 shows neither overbought nor oversold, leaving room for a sharp move lower. With the 1h ATR at 0.44283, the average candle size tells us the next leg down could easily sweep past the first target at 91.53 and re
CL+0.58%
A hand that set the stop-loss a few days ago trembled slightly; this morning I realized that filial concern was unnecessary. 😂

The last thing I saw before bed a few days ago, $UNI was still bottoming around 5.766, but it just wouldn’t break down, and funds were clearly entering quietly. Without a second thought, I directly opened a long position. 🤔

When I opened the chart this morning, it had reached 6.953, +1461.74%. That little tremor from a few days ago has all been made up today. This long position was truly worth waiting for—the profits feel great. Keep an eye on the profits, broth
post-image
UNI-2.50%
ETH-0.35%
ZEC-5.30%
Nobody is talking about the 1h RSI reading that changes the $SOL /USDT game

$SOL /USDT - SHORT

Trade Plan:
Entry: 103.72 – 104.16
SL: 106.02
TP1: 102.38
TP2: 101.34
TP3: 99.78

Why this setup?
Why now? The 1h price is sitting at 103.94, right on the entry_ref level, which means the setup has just armed itself at the top of the 1h ATR range of 0.867223. The daily trend is range-bound, so we are not chasing a breakout but fading a range top with a 15m RSI of 45.49 confirming bearish momentum. The target stack gives a clear path from TP1 at 102.38 down to TP2 at 101.34 and TP3 at 99.78, offe
SOL-1.65%
This trend is so obvious I don't even need to think—the account is bouncing around on its own. 😎

With green covering the entire screen, I saw that $MAGMA 's rebound couldn't even bring in volume. The rebound was weak, and buying support at the highs was far too poor. This kind of weak bounce just gives the bears an opportunity, so I opened a position around 0.28292.

Looking at the market again just now, the current price has already reached 0.24011, and a +297.93% return is in the bag. Feeling great, brothers.

But making profits without knowing how to protect them is useless. First lock
post-image
MAGMA-7.47%
BTC-0.95%
SOL-1.65%
$AKE broke above its previous high but did not accelerate immediately, instead quickly pulling back. I treated the breakout level as a key reference level and entered long when the pullback held above it. This was a standard breakout-and-retest confirmation; as long as this level holds, the logic remains unchanged.

After entry, the price did not continue pulling back and instead rallied directly. During the first surge, I took profit on 70% as planned, while gradually moving the stop-loss higher on the remaining 30% to let the profits run.

The biggest taboo during this process is frequentl
post-image
AKE+25.12%
SNDK-0.10%
ZEC-5.30%
Bitcoin miners have hit pause on selling! 🛑 After a $30B pivot to AI, they're tightening supply, with a 15% drop in hashrate. What does this mean for $BTC 's price? #CryptoNews 💰
BTC-0.93%
I didn’t chase the first leg of that drop just now, as the breakdown moment is when fake moves are most common. I’ll only enter short after the price rebounds to below the former platform, with the stop-loss above the platform—that’s when the risk-reward ratio is worth trying.
The decline after entry wasn’t particularly smooth; a false-breakout-style rebound occurred midway and nearly swept the protective stop. Once the first target was reached, I took 80% off the table, moved the protection up on the remaining position, and didn’t fight the trade.
The remaining position was fully closed durin
post-image
BNB-1.49%
ZEC-5.30%
$INJ has reached a major decision point after a strong recovery from the $4.60 area.
Price is now testing the $5.80–$6.00 zone, so confirmation matters here.
A clean breakout and hold above $6.00 could open the move toward $6.30 → $6.60.
But rejection from this zone could trigger a pullback toward $5.50 → $5.20.
For now, momentum is bullish, but this is the level that decides the next move.
Long $INJ ‌
post-image
INJ+22.06%
Load More

Join 40 M users in our growing community

⚡️ Join 40 M users in the crypto craze discussion

💬 Engage with your favorite top creators

👍 See what interests you

View More