
Square
Following
Hot
News
Profile
Share your thoughts
placeholder
Article
$ETH A $28 billion bloodbath! A whale cut losses by $13.45 million—will the main force “kill shorts” or “bury longs” this time?
Bull markets often see sharp drops; don’t mistake a whale’s “desperate retreat” for the “charge signal” to buy the dip!
Personal view: ETH plunged to 2313 on the one-hour chart before rebounding in a deep V, currently at 2438. Combined with the liquidation chart, $280 million was liquidated over 24 hours, mainly longs, with the largest single liquidation at $11.84 million! Looking at fund flows, there was a net outflow of $53.42 million over one hour, but net inflows
ETH+3.13%
#美国9月PPI大超预期
U.S. September PPI Comes in Much Hotter Than Expected — What Does It Mean for the Market?
Recently, I have been paying close attention to U.S. economic data because I believe inflation is one of the biggest factors influencing the direction of financial markets. The latest September Producer Price Index (PPI) report has caught my attention, as producer prices increased much more than economists expected.
According to the reported figures, U.S. PPI rose 1.3% month over month in September, while the annual increase reached 6.3%. The monthly increase was the largest since March 202
market updates on today $BTC & $XAU
live-cover
LIVE1,525
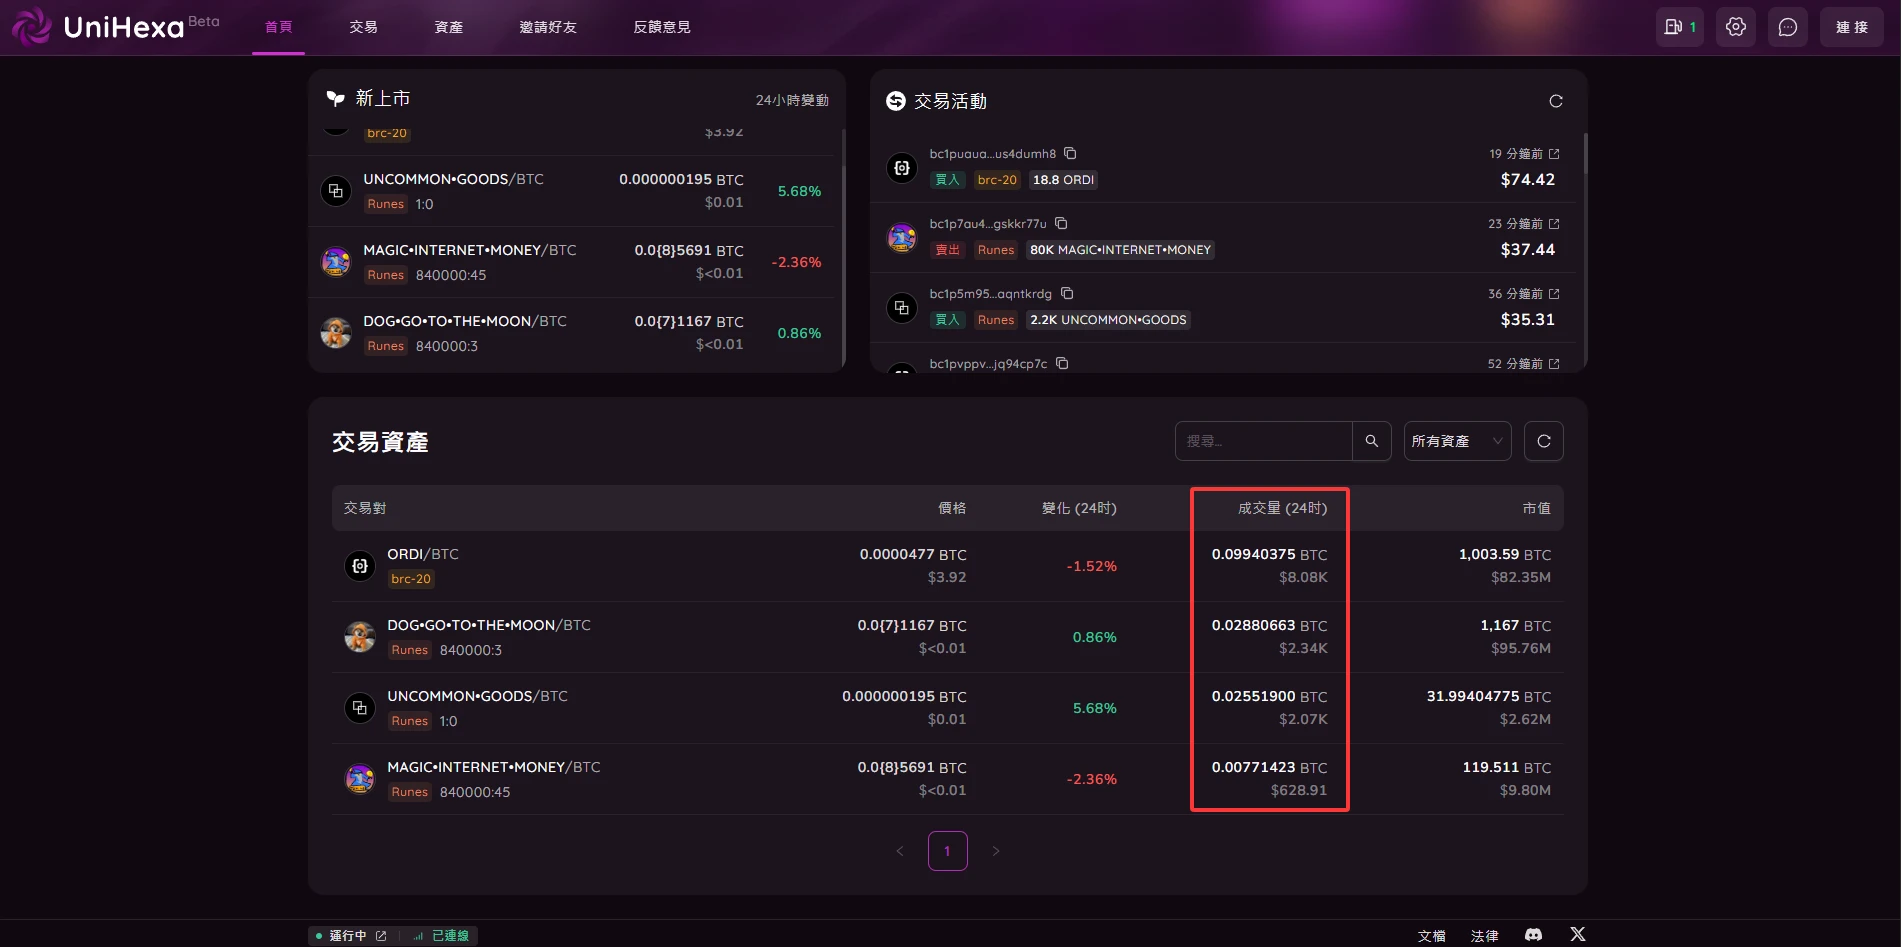
On October 1, I specifically took a screenshot of UniHexa. At the time, the combined 24H trading volume of the four trading pairs was only 0.0538 BTC, approximately $4.49K. I checked again today, and the total trading volume had reached 0.1614 BTC, approximately $13.12K, nearly three times that of October 1. Breaking it down, all of the pairs saw growth: ORDI rose from 0.0312 BTC to 0.0994 BTC; DOG rose from 0.0112 BTC to 0.0288 BTC; UNCOMMON rose from 0.0114 BTC to 0.0255 BTC; and MIM, which had zero volume that day, rose to 0.0077 BTC. So this growth was not entirely driven by a sudden surge
post-image
BTC+1.10%
FB-0.12%
We're finally seeing cars just like they appeared in movies about the future!
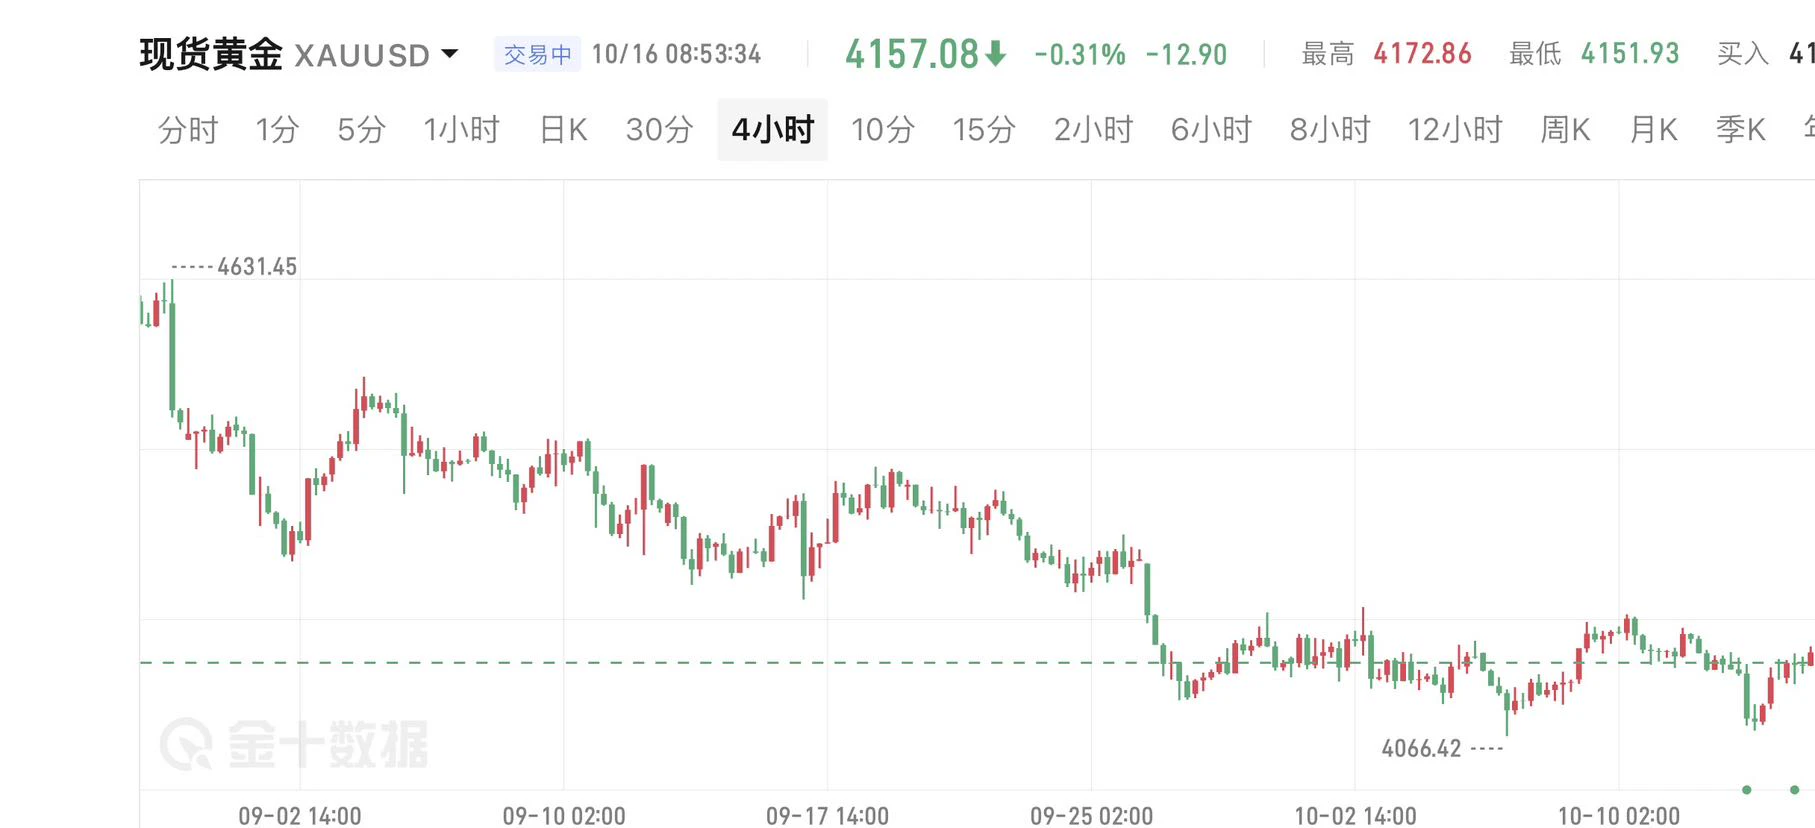
Gold, once again at a critical juncture, with bulls and bears battling
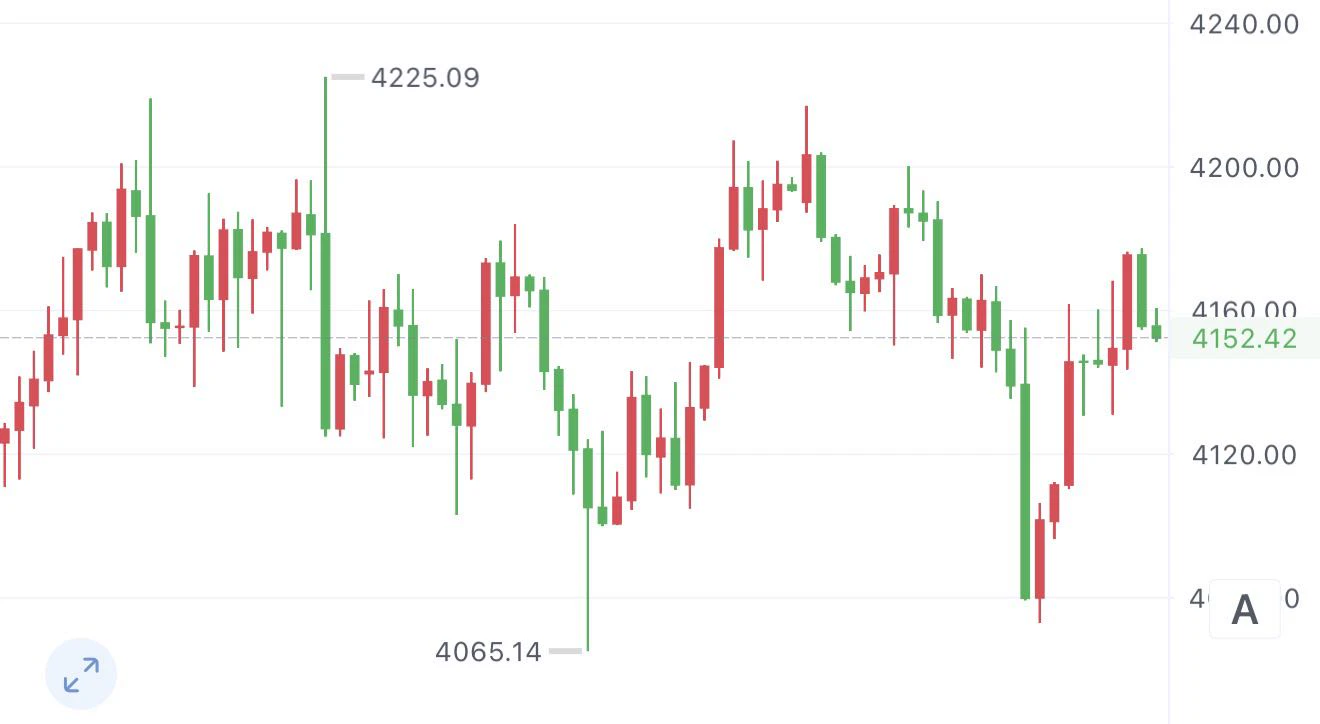
Yesterday, it fell from 4160 to 4130, and the strategy also called for shorting at 4160. The rhythm over the past two days has been a rebound after a decline. The intraday rebound has already recovered all losses, in line with the view of looking for a decline first and then a rise.
Today is Friday, once again a critical moment at a key level. Watch the major 4200 level and whether the price can break above the strong resistance zone at 4200-20. If it breaks above, the bulls will take over. Until it breaks above, follow yes
post-image
XAU+0.44%
  • 1
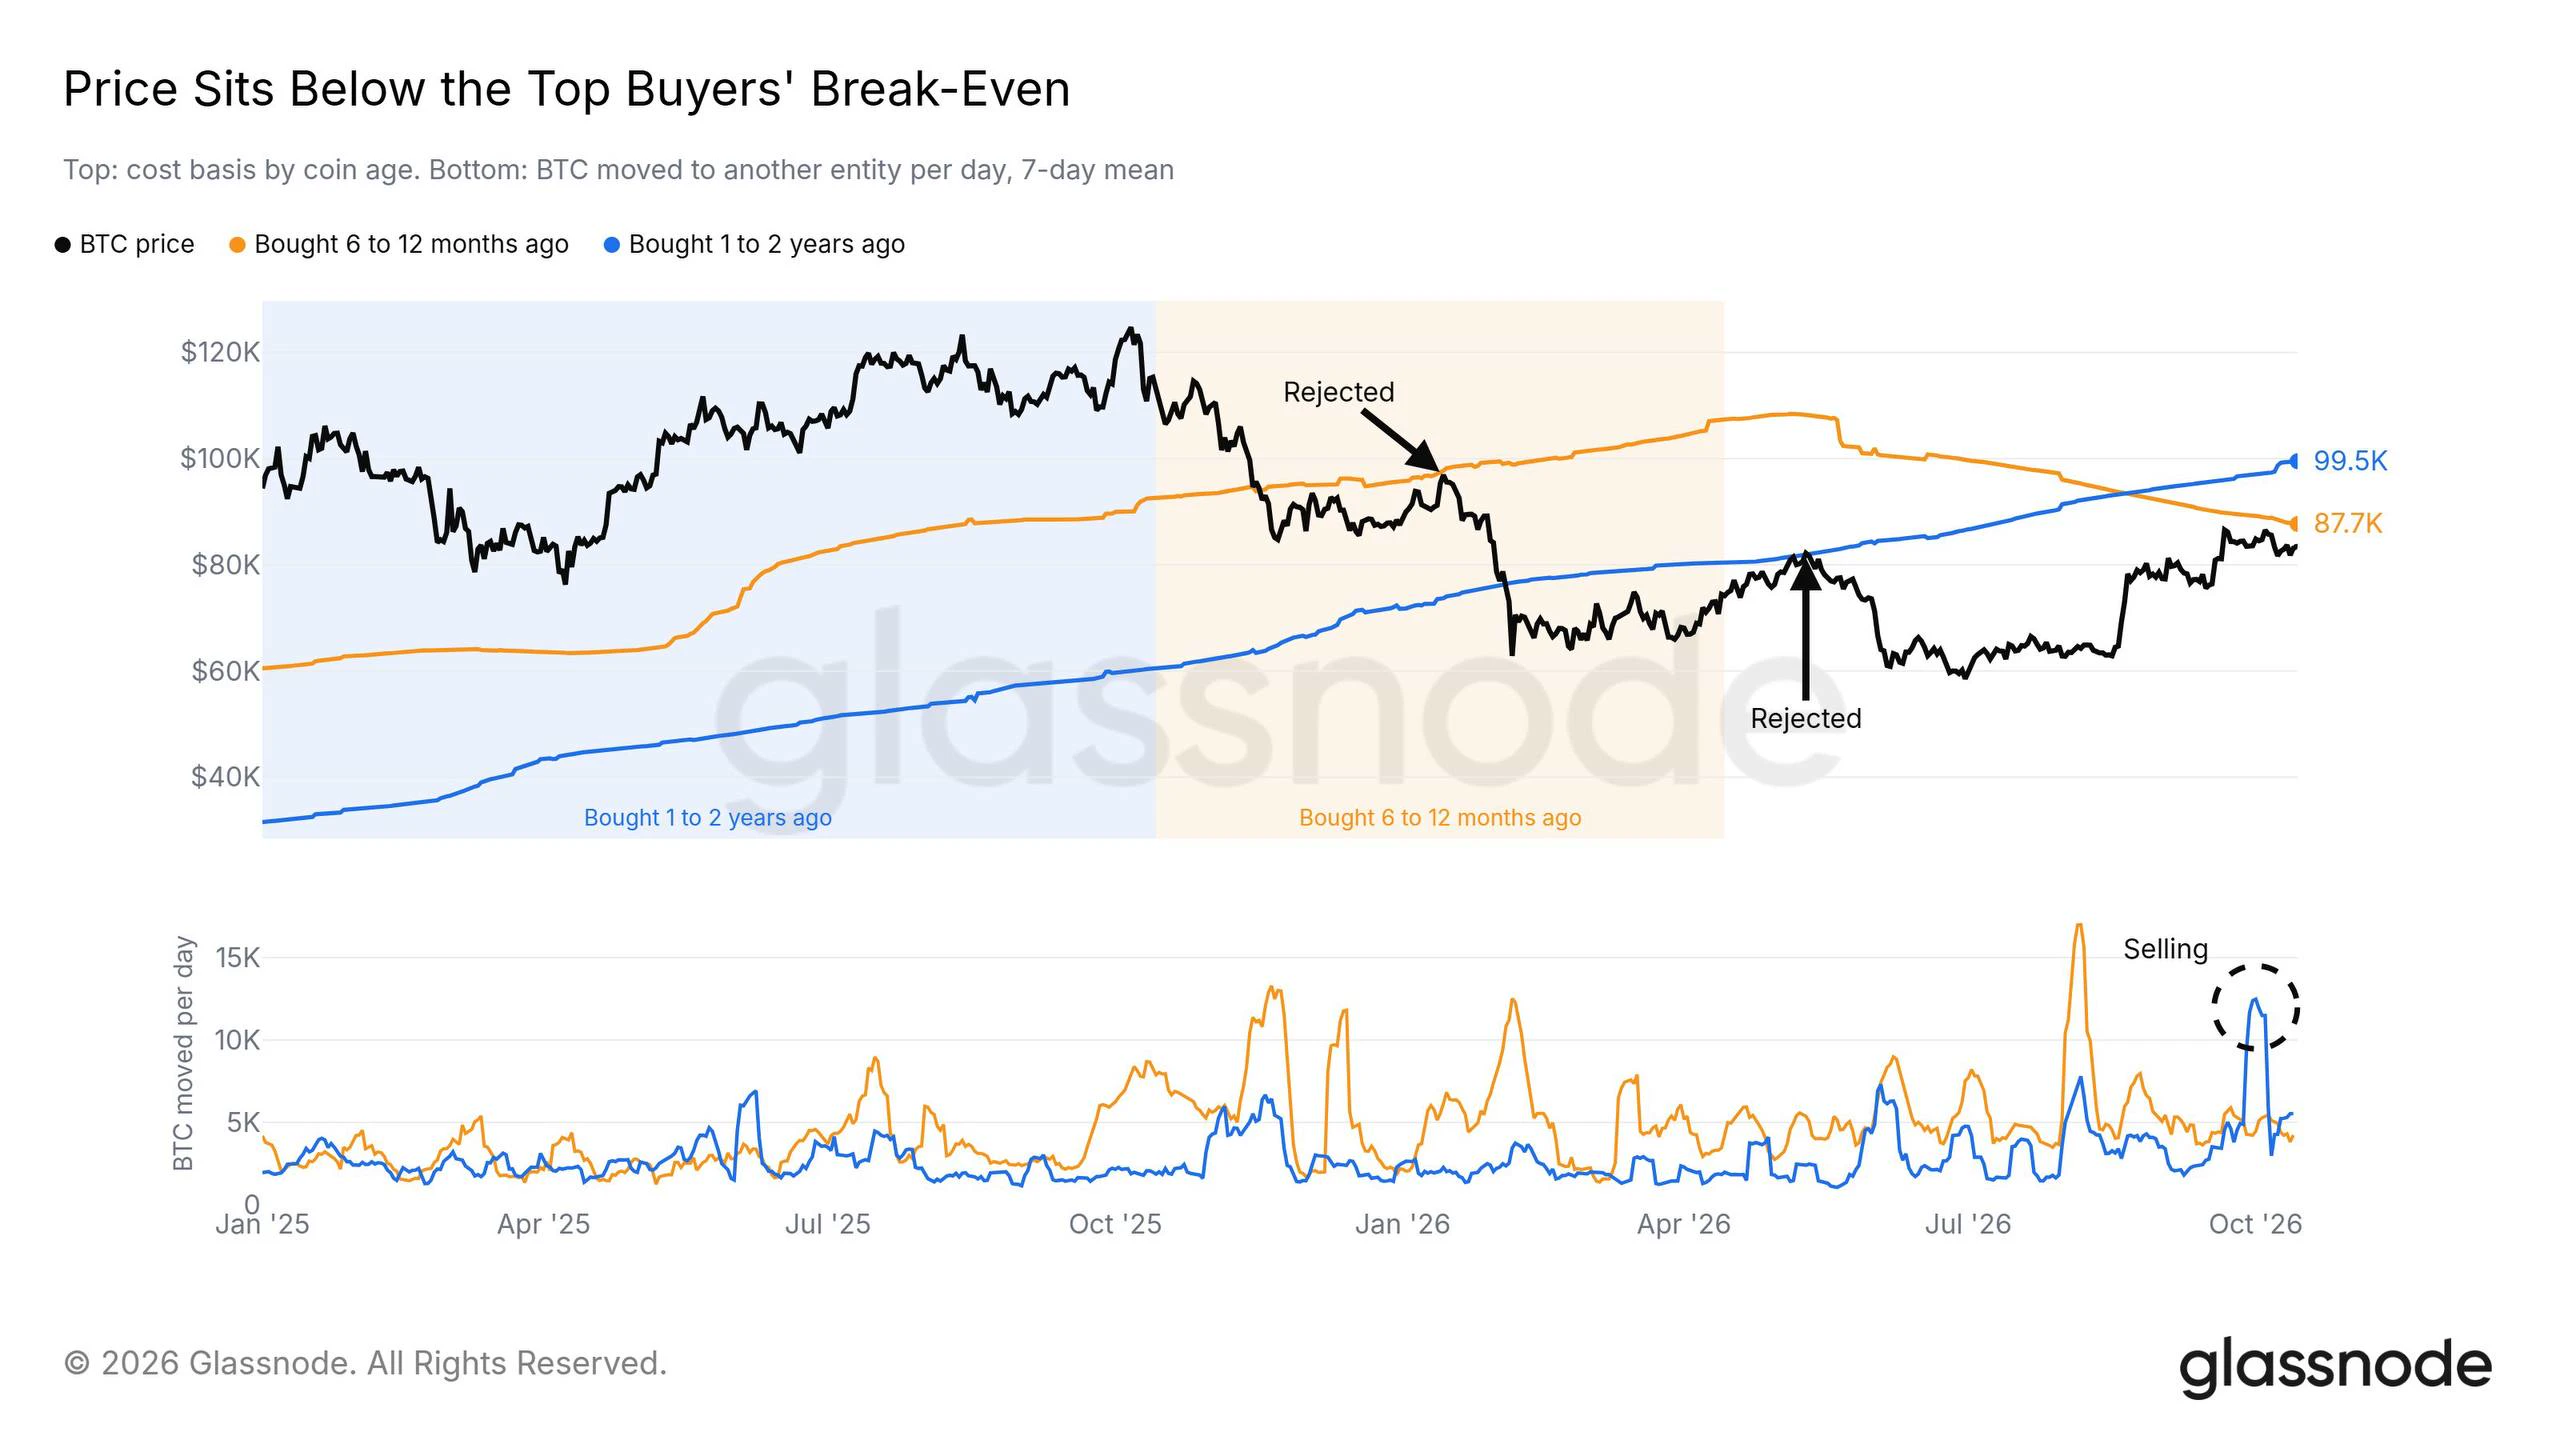
📊 $BTC remains trapped below key cost-basis levels.
Investors who bought Bitcoin over the past two years may reach breakeven above $88K, creating potential selling pressure as price approaches that level. Meanwhile, spot Bitcoin ETFs have turned into net sellers again. 📉
The ETF cost basis near $81.5K has acted as support twice so far, making it a critical level to watch.
👉 BTC needs to reclaim key cost-basis levels to strengthen its bullish structure. If $81.5K fails to hold, further downside pressure could emerge.
#USSeptemberPPIBeatsExpectations #ShareWeekly
post-image
BTC+1.15%
Good morning everyone. Today is Friday, the last trading day of the week. Wishing everyone smooth trading. Yesterday's market had no major highlights; it dipped after the data was released but quickly recovered.
Gold prices edged higher before pulling back and are currently trading around 4160. From the hourly chart, bullish momentum continues to weaken, leaving limited room for a rebound, while heavy resistance remains above, making it relatively difficult to break through in one move.
Do not chase the highs after a surge. The broader trend remains bearish, and the rebound is merely a correct
post-image
I don't know when it started
but "hubby" went from being a term of address
to a flirtatious term
#USSeptemberPPIBeatsExpectations Wholesale Inflation Surges, and Energy Is the Main Driver
Producer prices in the United States rose far more than analysts expected in September 2026, and the report is drawing attention from traders, businesses and policymakers.
The headline numbers
The Producer Price Index (PPI) rose 1.3% month over month, more than double the roughly 0.6% increase economists anticipated. The Bureau of Labor Statistics said this was the largest monthly advance since March 2022. The prior months were smaller: 0.5% in August and 0.2% in July.
On an annual basis, the index rose
Falcon_Official
#每周来晒 #USSeptemberPPIReleased
#ShareWeekly Producer Inflation Meets a $80K Bitcoin Test: Can the Fed Afford to Ease?
Bitcoin is entering September’s U.S. Producer Price Index release with a difficult macroeconomic backdrop. The key question is whether wholesale inflation confirms the price pressures already visible in consumer data or offers the Federal Reserve some room to reconsider its policy path.
Economists are forecasting a 0.6% monthly increase in headline PPI for September, compared with 0.4% in August. Core PPI, excluding food and energy, is expected to rise 0.3%, up from 0.2%. The annual headline rate is forecast at 5.5%, compared with 5.4% previously. These are expectations, not confirmed results; the actual figures must determine whether producer inflation has surprised markets.
The starting point is already uncomfortable for policymakers. September CPI rose 0.6% month-on-month and 3.7% year-on-year, while core CPI increased 0.3% monthly and 2.6% annually. Gasoline prices climbed 9.1% during the month, adding to headline inflation pressure. If producer prices also exceed expectations, markets may worry that higher business costs could feed into consumer prices and make a near-term shift toward easier monetary policy more difficult.
The composition of PPI will matter as much as the headline. A surge concentrated in energy or goods could signal a different inflation problem from persistent increases in services. Investors should watch final-demand goods and services, energy-related components, transportation and trade services, alongside any revisions to earlier readings. A softer headline accompanied by stubborn core services would not necessarily deliver a clean bullish signal.
Bitcoin’s sensitivity to interest-rate expectations is already visible in the current market backdrop. On October 15, Barron's reported BTC at $80,743, down 1.2%, after an overnight low of $80,247, as hotter consumer inflation strengthened rate-hike concerns. These are reported market levels, not a verified PPI-release reaction.
Three scenarios now matter. If headline and core PPI both come in below forecasts, Treasury yields and the dollar could face downward pressure, potentially improving conditions for BTC and other risk assets. If both exceed expectations, renewed rate-hike concerns could strengthen the dollar and weigh on crypto. A mixed report may leave markets focused on core services, revisions and whether the increase is broad-based.
The confirmation test is the cross-market response: BTC’s price and volume after publication, the U.S. dollar index, Treasury yields and Nasdaq futures. A brief Bitcoin bounce alone would not establish a lasting trend; sustained movement alongside rates and the dollar would provide stronger evidence of a macro-driven repricing.
The central issue is not whether one inflation report automatically makes Bitcoin bullish or bearish. It is whether producer-price pressure changes the expected path of monetary policy and whether traders have already priced that risk into BTC.
Will September PPI reinforce the case for tighter U.S. monetary policy, or give Bitcoin room to recover? The actual release and the market’s reaction not the forecast alone will decide which signal carries more weight.

repost-content-media
GAS+3.50%
FUEL-2.96%
EURUSD-0.42%
  • 2
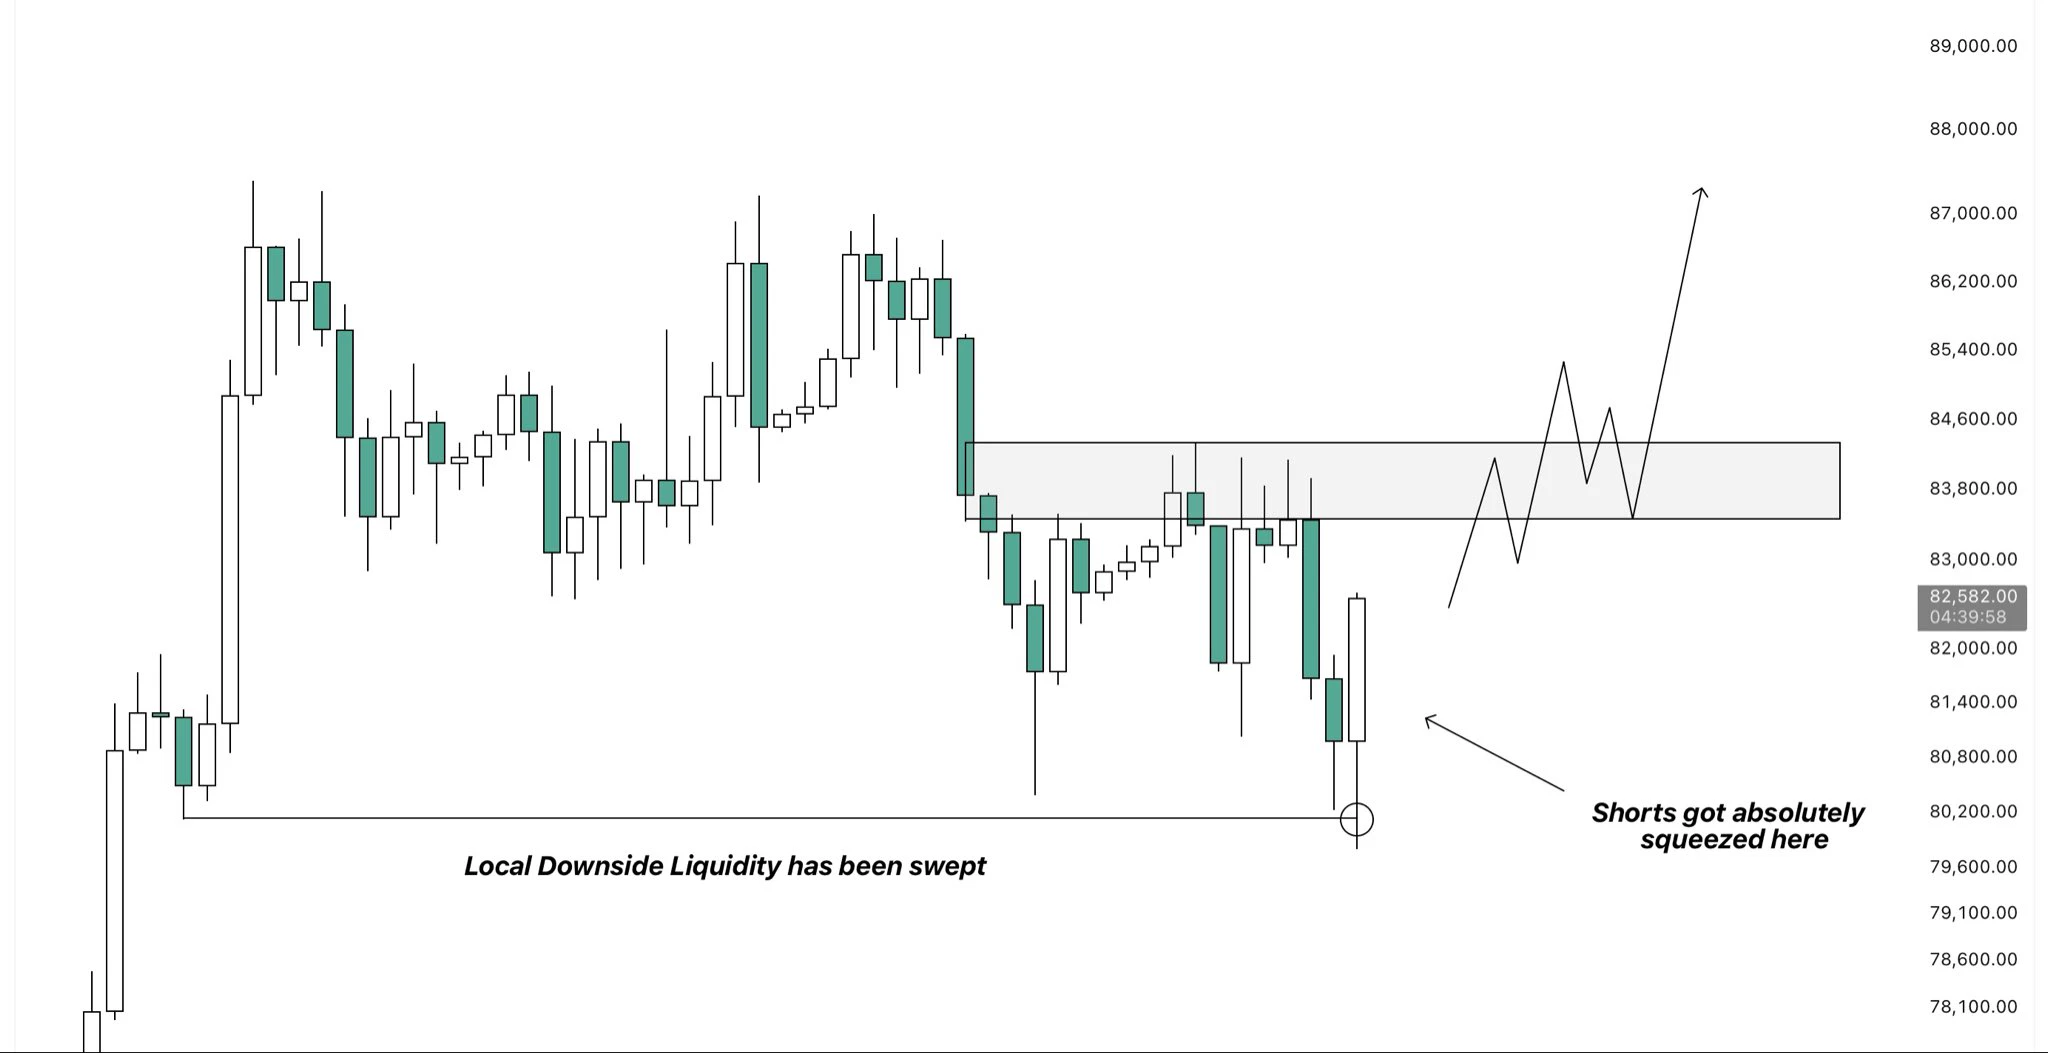
$BTC Earlier today, I mentioned that late shorts were at risk of getting squeezed.
This is exactly what we’ve seen now, resulting in price pushing up roughly 3.5% from the lows.
However, that does not mean that longs are safe yet.
BTC still needs to reclaim $84.4k first in order to break bearish structure and shift momentum back in favor of buyers.
Until there is a confirmed break back above that level, another retest of the lows remains possible.
That said, with all the unswept lows taken out and the majority of the remaining liquidity now resting above price, I would still slightly favor a f
post-image
BTC+1.10%
🌈 Gate Live Streaming Inspiration - October 16
Trending Topic Recommendations:
🔹Rate hike expectations heat up, but U.S. stocks and Crypto rebound against the trend! Huang Renxun steps in to save the day—is the seven-day losing streak for chip stocks about to end?
🔹BTC rebounds from the bottom, with NEAR surging nearly 10%! Altcoins recover across the board—is it time to buy the dip?
🔹KOL take: Ansem remains firmly bullish on BTC! Crypto market confidence has fallen to a ten-year low—is it time to be greedy when others are fearful?
🔹Mysterious whale makes a $187 million bet! Going fully l
post-image
BTC+1.15%
ANSEM+7.56%
ETH+3.13%
SK Hynix+2.13%
SKHY-0.94%
  • 6
  • 4
#DrLinHanSpeaksAtOxfordUnion
Dr. Lin Han Speaks at Oxford Union: A Moment of Dialogue, Ideas, and Global Perspective
The Oxford Union is widely recognized as a historic platform for debate, intellectual exchange, and discussions on important global issues. When a speaker addresses an audience at such a prestigious institution, the occasion creates an opportunity to share perspectives, challenge assumptions, and encourage meaningful conversations among people with different experiences and viewpoints.
**Dr. Lin Han Speaks at Oxford Union** represents an opportunity to reflect on the importance
post-image
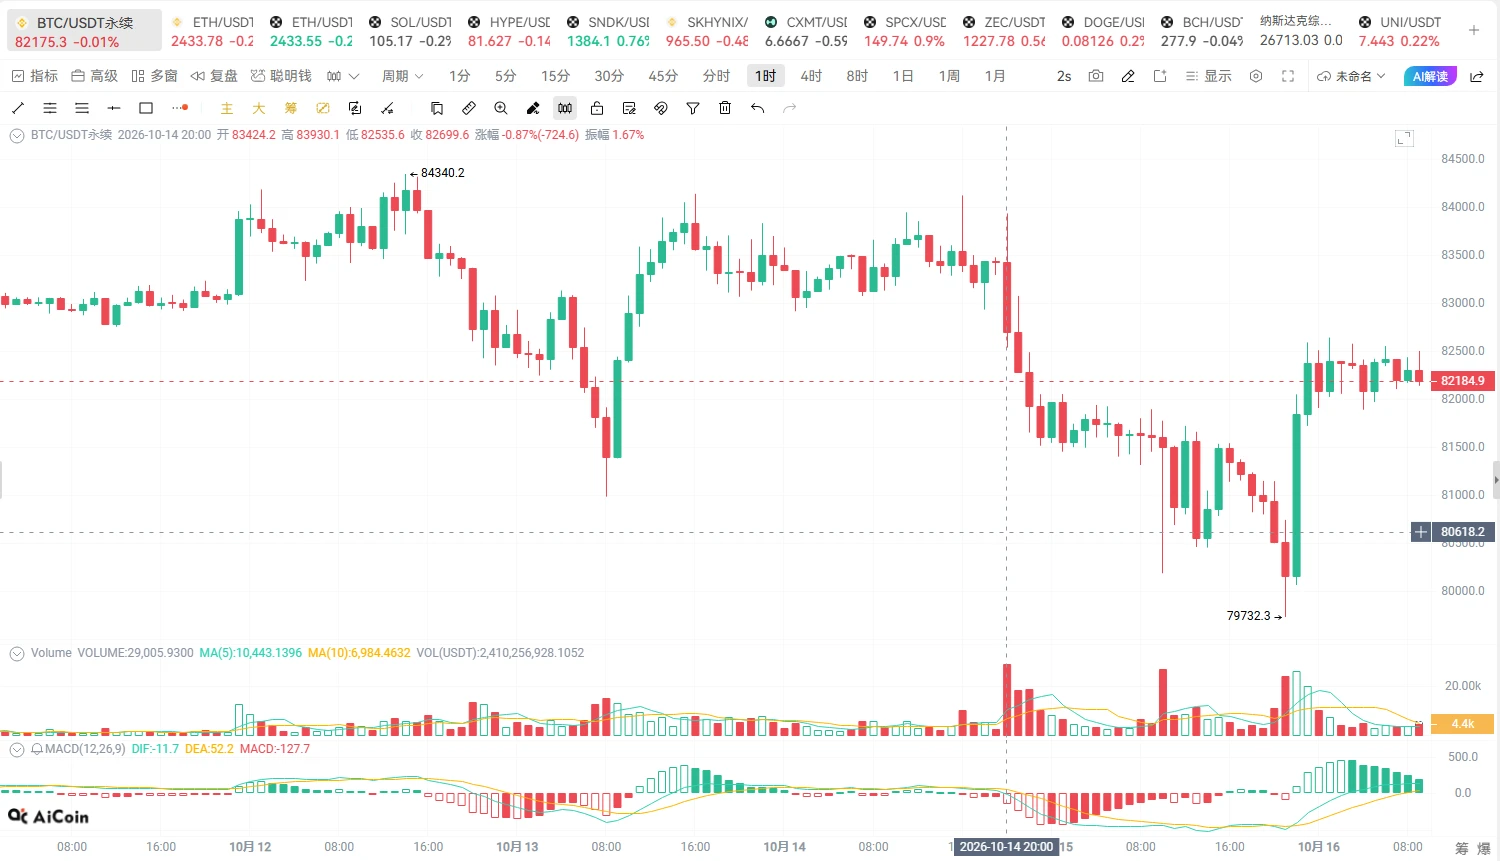
Starlink | BTC Strategy for October 16, 2026
Direction: Short-term bullish bias; wait for a pullback confirmation and do not chase highs.
Entry to watch: 81500–82000
First target: 82500
Second target: 83000–83300
Defensive reference: Below 81000
BTC faced continuous resistance over the past few days, dipping to around 79732 at its lowest. However, it did not sustain an effective break below the 80000 level, followed by a rebound on increased volume.
This indicates support at lower levels, but it is still too early to conclude that the trend has reversed.
Today, focus on three levels:
First, wh
post-image
BTC+1.15%
ETH+3.13%
How important it is to reject middlemen profiting from the price difference🤣
post-image
#KOSPIJumps3.3% Asian Markets in Freefall: SK Hynix and SanDisk Face a Critical Test as AI Memory Stocks Slide
The latest sell-off across Asian equity markets has put semiconductor and memory stocks directly under the spotlight. Japan’s Nikkei 225 fell 4.90%, while South Korea’s KOSPI plunged 7.56%, according to the market figures provided. The sharp decline has renewed concerns about valuations, investor positioning, and whether the powerful AI-related rally in memory stocks has become vulnerable to a deeper correction.
But beneath the red numbers, another development deserves attention: trad
  • 3
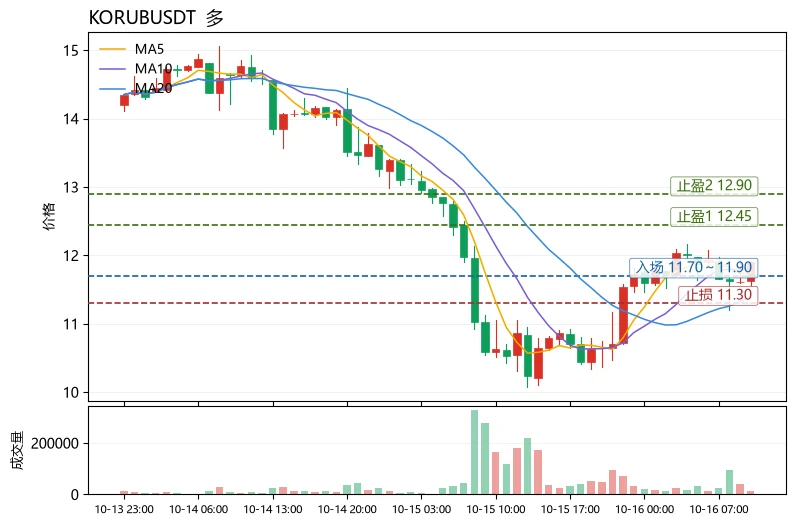
$KORUB Short-term outlook is bullish, but the risk of chasing highs is already considerable. Here is the conclusion first: the current price of 11.9 is above MA5 (11.744) and MA20 (11.389), the bullish moving-average alignment remains intact, and the MACD histogram at +0.1204 is still positive, with the trend structure under bullish control; however, RSI is only 53.4, indicating that this +11.84% rally has not pushed momentum into overbought extremes, leaving room for support on a pullback, while also meaning that the upper Bollinger Band at 12.4672 is the nearest resistance test.
From a capit
post-image
MEGA+0.04%
Live market update
live-cover
LIVE2,248
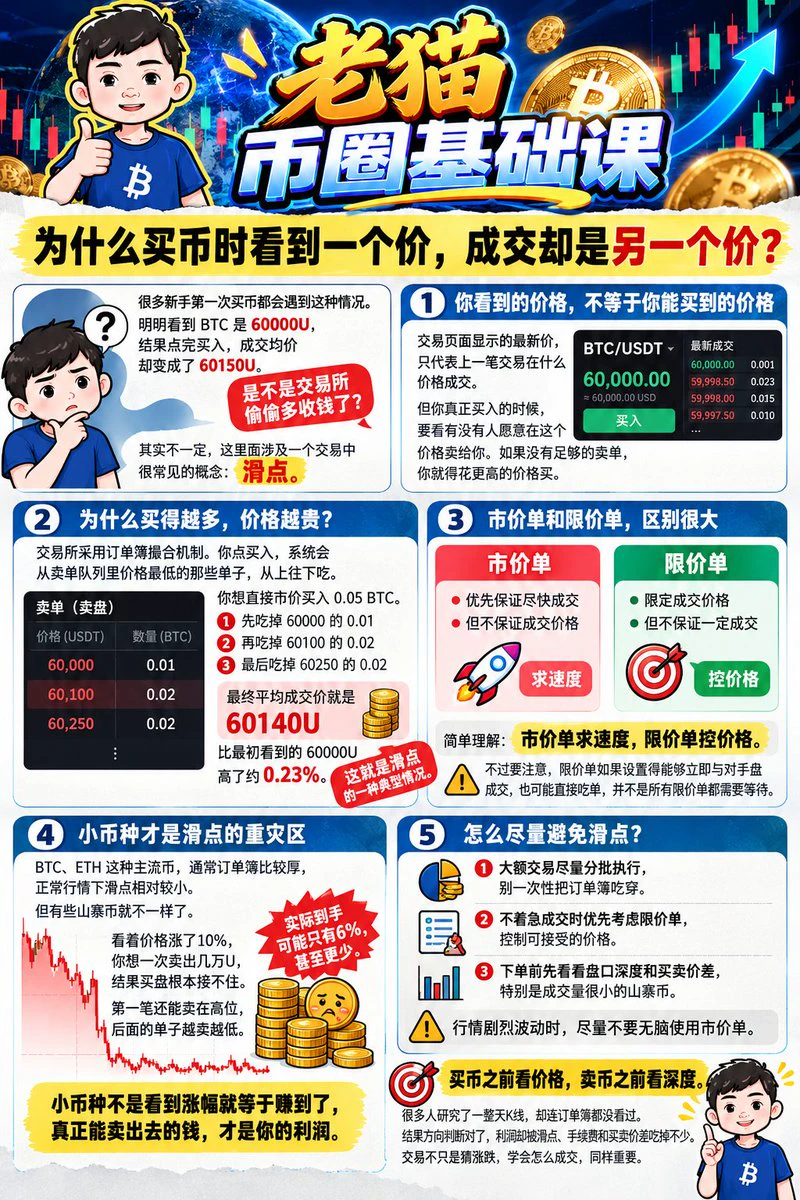
Old Cat’s Crypto Basics: Why do you see one price when buying coins, but execute at another?
Many beginners encounter this the first time they buy crypto.
You clearly see BTC at 60000U, but after clicking buy, the average execution price becomes 60150U.
Did the exchange secretly charge extra?
Not necessarily. This involves a very common concept in trading: slippage.
I. The price you see is not necessarily the price you can buy at
The latest price shown on the trading page only represents the price at which the previous trade was executed.
But when you actually buy, you need to see whether anyo
post-image
BTC+1.10%
ETH+2.43%
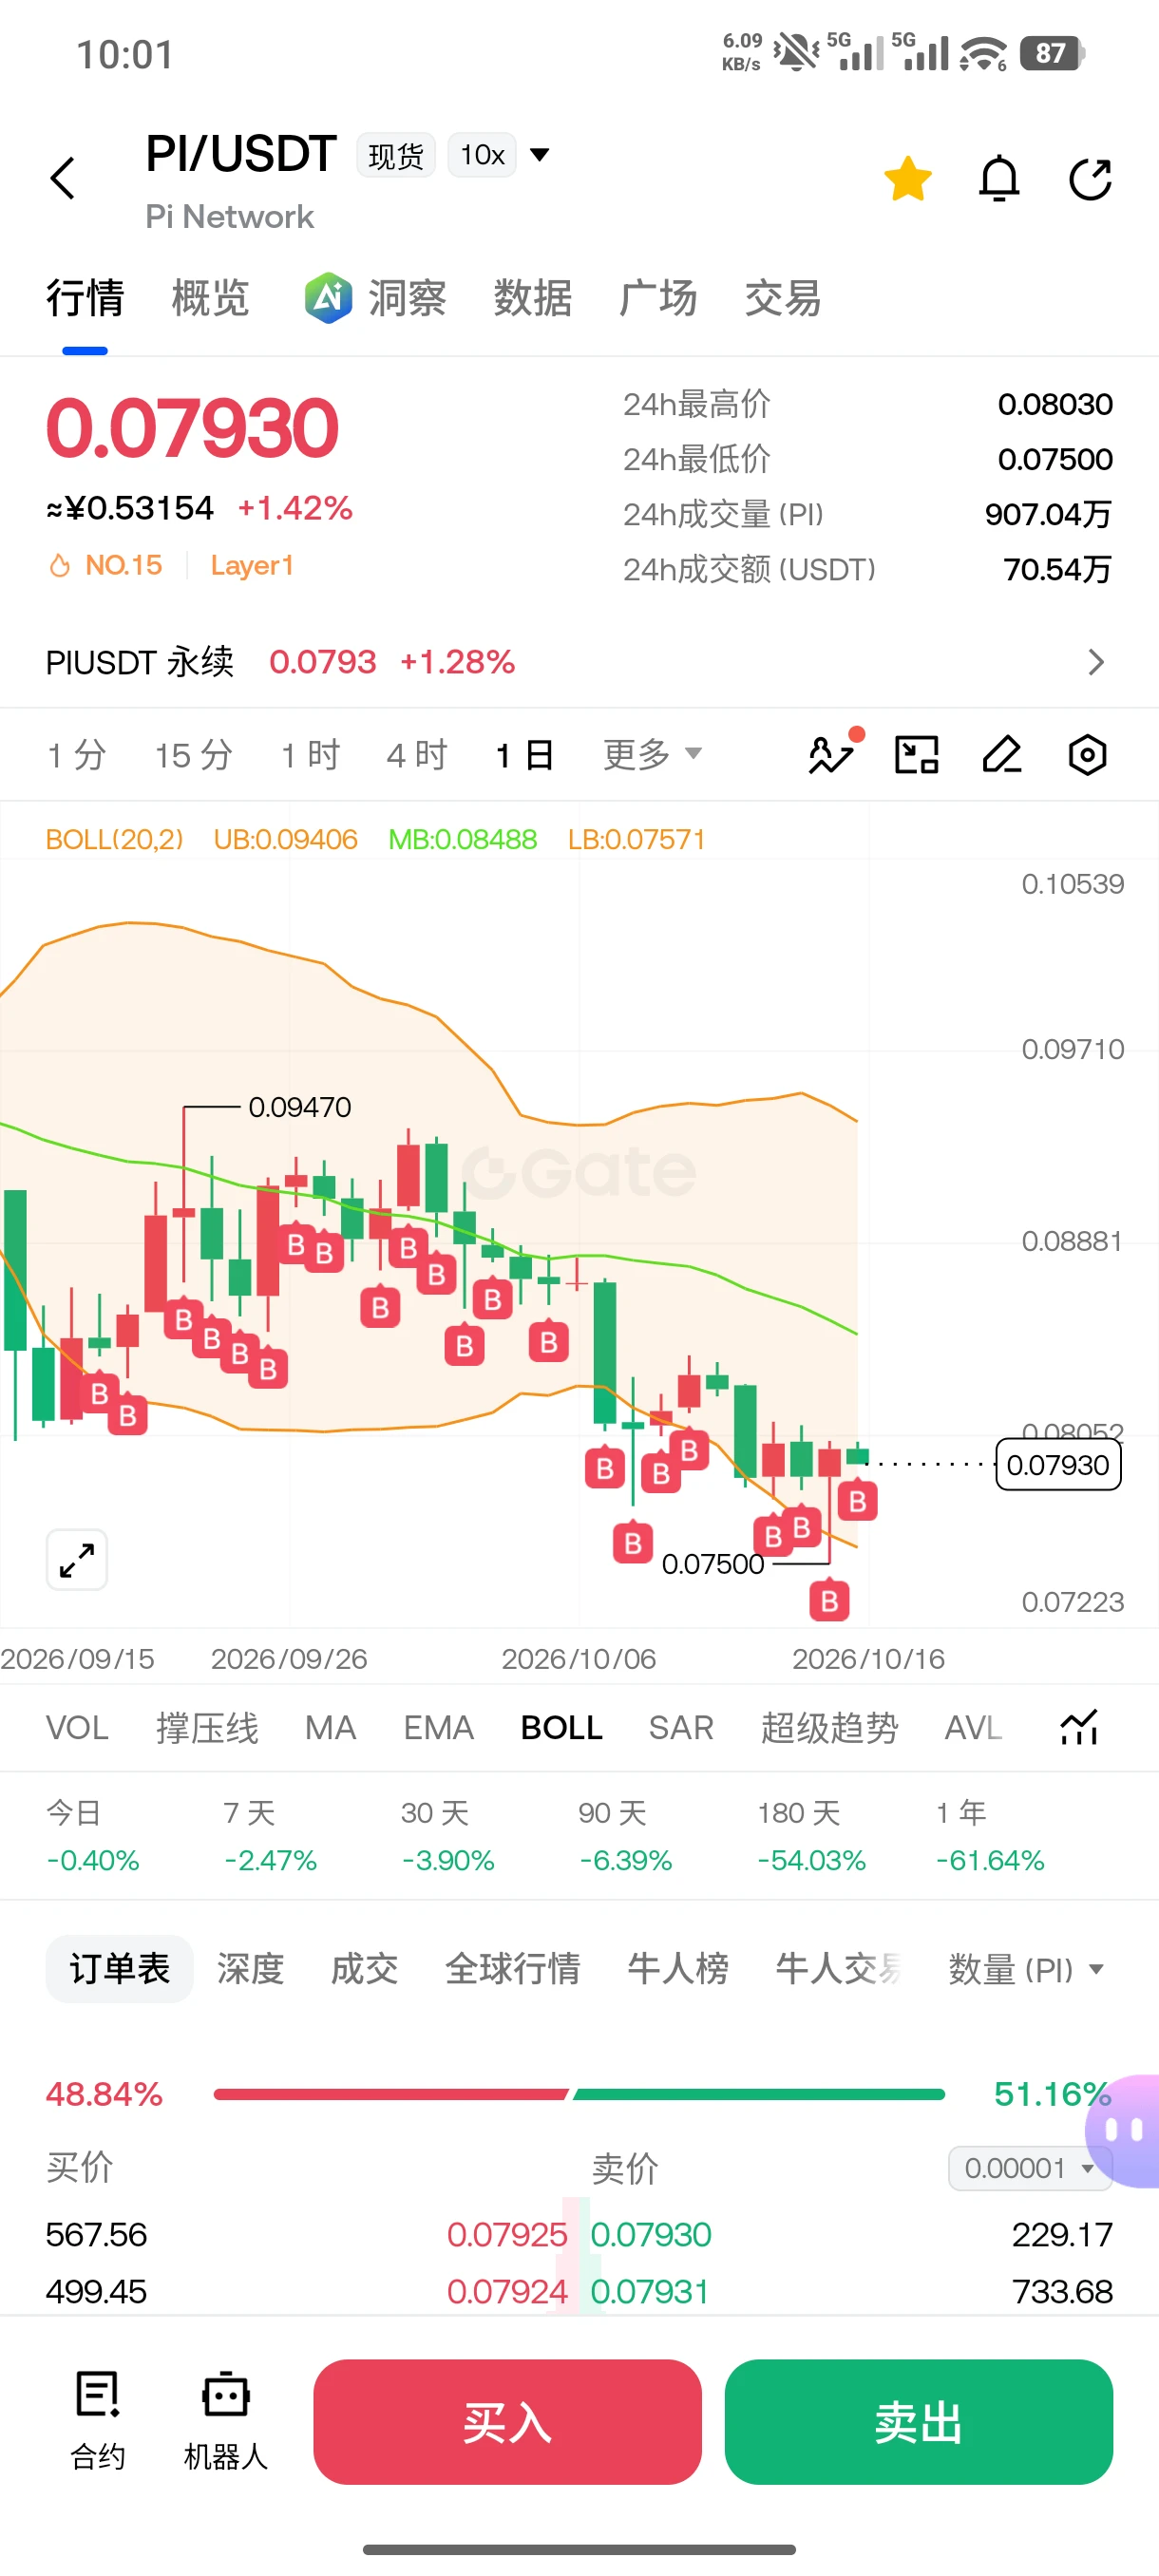
$PI Nothing much to say—just buy some 😄 when you have nothing to do
post-image
PI+3.39%
  • 2
Load More

Join 40 M users in our growing community

⚡️ Join 40 M users in the crypto craze discussion

💬 Engage with your favorite top creators

👍 See what interests you

Trending Topics

USSeptemberPPIBeatsExpectations

91.35k Views1.9k Discussing

US September PPI came in at 6.3% YoY, well above the 5.3% market expectation, pointing to renewed producer-side inflation pressure. Weekly jobless claims were 199K, broadly in line with forecasts. Could hotter inflation further reduce room for rate cuts, and what does it mean for $BTC, US stocks, and gold?

GateWCTCS9GlobalTradingCompetition

37.87k Views6.4k Discussing

WarshIMFSpeech

62.4k Views744 Discussing

View More