Share your thoughts
placeholder
Article
#GateLaunchesTrenchesWith0GasFee
𝗧𝗿𝗲𝗻𝗰𝗵𝗲𝘀 𝗰𝗼𝘂𝗹𝗱 𝗯𝗲 𝗯𝗶𝗴𝗴𝗲𝗿 𝘁𝗵𝗮𝗻 𝗷𝘂𝘀𝘁 𝗮𝗻𝗼𝘁𝗵𝗲𝗿 𝗽𝗹𝗮𝗰𝗲 𝘁𝗼 𝘁𝗿𝗮𝗱𝗲 𝗠𝗲𝗺𝗲 𝘁𝗼𝗸𝗲𝗻𝘀
On-chain trading has never really been about a lack of opportunities. The bigger problem has been fragmentation. A trader may discover a token on one blockchain, check liquidity somewhere else, follow social activity on another platform, and then use a separate wallet or interface to execute the trade. By the time everything is checked, the opportunity may already have changed. This is the problem that makes Gate’s Trenches interestin
post-image
Nobody is talking about the hidden trap forming inside SYMBOL right now.

$ARB /USDT - SHORT

Trade Plan:
Entry: 0.16311 – 0.16621
SL: 0.17956
TP1: 0.15348
TP2: 0.14603
TP3: 0.13485

Why this setup?
Why now? The daily trend is range, but the 1h ATR of 0.00621 shows a sudden squeeze that is compressing volatility ahead of a directional burst. The 15m RSI at 39.17 confirms bearish momentum is still intact, not oversold enough to reverse. The entry zone between 0.16311 and 0.16621 aligns with the 1h price of 0.16466, giving a precise risk-defined short. TP1 at 0.15348 and TP2 at 0.14603 offer
ARB-9.17%

9.8 Morning/Evening Market View (recommended 3%, 100x, total position not exceeding 5%):


🔥ETH short: Short on a wick near 2712, stop loss 32 points

ETH long: Long on a wick near 2428, stop loss 19 points


Reminder: After sweeping liquidity on Friday, the market has made a second attempt at the top, but the pullback has not yet broken below it. The market remains range-bound, so watch whether it can break upward,

and whether it breaks above 2580 or below the support level at 2428; both are key levels to watch.
post-image
ETH+0.15%
This entry point was not perfect; I tried a long at the second-bottoming area on the $WLD hourly chart. The moving averages had not fully turned upward yet, so I could only use a tight stop-loss in exchange for room for later profits.

After entry, price action was very choppy. Several rallies were pushed back, making it look like the trend was weakening. But each pullback consistently held above the key reference level from the time of entry, so I chose to reduce my trading frequency and let the position run.

Only after the key level above was broken did the price action start to flow smoo
post-image
WLD+13.83%
SOL-1.84%
SNDK+1.01%
[New Streamer] Market Prediction
live-cover
LIVE1,592
This trend is so obvious I don’t even need to think—the account is dancing on its own 💃
A few days ago, the last thing I saw before bed, $UNI was still bottoming out ahead, never breaking down. The candlesticks looked lifeless, but funds had actually been testing the waters in the shadows all along, and the buying pressure was already impossible to hide. Before bed, I left just one message: if there’s no volume at the bottom, just wait.
Then I opened my eyes and the market took off 🚀, surging from 4.828 to 6.848, with the position’s return jumping straight to +2970.83%. The buildup was trul
post-image
UNI-3.84%
ZEC-3.10%
DOGE+1.21%
#USELESSSurgesAnother67%
Some crypto moves are gradual.
Others happen so quickly that the entire market starts paying attention.
USELESS is currently one of those tokens.
The Solana-based meme coin USELESS surged another 67% in a 24-hour period, pushing its market capitalization to approximately $213 million while reported 24-hour trading volume reached around $38 million.
For a token operating in the highly speculative meme-coin segment, that is a remarkable amount of momentum.
But the most interesting part is not simply the 67% number.
It is the speed at which the narrative around USELESS h
post-image
Something is about to break in $XAG /USDT that most traders will not see coming until it is too late.

$XAG /USDT - SHORT

Trade Plan:
Entry: 66.25 – 66.39
SL: 67.02
TP1: 65.80
TP2: 65.45
TP3: 64.92

Why this setup?
Why now? The daily trend is range, which means the market has been trapped in a low volatility compression that is about to release violently into a directional move. The 15m RSI sits at 57.56, showing that short sellers are already exhausted and missing the deeper downside leg that is forming. The 1h ATR of 0.290664 is small, so a breakout from the current range will likely be
XAG+0.21%
This was purely because market sentiment was good—it casually tossed out a few gold coins, and one happened to land on my head. ✨

While everyone was still watching from the sidelines, $BMNR moved sideways around 24.39 for a long time, with volume shrinking the longer it stayed there. I figured most of those who wanted to leave had already done so, and this level was worth taking a position at, so I entered early.

When I opened the chart again, the price had already reached 25.14, with unrealized gains at +58.97%. The profit wasn’t huge, but it was satisfying.

The premise of compounding
post-image
BMNR-1.13%
SOL-1.84%
ETH+0.15%
Is DOGE about to break a range that has held for weeks?

$DOGE /USDT - SHORT

Trade Plan:
Entry: 0.08998 – 0.09054
SL: 0.09290
TP1: 0.08828
TP2: 0.08696
TP3: 0.08498

Why this setup?
Why now? The 1h price sits at 0.09026 inside a tight 1h ATR of 0.001101, which means a single candle can cover the entire entry zone between 0.08998 and 0.09054. The 15m RSI at 53.26 shows neither overbought nor oversold exhaustion, so a directional move could catch passive traders off guard. The daily trend is range-bound, meaning the last significant move was the invalidation level at 0.08774, which now acts
DOGE+1.21%
Why is everyone suddenly treating SYMBOL as a range-bound asset when the data says otherwise?

$LTC /USDT - SHORT

Trade Plan:
Entry: 55.02 – 55.52
SL: 57.71
TP1: 53.44
TP2: 52.22
TP3: 50.39

Why this setup?
Why now? The daily trend has been flat, but the 1h price is sitting at 55.27, which is the exact entry_ref we have been watching. The 15m RSI is 42.19, showing bearish momentum without being oversold yet, meaning the drop likely has room to run. The 1h ATR is 1.017264, so a move from the entry zone of 55.02 to 55.52 is well within a single volatile hour. We are targeting TP1 at 53.44 an
LTC+1.73%
$LINK /USDT about to expose a massive blind spot everyone is ignoring.

$LINK /USDT - LONG

Trade Plan:
Entry: 12.879 – 12.989
SL: 12.402
TP1: 13.333
TP2: 13.599
TP3: 13.998

Why this setup?
Why now? The daily trend is firmly bullish, setting the stage for a continuation play. The 1h ATR of 0.221615 signals that volatility is expanding just enough to fuel a clean move. With the 15m RSI sitting at 39.49, the asset is far from overbought, leaving room for upside before exhaustion. The entry zone between 12.879 and 12.989 aligns perfectly with the current 1h price of 12.934, offering a precise
LINK+5.35%
🐋 WHALE WATCH : 47% of the market is currently betting on a $BTC decline.
=> 29% Bearish
=> 18% Very Bearish
=> 23% Neutral
=> Only 29% Bullish
When pessimistic consensus reaches this level of dominance history tells us one thing: the market rarely gives the majority what they expect. Maximum pain usually lies in the opposite direction.
Are we about to squeeze the 47% bear consensus or is the crowd actually right this time ?
post-image
BTC-0.66%
I switched to the background to reply to a message, and when I came back, it had already finished the job. While it was bottoming out intraday, $HOLO was hovering around 0.06140. I watched it for a few minutes—whenever it dipped, someone kept buying, with funds quietly entering, so I held on.
I initially thought I would have to wait until evening, but it took off directly in the afternoon, with the price touching 0.06678 and unrealized gains reaching +424.63%. Putting risk controls in place beforehand is called rationality; cutting after taking losses is called decisively severing the wrist.
I
post-image
HOLO-1.04%
SOL-1.84%
ETH+0.15%
Join the Fastest Growing Community “Crypto Marg” Founded by Raajeev Anand
post-image
Most traders are about to get blindsided by SYMBOL right now.

$HYPE /USDT - LONG

Trade Plan:
Entry: 85.357 – 85.811
SL: 83.401
TP1: 87.221
TP2: 88.313
TP3: 89.950

Why this setup?
Why now? The daily trend is bullish, but the 1h ATR of 0.90956 shows volatility is compressing just before a breakout. The 15m RSI at 37.57 signals room to run before overbought. The entry zone of 85.584 sits perfectly above the invalidation level of 83.515, giving risk-defined precision. TP1 at 87.221 and TP2 at 88.313 offer stacked rewards, with the 1h price at 85.600 already nudging toward the first target. T
post-image
HYPE-3.23%
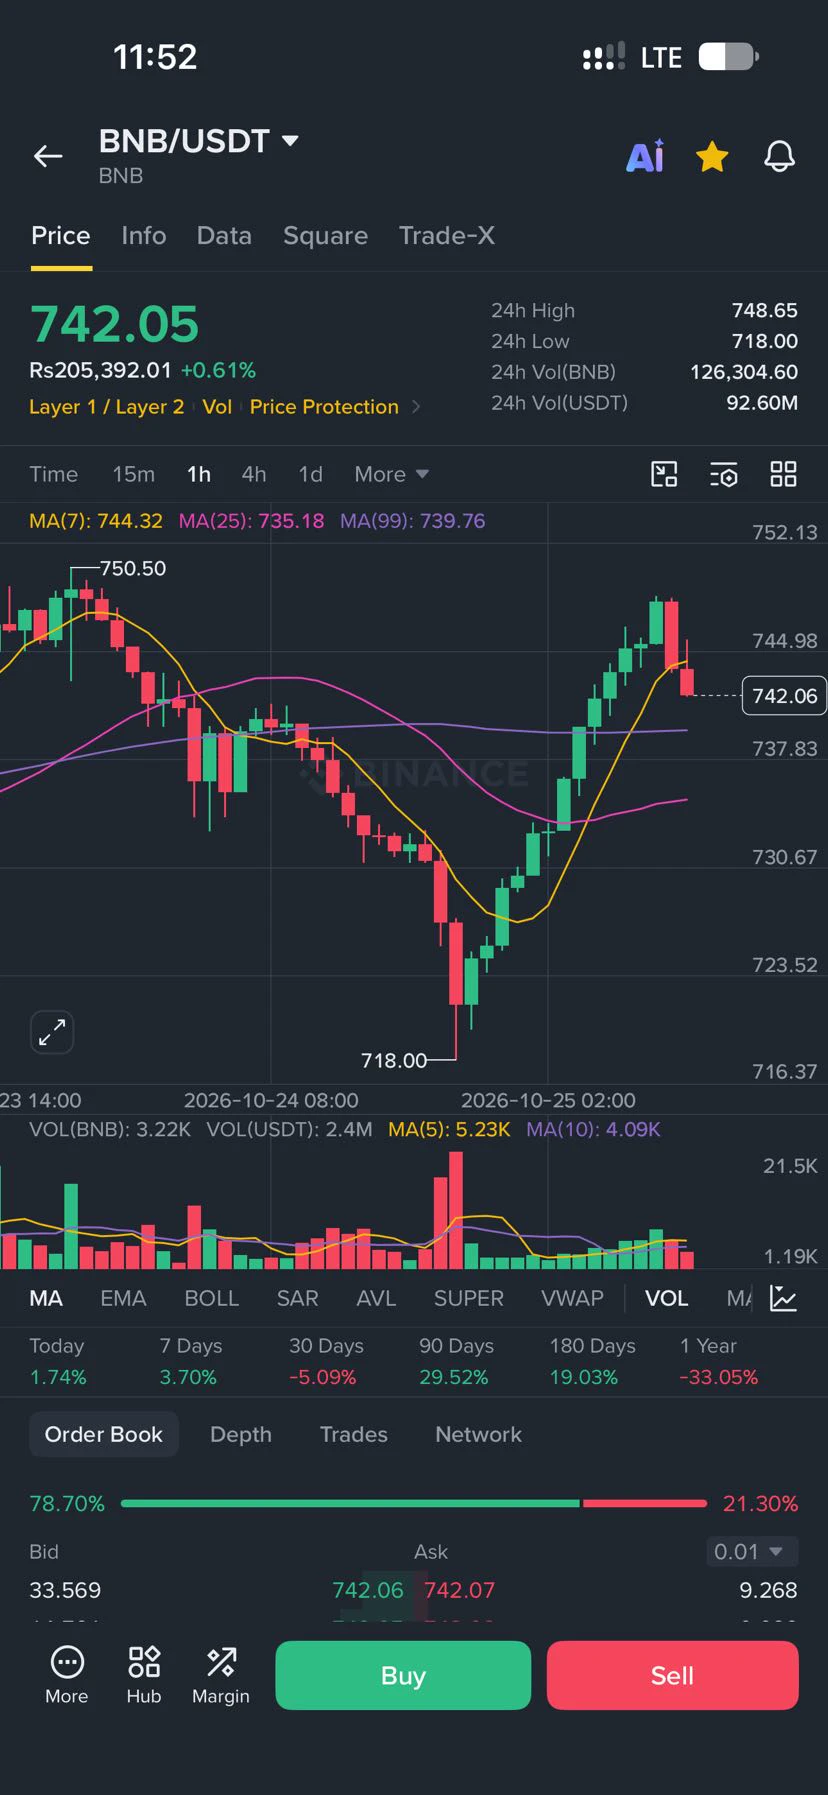
Everyone is watching BNB, but the real move hides below 730.

$BNB /USDT - SHORT

Trade Plan:
Entry: 738.8 – 741.0
SL: 750.6
TP1: 731.9
TP2: 726.5
TP3: 718.5

Why this setup?
Why now? The daily trend is range-bound, which means BNB lacks a clear directional trend and is coiling for a breakout. The 15m RSI sits at 43.16, showing that short-term momentum is neither overbought nor oversold but leaning bearish. The 1h ATR of 4.450903 tells us the asset is expanding its hourly range, giving enough room for a decisive push. The entry zone is 738.8 to 741.0, anchored at 739.9, which is the 1h pric
post-image
BNB-0.81%
UPDATE: Senator Cynthia Lummis pushes crypto custody protections ahead of the Senate's Sept. 15 CLARITY Act vote.
post-image
Altcoin Market Overview: Top Movers Today
live-cover
LIVE677
#HyperliquidTeamWithdraws38.14MInHYPE
Hyperliquid Team Moves $38.14M in HYPE: What Does It Mean for the Market?
A major on-chain movement involving Hyperliquid’s development team has caught the attention of the crypto market. According to recent on-chain monitoring, HyperLabs, the development team associated with Hyperliquid, redeemed approximately 433,000 HYPE tokens worth around $38.14 million and subsequently transferred the tokens across 11 different addresses.
The movement happened after a seven-day staking redemption period. The tokens arrived at the team’s address and were later transf
HYPE-3.16%
  • 2
  • 1
Load More

Join 40 M users in our growing community

⚡️ Join 40 M users in the crypto craze discussion

💬 Engage with your favorite top creators

👍 See what interests you

View More