Square
Following
Hot
News
Notifications
Profile
Share your thoughts
placeholder
Article
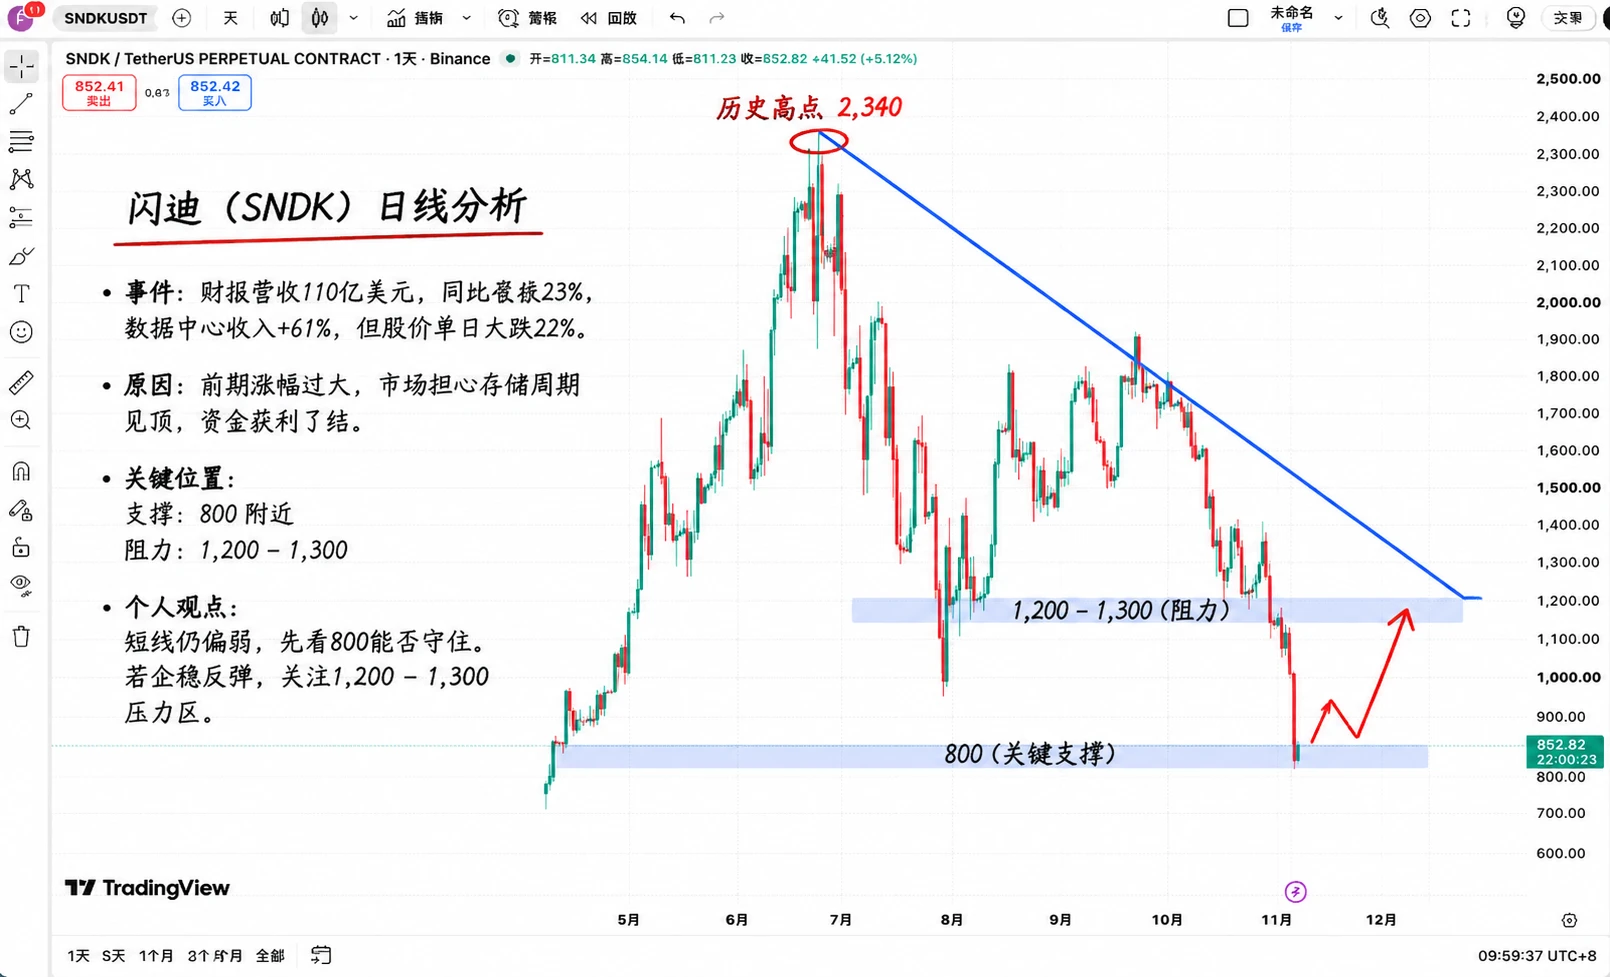
SanDisk really blindsided those who bought the rally this time! It just posted strong earnings, but its stock plunged 22% in a single day, dropping straight to $806.

What’s even more outrageous is that the results were not bad at all.

Revenue for the latest quarter was $11 billion, up 23% quarter over quarter, while data center revenue grew 61%. The company also announced a $5 billion share buyback and an 8-for-1 stock split.

With so much good news, the market still sold.

The reason is easy to understand. SanDisk had surged too much beforehand, and the market had already priced in AI stora
post-image
SNDK-22.24%
  • 1
#美股史诗级抛售 #10月非农数据聚焦 #作手分析 #WCTCS9 $NAS100 ‌
🔥 US stocks and crypto plunge across the board, trapping long positions! Crisis or long-term opportunity? Trader breaks down three key reasons behind the sell-off
Trading watchlist: $BTC $ETH $NVDA $GOOGL $ANTHROPIC
On November 5, US stocks and crypto markets suffered a sharp sell-off. The Nasdaq fell 5.52%, the Philadelphia Semiconductor Index plunged 12.3%, and NVDA fell about 9%, while semiconductor stocks such as MU and AMD fell even more. BTC dropped below $76,000, while ETH, HYPE and others also pulled back sharply.
I don't hide my live
Trader
#美股史诗级抛售 #10月非农数据聚焦 #作手分析
🔥 U.S. stocks and crypto plunge together, leaving long positions underwater! Crisis or long-term opportunity? Trader breaks down the three key reasons behind the selloff

Trading watchlist: $BTC $ETH $NVDA $GOOGL $ANTHROPIC

On November 5, U.S. stocks and crypto markets suffered a sharp selloff. The Nasdaq fell 5.52%, the Philadelphia Semiconductor Index plunged 12.3%, and NVDA fell about 9%, with semiconductor stocks such as MU and AMD dropping even more. BTC fell below $76,000, while ETH, HYPE, and others also pulled back sharply.

I’m transparent about my live positions: my HYPE, GOOGL, and ANTHROPIC long positions are currently also showing unrealized losses.

But I don’t think this downturn means the long-term cases for AI and crypto assets are over. Some high-quality assets may, in fact, be presenting long-term spot opportunities worth watching.

I. Three reasons behind this selloff

1️⃣ U.S. midterm elections shift expectations for AI investment

The Democratic Party won control of both chambers of Congress, raising concerns that future data center construction, energy supply, and AI infrastructure investment could face stricter regulation.

But this is only the trigger. The deeper question is whether massive AI capital expenditures can translate into sustained revenue and profits. As the market starts questioning returns on investment, valuations may be repriced.

2️⃣ The AI industry shifts from storytelling to proving profitability

In the past, the market was willing to pay high valuations for AI growth. Now, institutions are paying closer attention to orders, revenue, profits, and cash flow.

Chip demand may remain strong over the long term, but data center construction requires massive investment. Financing costs, energy supply, construction approvals, and investment payback periods could all affect the pace of industry expansion.

AI hasn’t disappeared; the market is simply starting to demand that companies demonstrate real profitability.

3️⃣ U.S. stock losses combine with crypto market liquidations

U.S. tech stocks plunged, and risk appetite quickly declined. CoinDesk, citing CoinGlass data, reported that more than $1 billion in leveraged positions were liquidated in the crypto market over the past 24 hours, with longs accounting for the vast majority.

But the crypto market was already under pressure from ETF outflows, shrinking stablecoin supply, and other factors. The decline in U.S. stocks acted as a catalyst, while leveraged liquidations further amplified the losses.

II. Why is Trader starting to look for long-term spot opportunities?

My logic is simple: short-term price declines don’t mean long-term business value has disappeared.

For NVDA, I’m watching AI chip demand and orders; for GOOGL, cloud business and AI commercialization; for BTC and ETH, capital flows and ecosystem development; and for HYPE, platform revenue and token value capture.

Of course, a big drop doesn’t mean an asset is cheap. For assets like ANTHROPIC, which are still subject to valuation expectations, it’s especially important to watch financing, computing costs, and whether future revenue materializes.

III. What will Trader do next?

I handle spot investing and futures trading separately:

• Spot: Build positions in high-quality assets I’m bullish on in batches, spread out the buying period, and don’t go all-in at once trying to call the bottom.

• Futures: Don’t blindly add to positions just because they’re underwater, and never hold on indefinitely. Wait for signs of stabilization, a breakout, and a confirmed retest before looking for opportunities on the right side of the trend.

• Risk management: If fundamentals change or the price structure continues to weaken, reassess instead of stubbornly sticking to the original view.

Tonight at 21:30 Beijing time, the U.S. will also release its October nonfarm payrolls report. The data could further affect expectations for Fed rate cuts and the performance of risk assets.

Trader believes this correction is worth watching, but it’s still too early to declare that a bottom has formed.

Don’t try to call the top or bottom, and don’t chase the first big green candle. The macro sets the direction; the structure determines the entry.

How are you planning to respond to this selloff?

A. Build a spot position in batches

B. Reduce exposure and wait for confirmation

C. Stay bearish and wait for a deeper bottom

D. Wait on the sidelines for now

Let the market provide the answer instead of trying to predict it!

(Personal opinion for discussion only; not investment advice.)
NAS100+1.87%
  • 4
  • 1
Trenches
ZIG
Z
bade
b
ZIG
0x8c...1145
Market Cap
$.
Change
.
24h Vol
$.
Holders
.
BTC
B
bade
b
BTC
C5xp...pump
Market Cap
$.
Change
.
24h Vol
$.
Holders
.
CORLA
C
bade
b
CORLA
0xba...7777
Market Cap
$.
Change
.
24h Vol
$.
Holders
.
STONK
S
bade
b
STONK
6GmA...UNgx
Market Cap
$.
Change
.
24h Vol
$.
Holders
.
DESSA
D
bade
b
DESSA
npz2...pump
Market Cap
$.
Change
.
24h Vol
$.
Holders
.
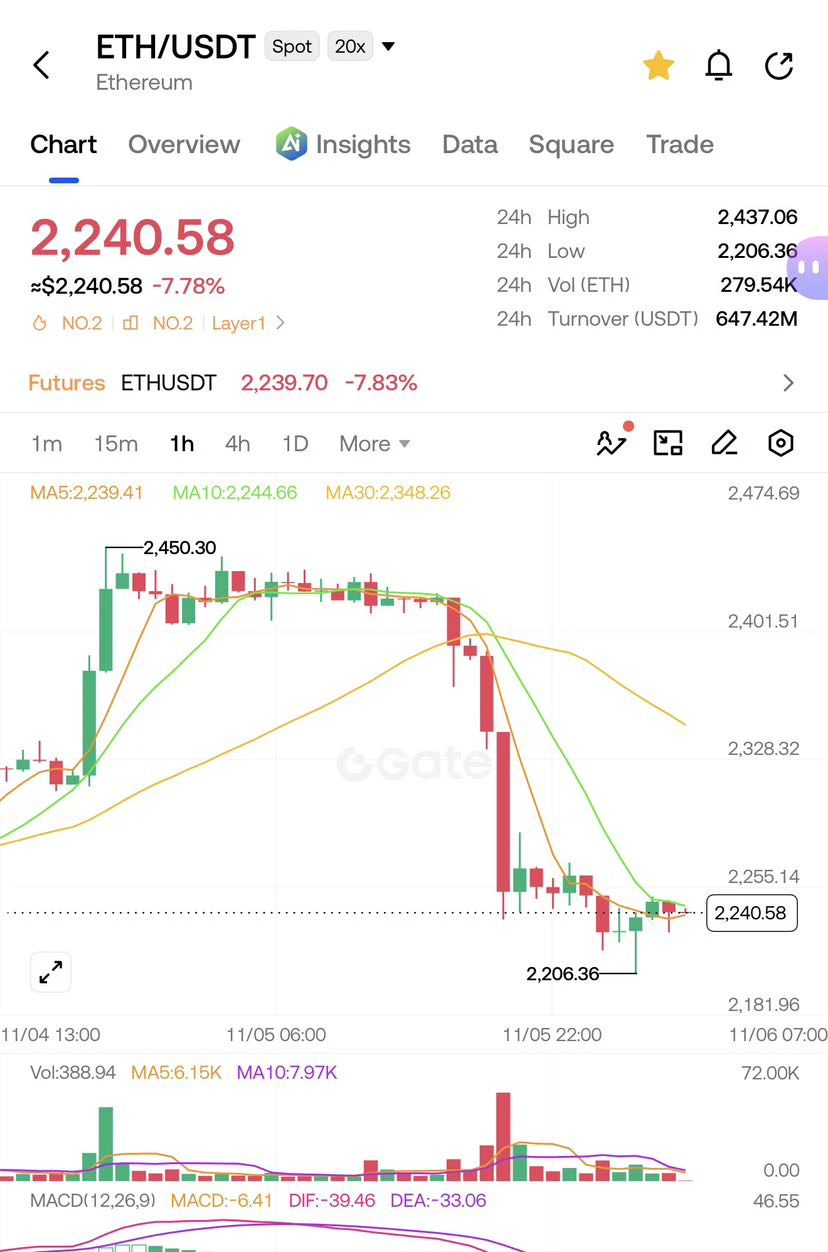
Ethereum is currently trading at $2,240.58.

$ETH is holding around the $2,240 level as traders watch for the next major move. A breakout could build bullish momentum, while continued selling pressure may bring further downside.

Stay alert and watch key support and resistance levels!

#Ethereum #ETH #Crypto #Bitcoin #Trading
post-image
ETH-1.26%
  • 7
  • 1
$SKHY ‌Why do shares fall despite record profits?

The last two days for SK Hynix provide a clear answer to the question of why a stock might lose value even after reporting record profits.

The company announced record revenue of 104.6 trillion won and a record operating profit margin of 80% for the third quarter—surpassing the 100 trillion won threshold for the first time in its history. Yet, during the same period, its share price fell sharply, driven by concerns regarding U.S. policies on artificial intelligence.

This situation illustrates that investors are no longer focused solely on
post-image
SKHY-13.76%
  • 9
  • 2
GM CT.
A financial application shouldn’t need access to your actual balance to check whether certain conditions are met.
@primus_labs is working on this with FHE.
It allows applications to perform computations on encrypted data without exposing the original information.
This means financial rules can be checked while sensitive details remain protected.
For DeFi, this creates more room for private financial services without exposing every user’s financial information.
That’s one of the things Primus is bringing to onchain finance.
post-image
FHE-3.50%
CT-12.34%
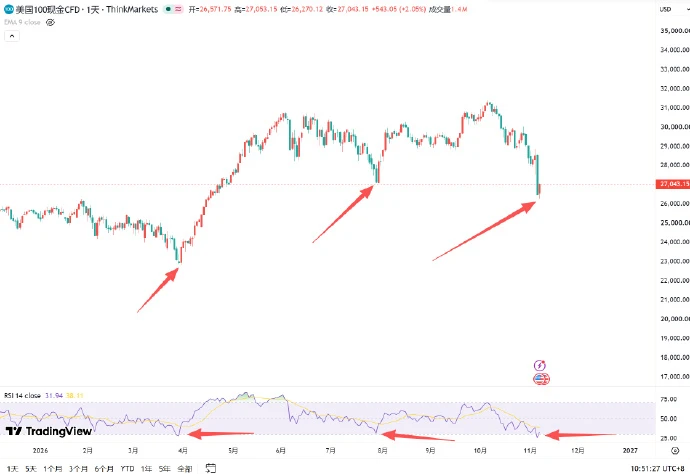
#纳指# Add to the position. An 80% chance of buying the bottom, and a 20% chance of buying halfway up.
post-image
NAS100-0.07%
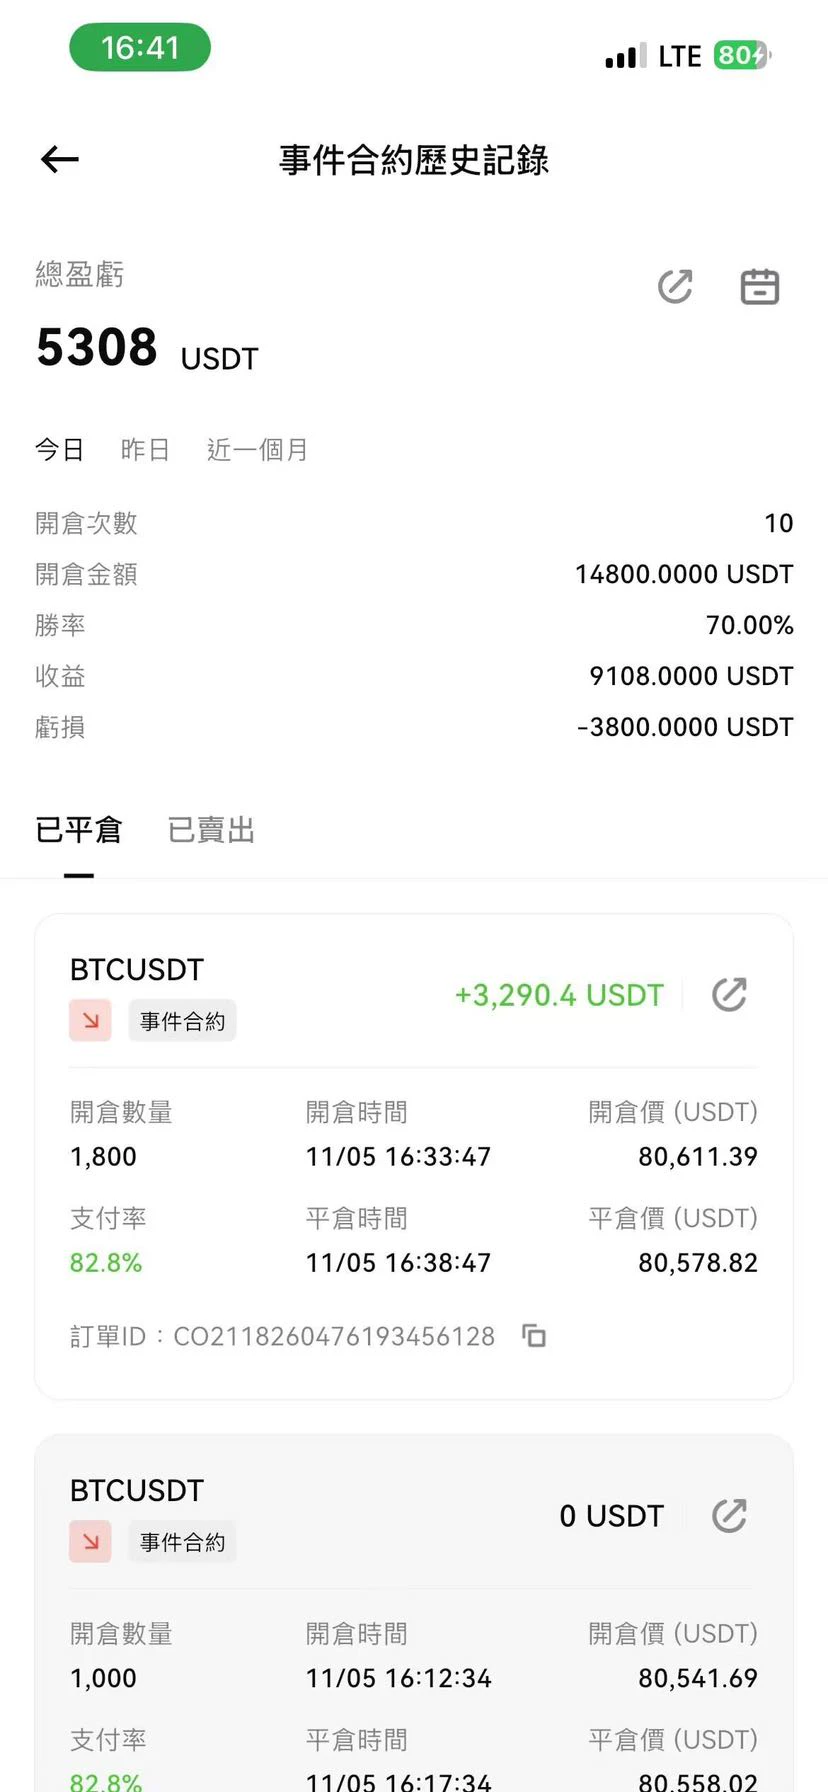
#事件合约 Just luck; I don’t make money every day. In a one-way market, I blindly short. $5,000 in my pocket
post-image
Public trade: Shorted HYPE at the top. Those who followed this trade made a killing. It never even returned to the entry price or hit breakeven—smooth sailing all the way.
HYPE+0.33%
The U.S. Job Market Suddenly Springs Back to Life! ADP Adds 86k Jobs—Will the Fed Have Another Headache?

The U.S. job market has delivered another surprise to the markets! The latest ADP data show that the private sector added 86k jobs in October 2026, well above market expectations of 69k. It seems U.S. companies’ appetite for hiring has not completely faded.
What does this report mean? Simply put, the U.S. economy has not yet seen the steep jobs downturn many feared. Companies are still hiring, and the labor market remains somewhat resilient.
However, the Fed may not be celebrating. If the
PEPE+1.05%
  • 1
📡 Signal Card | Source: Aesthetic_Meow
$LYN Long position, five key details: Time: just spotted, exact time not specified Entry: 0.02188 Target: 0.022256 / 0.022456 / 0.022631 Stop-loss: 0.021379
Funny, I only reposted TA’s $T trade earlier today, and here we go again—quite the prolific one 😂
Your sis just reposts these; whether to follow and how much to put in is up to you, dear. Check the stop-loss price before making a move.
Shared as a personal record, not investment advice. #NonfarmPayrollsAreComing, can employment data strengthen expectations for a December rate hike?
LYN-0.44%
TA+10.20%
The Nasdaq fell 5.5% in a single day. Using its previous high of roughly 18,000 as a ballpark, that works out to a nearly 1,000-point pullback in one session, sending it straight from the highs into correction territory. The S&P 500 followed with a 4.4% drop, or more than 260 points based on a level near 6,000. The main thing getting hit in this selloff is still the AI data center story—valuations were cut across the board for computing power, servers, power supply, cooling, optical modules, and related areas. On the market, the hardest-hit subsectors were those that had rallied the most. One
post-image
NAS100-0.07%
SPX+0.33%
  • 6
  • 2
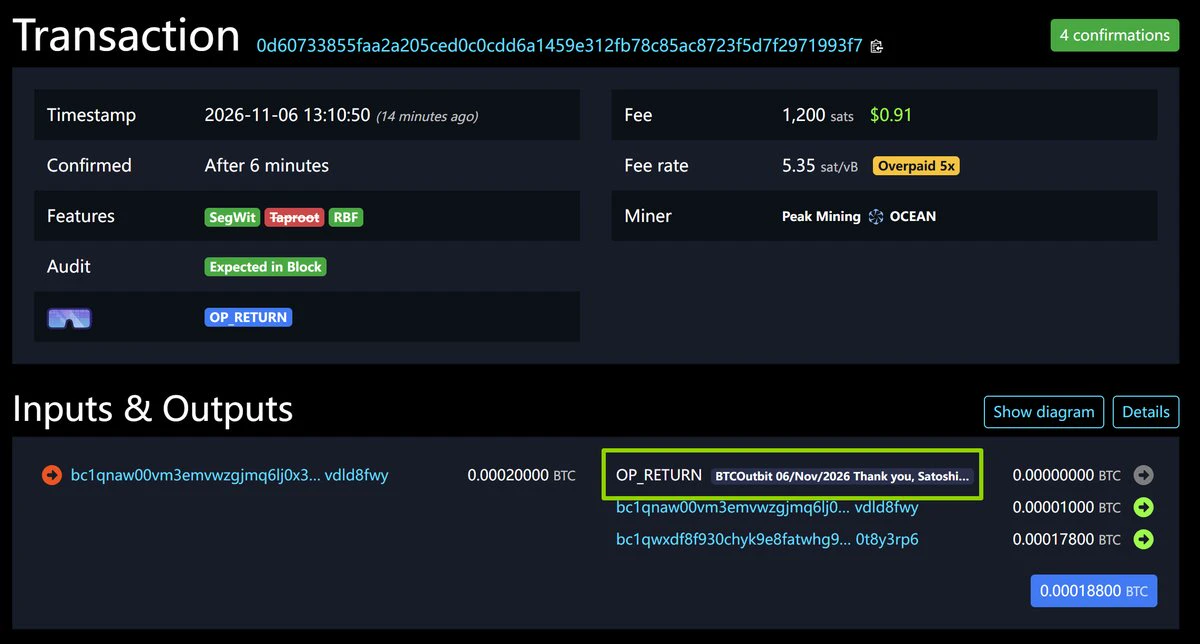
On Jan 3, 2009, Satoshi left a message in Bitcoin's first block.
Today I left one in block #974735: the hash of a letter on what I'm giving back to Bitcoiners.
You'll read it on Thanksgiving. Until then, nobody can change a word. Not even me.
Day 1/21
post-image
BTC-0.67%
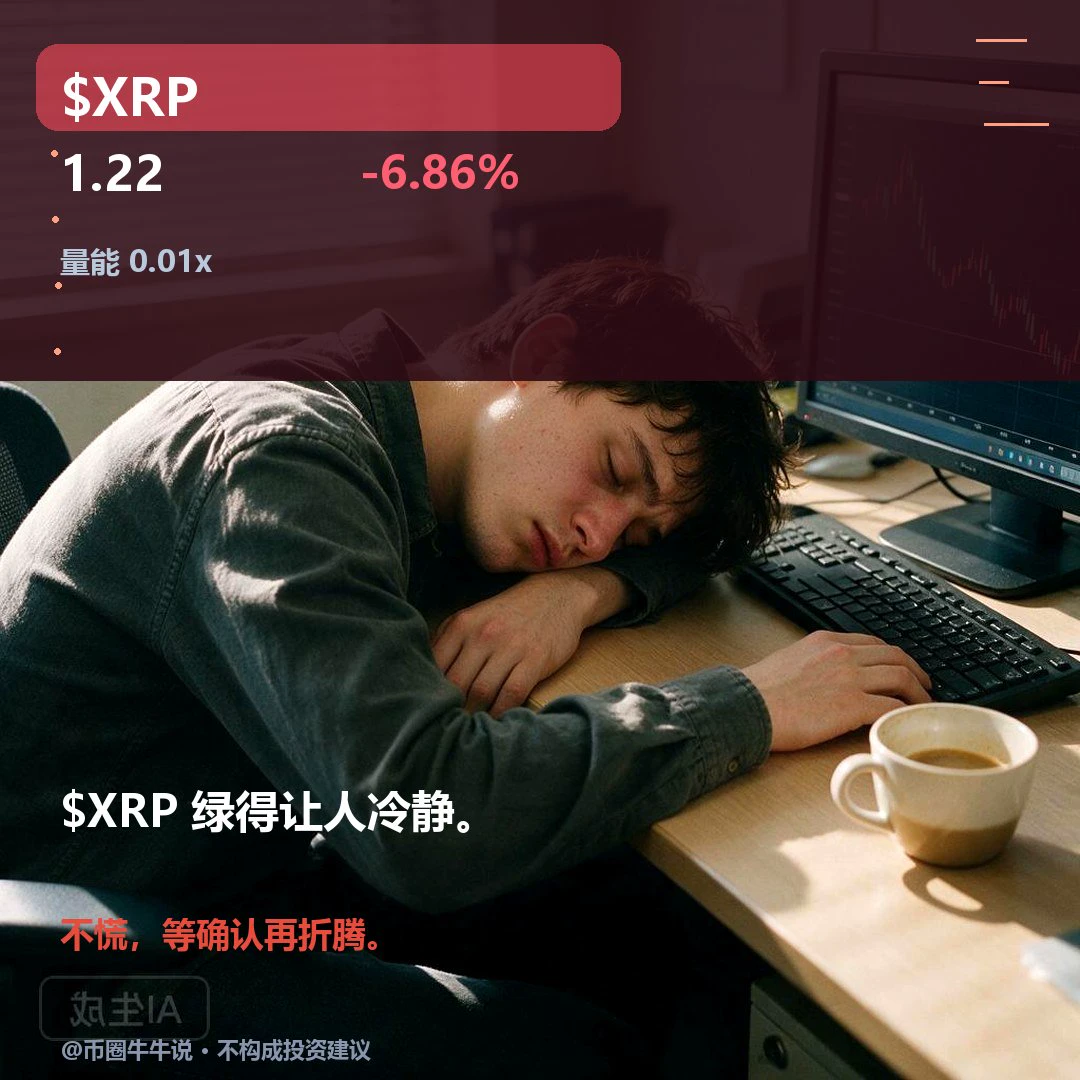
$XRP Currently trading at 1.2181, down 6.86% over 24H, with an intraday range of 1.1995–1.3269. 1H is weak: RSI is 18.53, and the current price is below the EMA20 at 1.2490; 4H is weak: RSI is 37.18, and the current price is below the EMA20 at 1.2664. The 1H volume ratio is 0.01. If price holds above the 1.3269 resistance level, watch for continuation; if it breaks below the 1.1995 support level, the short-term outlook weakens. In a later review, check whether price can hold above 1.3269 and whether it can reclaim 1.1995 after losing that level; with volume at only 0.01x, a single break needs
post-image
XRP-1.15%
BTC PREDICTION MARKET UPDATE
live-cover
LIVE2,386
Morning updates with beautiful girl
live-cover
LIVE2,155
Don’t let the numbers mislead you; those figures don’t point to a market collapse, but rather to an entirely different structural mechanism.

The real story lies within a historic wave of selling—triggered in the artificial intelligence and semiconductor sectors following the U.S. midterm elections—that rippled across the Pacific all the way to Seoul. What unfolded on Thursday, November 5, 2026, was more than just a correction; it was a watershed moment—a stress test for the AI trade, challenging both its valuations and the underlying policy landscape.

Just how severe was the sell-off on Wall
post-image
User_any
The shift from green to red numbers on stock market screens is not the real news; the true story lies in the fundamental mental shift behind that red.

What unfolded in the U.S. markets on Thursday was not merely an ordinary sell-off, but a profound rupture in how the "artificial intelligence trade" is valued and how its risks are perceived. As the Nasdaq closed the day down 5.5%, the semiconductor index suffered its worst performance since 2020, plunging as much as 12% in a single session. Nvidia fell 9%, AMD and Micron dropped 17% each, and Qualcomm slid 12%—altogether, approximately $2.5 trillion in market capitalization evaporated.

What lies on the surface of this sell-off?

The spark was ignited by concerns regarding potential regulations on data centers and AI infrastructure following the election results. Investors began to price in the possibility that the construction of data centers—the backbone of the AI economy—might slow down. According to an analysis by one firm, roughly 30% of the projected data center capacity in the U.S. through 2028 is now at risk due to construction delays. A disappointing earnings outlook from a major chipmaker proved to be the final straw.

However, the core shift is that the AI narrative has evolved from a simple "growth story" into a rigorous test of profitability and financing. Valuations that ballooned during years of low interest rates can no longer be sustained by the same narrative in an environment of high interest rates and tighter financial conditions. The deleveraging process that funds have been undergoing for months was already a clear sign that this mental shift was well underway.

Why couldn't crypto escape this sell-off? The crypto market was not immune to this sell-off. On Thursday morning, Bitcoin was trading above $80,000, only to fall below $76,000 within hours, while Ethereum lost more than 8% of its value. The total crypto market capitalization shrank by approximately $137 billion.

The underlying cause is not merely a deterioration in general risk appetite, but also the tangible link crypto has forged with artificial intelligence infrastructure. Major Bitcoin miners are selling off their holdings to finance AI data centers; consequently, any instability in the data center narrative directly impacts Bitcoin supply and the economics of mining. Leveraged positions turned the decline into a wave of panic selling—roughly $370 million worth of leveraged crypto positions were liquidated in just one hour, the vast majority of which were bullish bets.

Is this a correction, or a new regime?

The market is currently pricing in two distinct scenarios. On one hand, some argue that this is merely a temporary correction—a liquidation of overheated AI-related positions. On the other, some believe that AI valuations remain detached from reality and that this does not represent a buying opportunity.

What matters is not so much which side is correct, but rather recognizing that the market is no longer driven by the same narrative. The triad of valuation, policy, and liquidity is being recalibrated.

The "AI trade" was fueled for years by low interest rates and abundant liquidity; now, high interest rates, tighter financial conditions, and regulatory uncertainty have entered the equation. The fact that 30% of data center capacity is at risk is not merely a construction issue; it is a matter that affects the timing of the entire supply chain.

On the crypto front, the liquidation of assets by miners and the unwinding of leveraged positions illustrate how macro shocks can trigger a chain reaction. In other words, a reassessment of valuations in the artificial intelligence sector can directly impact the supply of Bitcoin.

There is no single answer to whether this wave of selling marks the beginning of the end for the AI trade, or if it is simply a sharp "breather" within a long-term bull market.

What you should monitor is whether valuations are being validated by profitability, how the regulatory framework regarding data center permits takes shape, and whether spot demand emerges once leveraged positions have been cleared out. In the face of macro shocks, the narrative shifts rapidly, but it takes time for the true direction of capital flows to become clear.

This content is for informational purposes only and does not constitute investment advice.

#USStocksFaceHistoricSelloff
#Gate股票畅聊季 #GateStockTalkSeason #GateSquareTradingChallenge
#ShareWeekly
$US30 $NAS100 $AMD $MU $NVDA
repost-content-media
MU-17.23%
AMD-17.64%
SNDK-22.24%
TSLA-10.84%
INTC-10.58%
  • 11
Wall Street’s attitude has changed! AI trading faces a major test: Should investors watch Nvidia or the Magnificent Seven next?

AI was once the hottest theme in the US stock market; now, it has become the keyword making investors most nervous.
On Thursday, the Nasdaq fell more than 5%, and the Philadelphia Semiconductor Index dropped more than 12%, as chip and AI-related stocks plunged across the board. Market sentiment shifted sharply, and Wall Street began reassessing the valuation logic of tech giants.
So, who should investors focus on next?
First, chipmakers. They directly benefit from de
AMD-17.64%
  • 9
Brother Ma @elonmusk, give me some tokens. I can't take it anymore. Please, bro, just a little. I won't touch it again, I swear. Please, bro. Really, just a little. I swear I'll never touch this stuff again. I can't take it anymore, bro. I'm tossing and turning and can't sleep. Bro, I'm begging you, just give me a little. Give me some more, bro. I can't take it anymore. Please, bro, I feel like ants are crawling all over me. I feel like my whole body is shaking. I can barely breathe. Please, bro, just a little. I won't touch it again. Please, bro. Really, just a little. I swear I'll never touc
post-image
TOKEN-0.16%
#美股史诗级抛售 #Gate股票畅聊季 Epic crash! U.S. AI stocks plunge 12%—what comes next?

On November 6 U.S. time, global capital markets saw their bloodiest single-day rout since April 2025. All three major U.S. indexes plunged, with no rebound in sight:
▪ Dow Jones Industrial Average fell 3.44%
▪ S&P 500 plunged 4.35%, its biggest single-day drop in 7 months
▪ Nasdaq sank 5.52%
▪ Nasdaq 100 plunged 6.4%, wiping out more than $2.3 trillion in market value in a single day.
The real disaster, however, was concentrated in this year's strongest theme—the AI computing hardware supply chain.
This was no ordinary
SPYX+0.01%
SNDK-22.24%
WDC-17.39%
MRVL-16.62%
GLW-12.90%
  • 6
11.6 ETH Analysis

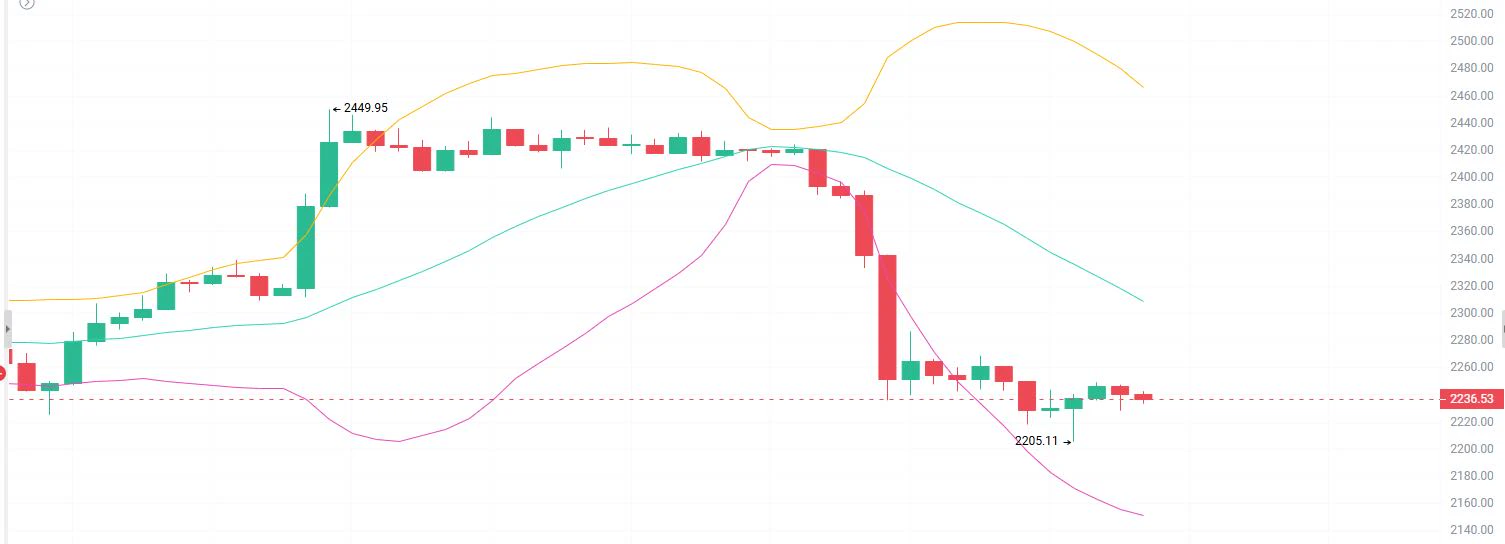
Analysis: Short near 2250-2270 on a rebound, with a stop at 2290. First target: 2220; second target: 2205.

The actual 1H chart shows that after rising to a period high of 2449.95, the price came under pressure and pulled back, closing with a long bearish candle on increased volume and breaking through key support levels in succession. It dipped to a low of 2205.11, and is currently quoted at 2238.32. The short-term uptrend structure has been broken, with concentrated selling pressure from bears. The market has officially entered a weak correction phase. After becoming overs
post-image
ETH-1.26%
Load More

Join 40 M users in our growing community

⚡️ Join 40 M users in the crypto craze discussion

💬 Engage with your favorite top creators

👍 See what interests you

Trending Topics

USStocksFaceHistoricSelloff

1 Views3.45k Discussing

U.S. stocks suffered a sharp selloff on Thursday, with the Nasdaq closing down more than 5% and the Philadelphia Semiconductor Index falling over 12%. AI and chip stocks including $NVDA and $AMD were hit especially hard. Markets are reassessing AI valuations, data-center spending and future returns. Is this just short-term deleveraging, or the start of a deeper correction in the AI trade? Which sectors are you watching next?

GateLaunchesPoSECProofOfSecurity

10.9k Views561 Discussing

USNonfarmPayrolls

8.57k Views3.97k Discussing

View More