Share your thoughts
placeholder
Article
This trend doesn’t even require me to think—the account is dancing on its own. A few nights ago, the last thing I saw before bed was $WLD holding firm after a pullback, with the key level intact and buying pressure strengthening, so I casually reminded everyone: don’t panic, the structure is still there. Then I woke up to find it had done the job all by itself.

It pushed from 0.3669 all the way to 0.4026, with +696.7% right before our eyes. It was really sluggish at first, but the result is truly satisfying. Those already on board should have woken up laughing.

Take 70% off first—don’t ge
post-image
WLD-3.29%
SOL-1.45%
DOGE-2.07%
Gold is currently in a period of consolidation after the decline, with the market awaiting Friday’s CPI inflation data. The data will directly affect expectations for Federal Reserve policy, and the market will likely experience significant volatility.
From the candlestick structure, the support area below remains fairly resilient. As long as key support holds, there is room for a rebound and recovery, so the strategy is mainly to go long on pullbacks.
Once the price pulls back to the 4300-4320 support range and stabilizes, consider a short-term long position, targeting 4350-4380. If support a
post-image
XAUT-1.70%
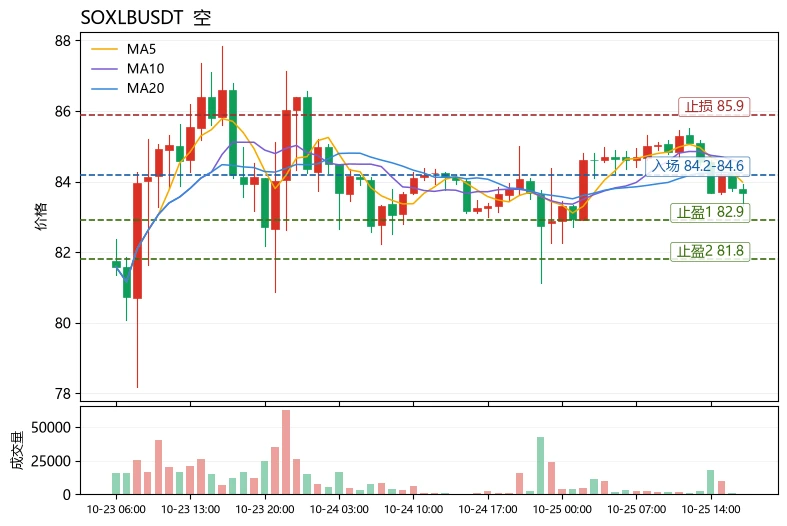
Everyone is missing the one signal that makes SYMBOL a setup for a 10% drop.

$BZ /USDT - SHORT

Trade Plan:
Entry: 111.14 – 111.62
SL: 114.37
TP1: 109.14
TP2: 107.65
TP3: 105.41

Why this setup?
Why now? The 4h trend is range-bound, but the 1h ATR of 0.956936 confirms enough momentum to push through the range. The 15m RSI at 72.76 shows the asset is overbought, meaning a reversal is overdue. The entry zone between 111.14 and 111.62 sits right at the 1h price of 111.31, offering a precise trigger for a short. TP1 at 109.14 and TP2 at 107.65 define a realistic two-tier profit target, while t
BZ+5.87%
You'll become a profitable trader once you understand this.
post-image
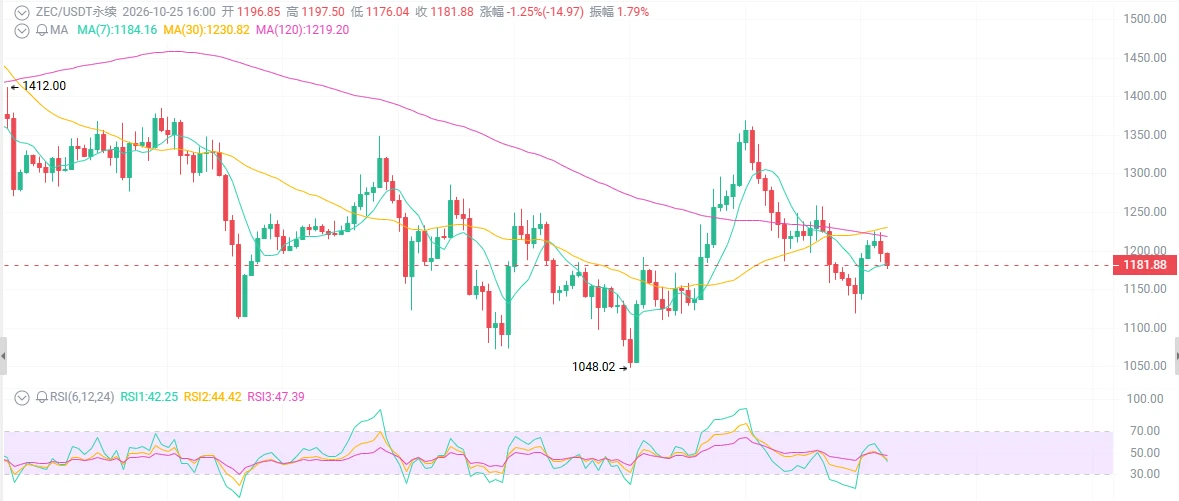
I was just about to go in and rant, but then I looked at my account and thought, forget it—let it pump however it wants, I’ll keep quiet. When the screen was glowing green, I was still wondering if the problem was me. Then, the last thing I saw before bed a few days ago was that my short was already deeply underwater. That false breakout at the top failed to attract volume, and the buying support was completely scattered. I said at the time that a move up with no one there to catch it would eventually have to give it all back. Riding it down from 152.22 to 103.4, +1543.88% secured—the meat fin
post-image
XRP-2.78%
SOL-1.45%
$OPG ‌OPG (OpenGradient)
📉 Short
Entry: 0.1010 – 0.1030
TP1: 0.0980 / TP2: 0.0955 / TP3: 0.0935
SL: 0.1045
📈 Long
Entry: 0.0950 – 0.0960
TP1: 0.0980 / TP2: 0.1000 / TP3: 0.1020
SL: 0.0930
🔑 Key Levels
Resistance: 0.1012 / 0.1030
Support: 0.0953 / 0.0938
⚠️ Not financial advice. DYOR and manage your risk.
post-image
OPG+2.90%
solana:7ssJZGFT3twGqeYA1kvpoMWwZYvMZvrMEbjRaWgg46BL That is why I bought at the bottom. You should do this sometimes, of course, only with projects you trust. I have sold now.
SOL-1.50%
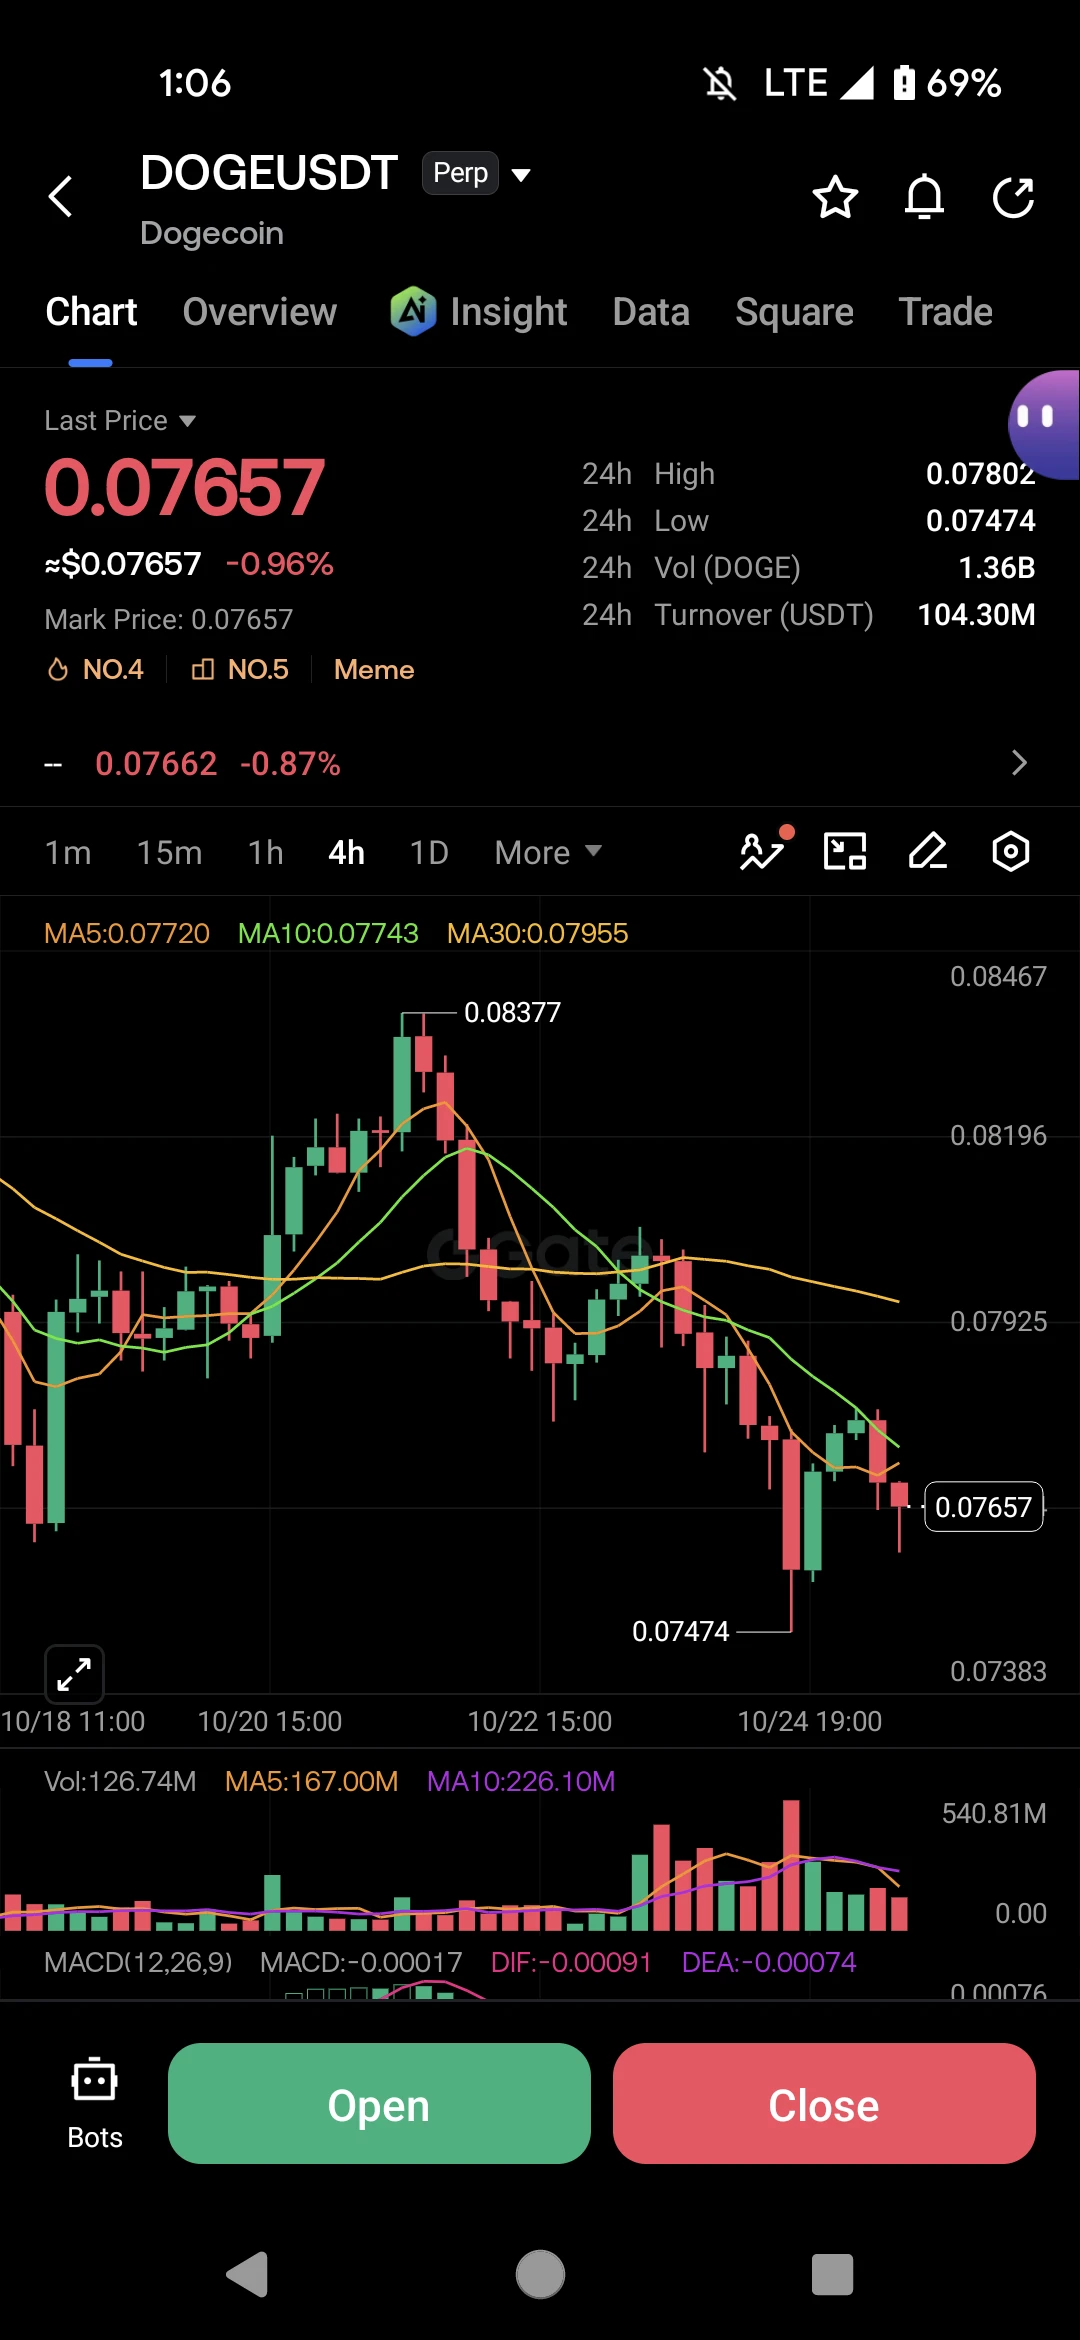
This kind of return makes me nervous, afraid the market will come to its senses tomorrow and blacklist me. When the screen is glowing green, I stay calm instead—$BEAT every surge falls just short.

A few days ago, I was watching the market in the early hours of the morning. The overhead pressure was intense, volume failed to follow, and there was no one to catch the move higher—the lack of support was obvious. I flagged a short setup at the time, entering around 0.1339 and waiting for confirmation that the rebound was losing steam.

Unexpectedly, it dropped from 0.1339 to 0.0778, delivering
post-image
BEAT-14.17%
ZEC-8.36%
ETH+0.19%
Crypto we buy, benz we drive
post-image
I’m not buying celebrity coins but I’m always down to make fun of them
GN
post-image
Everyone calling ADA a breakout candidate, but the 1h data screams short.

$ADA /USDT - SHORT

Trade Plan:
Entry: 0.2080 – 0.2096
SL: 0.2169
TP1: 0.2027
TP2: 0.1986
TP3: 0.1925

Why this setup?
Why now? The 1h price sits at 0.2088 inside a tight entry zone between 0.2080 and 0.2096, which sets up a clean short trigger. The 15m RSI at 38.49 confirms bearish momentum is still intact, not oversold enough to reverse. The 1h ATR of 0.00339 shows volatility is compressed, meaning a squeeze move toward TP1 at 0.2027 could happen fast. If that breaks, the daily range trend favors a deeper slide to
ADA-0.90%
#xaut Gold CFDs, forex, U.S. stocks, and all kinds of CFDs; one daily directional call, never wrong; grow your account 6x+ every day; subscribe to the livestream for real-time signals from major players,
XAUT-1.70%
chart circulating again.
btc still sitting under that $83-85k wall where a ton of long-term holders are at cost. never even let price properly tap it.
people already jumping to “lose 75k and it’s $60k.” possible, yeah. but those same holders haven’t been dumping and selling pressure is the quietest it’s been in a while.
feels like a range until something actually breaks, not an imminent collapse. 75k is still the line though.
$BTC
BTC-1.07%
$PYPL
retesting range low around $50 what i like - that the plan from 6 months ago still playing anyway... Paypal at support = Crypto at support last time it made low at $40
$BTC
made the bottom around $59k
$PYPL ‌
post-image
PYPL+2.21%
  • 1
  • 1
$ORCL PUMP AFTER MARKET
DOUBLE BEAT ON EARNINGS
Brrrrrr...
ORCL-5.32%
$$RVN erased a quarter of its market cap in one day. This isn't a crash; it's the market maker paying the shorts.
Look at the data: it fell 24.67% in 24 hours, with the price slammed from 0.0031 to 0.0022, now closing at 0.0023, while trading volume reached 21.9M. When retail traders see this big bearish candle, their first reaction is to cut losses and run. But let me tell you, for an old mining coin like RVN, a drop like this is when it is at its most attractive. Why? It has a large circulating supply, long-standing consensus, and no VC unlocks dumping on the market. A 24% drop has occurred
RVN-21.78%
[New Streamer] Market Prediction
live-cover
LIVE50
Even Armour can’t protect from FOMO😂
post-image
Smart money is quietly stacking XRP while the retail crowd sleeps on this setup.

$XRP /USDT - LONG

Trade Plan:
Entry: 1.3504 – 1.3572
SL: 1.3119
TP1: 1.3852
TP2: 1.4061
TP3: 1.4375

Why this setup?
Why now? The daily trend is range-bound, which means XRP is coiling for a directional burst and the 1h ATR of 0.013419 confirms enough volatility to fuel a clean move. The 15m RSI sits at 27.9, signaling oversold conditions that align with the entry zone at 1.3538, where the 1h price is currently hovering. TP1 at 1.3852 and TP2 at 1.4061 represent realistic targets if momentum shifts, while the
XRP-2.78%
Load More

Join 40 M users in our growing community

⚡️ Join 40 M users in the crypto craze discussion

💬 Engage with your favorite top creators

👍 See what interests you