Share your thoughts
placeholder
Article
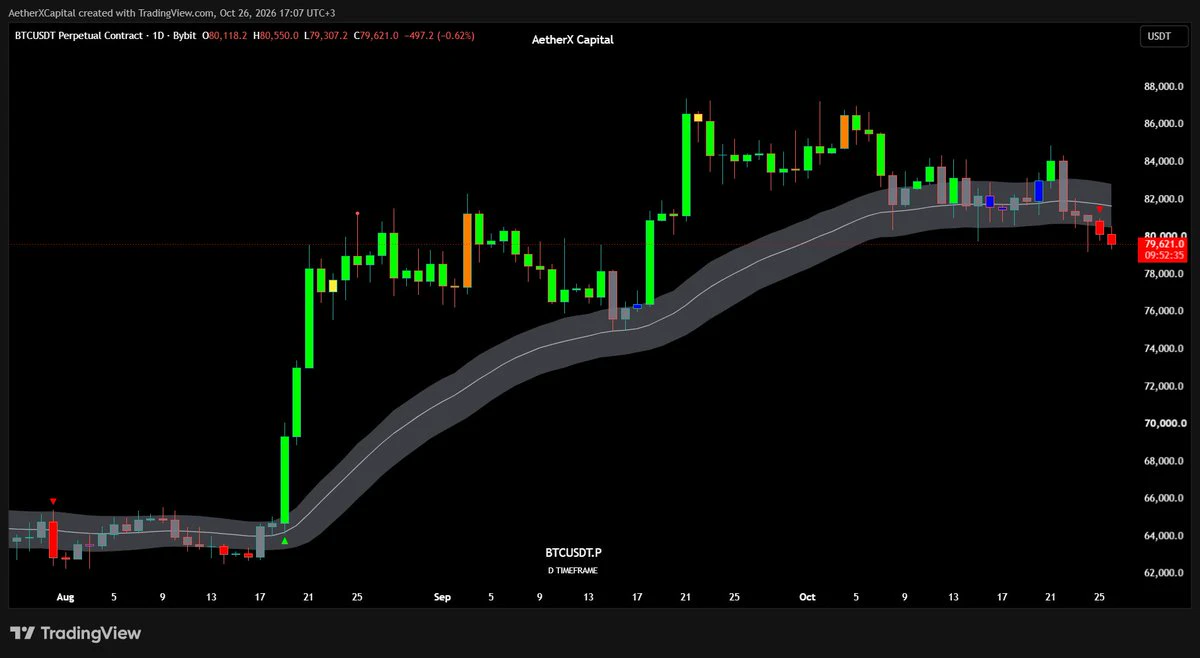
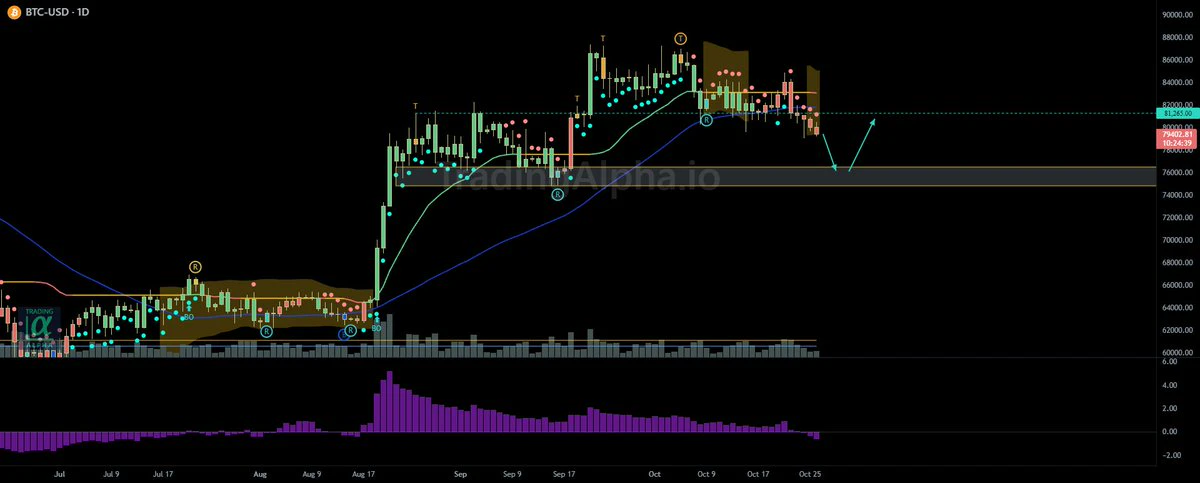
The year-end Bitcoin target price given by major global financial institutions and top AI models has reached $95,000–$150,000 per coin, while Ethereum’s target is $3,175–$4,500 per coin; patiently hold spot #BTC收复8万美元
TradingKingGaoYuliang
Core Logical Reasoning
Driver 1: Macroeconomic Monetary Environment (the Biggest Short-Term Variable)
• Current Headwind: The probability of a rate hike in September has risen to 62%, while the rate cut previously expected by the market has yet to materialize. The Fed’s dot plot shows rates at around 3.25%–3.40% by the end of 2026, but CME FedWatch pricing puts the probability of a rate cut this year below 10%.
• Key Timing: The September FOMC meeting (mid-to-late September) is the short-term watershed moment. If a rate hike is implemented, BTC could fall to $72,000–$75,000 in the short term; if the Fed unexpectedly pauses, the Q4 rally could begin immediately.
• Powell’s Term: His term expires in May 2026. Changes in the Fed’s leadership will bring policy uncertainty, but the market has gradually priced this in.
Driver 2: ETF Fund Flows (Structural Support)
• Pressure in the First Half: Spot BTC ETFs saw monthly net outflows of $4.06 billion in June, the largest redemption record since their launch, directly causing BTC to fall from $110,000+ to the July low of $59,000.
• A Turning Point in August: Over the past 60 days, Bitcoin whales have accumulated approximately $2.75 billion, while ETFs turned back to net inflows in late August (exceeding $1 billion in a single week). Exchange balances continue to decline, with investors shifting to cold storage, indicating that selling pressure is drying up.
• Solid Cumulative Base: Cumulative net inflows into spot BTC ETFs remain at approximately $55 billion, with total assets under management of around $109 billion. This is the biggest difference between this cycle and previous ones—institutional capital is already in the market rather than waiting on the sidelines.
Driver 3: Cycle Position (Deeply Corrected)
• BTC’s maximum decline in the first half of 2026 was approximately 30% (from $111,000 at the beginning of the year to $59,000 in July), and its current price of $80,000 is in the middle of a rebound.
• Historically, in post-halving cycles (the April 2024 halving), the second Q4 often sees a second wave of gains due to reduced miner selling pressure and an institutional allocation window.
• However, it should be noted that this cycle is more institutionalized, so volatility may be smoothed out, making a repeat of the multi-fold gains seen in 2021 unlikely.
Driver 4: Ethereum’s Independent Logic
• ETH/BTC Exchange Rate: Currently around 0.031, it is in a historically low range. If risk appetite recovers in Q4, ETH typically has greater upside elasticity.
• Stablecoins and Tokenization: Standard Chartered raised its year-end ETH target from $4,000 in June to $7,500, primarily because the growth in network utility driven by stablecoin issuance and asset tokenization has not yet been reflected in the price.
• Yield Characteristics: ETH staking provides an annualized yield of approximately 3%–4%, making ETH more attractive than BTC as an “interest-bearing asset” in a falling-rate environment.
• Risk: Spot ETH ETF inflows remain consistently weaker than those of BTC. If this trend continues, ETH may continue to underperform.
IV. Key Indicators to Watch (Tracked Over the Next 3 Months)
1. September FOMC Decision: Rate hike vs. pause will determine the direction of Q4’s opening
2. Weekly Net Inflows into Spot BTC ETFs: Three consecutive weeks of positive inflows = confirmation of a bottom
3. Whether BTC Can Hold Above $85,000: This is the 200-day moving average level; holding above it would open up room toward $100,000
4. ETH/BTC Exchange Rate: A break above 0.035 = a signal that ETH is beginning to outperform
5. U.S. Inflation Data: If CPI continues to decline, rate-cut expectations will heat up again#美国8月非农超预期
BTC+0.31%
ETH+1.86%
Is the cost too high? 😭
post-image
This move is so clear, I don’t even need to think—the account is dancing on its own.

The last thing I saw before bed a few days ago, $SOL was still moving sideways at the bottom, with buying pressure gradually strengthening—a clear sign it was building momentum. I figured the risk at this level was limited, so I placed my position there, set a stop-loss, and went straight to sleep.

Then I woke up this morning to find the price had shot straight to 106.55. From 84.84, the paper gain is +2380.4%.

Feels great, but don’t be greedy for the last bite. I took profit on 80% first, moved the rem
post-image
SOL+3.92%
ZEC+16.79%
ETH+1.83%
The rate-hike knife went dull in two days
Friday’s nonfarm payrolls blew past expectations
The probability of a rate hike hit 70%
I bet this knife would cut down risk assets
Gold took a hit
Then recovered in two days and is still rising
Crypto wasn’t scared
SOL led the way, up 3%
I bet the rate-hike knife would cut the market down for a week
It cut air instead
I admit it
Rate hikes can’t scare this market
I was wrong and need to rethink it
But SOL rallied 3% on its own over the weekend in thin liquidity
I can’t tell whether it’s a breakout or distribution, so I’m st
post-image
GLDX+0.53%
PAXG-0.07%
SOL+3.94%
Pons delivers 150x returns
live-cover
LIVE1,784
Everyone’s staring at MARSCOIN’s 15m RSI at 32—but what if that’s the trap that empties your account?

$MARSCOIN /USDT - SHORT

Trade Plan:
Entry: N/A – N/A
SL: N/A
TP1: N/A
TP2: N/A
TP3: N/A

Why this setup?
The 4h frame just armed a SHORT signal at 0.19859, yet the 1D trend is flat—not falling. RSI 32 on the 15m screams “oversold bounce,” not continuation.
• Why now? Weak confidence (55.4) means this isn’t a slam dunk—it’s a scalp, not a swing.
• Price is stuck in a range, so shorts work only if you’re fast and tight.
• No TP or SL printed? That’s your warning: volatility is thinner
MARSCOIN-16.55%
All the ladies i know use $TAMPONS
Wood nourished in cycles, wealth flowing endlessly
Moonlight compounds profits, water’s momentum generates wealth
Seize opportunities and momentum, secure your gains
post-image
$WLD is showing strong bullish momentum on the 4H timeframe. Price has reclaimed the short-term moving averages and is trading above the 0.40 area, while the recent breakout suggests buyers are gaining control.
Direction: LONG
Entry Zone: 0.4020 – 0.4100
Take Profit: TP1: 0.4195
TP2: 0.4278
TP3: 0.4350
TP4: 0.4450
Stop Loss: 0.3930
Leverage: 10x maximum
The key level is 0.40. If WLD holds above this area after a pullback, the bullish continuation remains valid. A decisive break below 0.3930 would invalidate the setup.
Use controlled leverage and proper risk management.
$WLD ‌
post-image
WLD+3.86%
boner-coin:native with @RoaringKitty
0x98096d17e191b3da1d5f99a6d7b3584351b11e18
Been stuck in at thjs $27 - $28 million for a bit
Potential to run 2x to $60 million
$METIS
UPDATE
#METIS already breakout done. We can see 40%+ gain here ✍🏻
#METISUSDT #METISBTC #BTC #Bitcoin #NFTs
post-image
METIS+18.17%
BTC+0.31%
  • 2
JUST IN: China launches the National Anti-Fraud AI App to assess risk and provide prevention guidance using LLMs and multimodal tech. Could boost consumer trust and curb fraud around digital assets and fintech services. $BTC $ETH
post-image
BTC+0.31%
ETH+1.86%
Today Crypto Markets News
live-cover
LIVE1,558
#HYPEBreaks88HitsNewAllTimeHigh HYPE Breaks $88 & Hits a New All-Time High!
Hyperliquid’s native token HYPE has once again captured the crypto market’s attention, climbing to a fresh all-time high around $88. Recent data shows HYPE gaining more than 51% over the past month, highlighting the strength of its current bullish momentum.
What’s driving the rally?
• Strong buying momentum and renewed market confidence
• Significant HYPE token buybacks supporting demand
• Large-holder accumulation adding to bullish sentiment
• Growing attention toward Hyperliquid’s decentralized trading ecosystem
post-image
HYPE+3.81%
#交易机器人 , come copy-trade me. I only used 5x leverage but achieved average daily returns of around 20%.
post-image
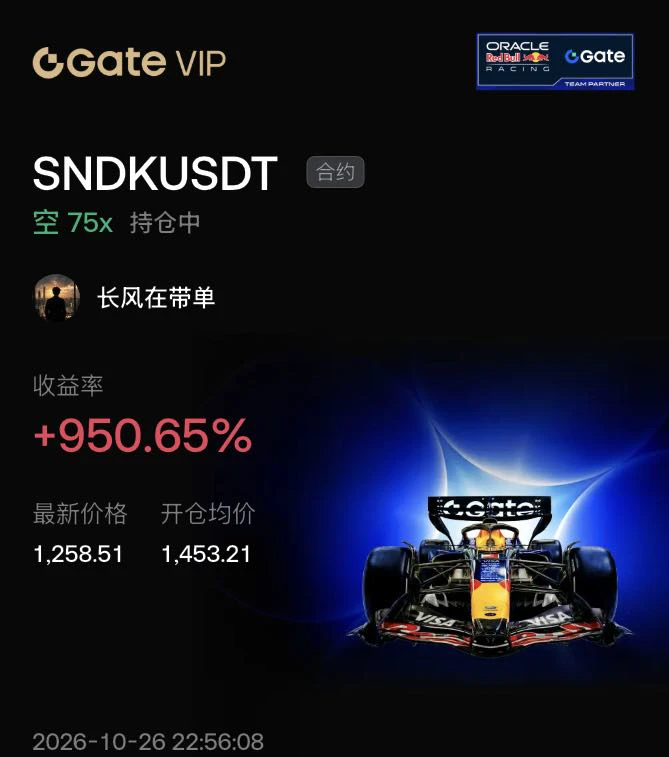
Everyone’s still calling ZEC bullish—but the 4H tape just whispered a secret nobody heard yet.

$ZEC /USDT - SHORT

Trade Plan:
Entry: 1164.47 – 1178.43
SL: 1258.51
TP1: 1106.15
TP2: 1062.62
TP3: 997.32

Why this setup?
Why now? Your 1D trend says "up," but that’s the trap. The 4H structure is flipping SHORT with 84% confidence while price stalls at 1171.45—right under that 1178.43 rejection zone. RSI on the 15m is cooling at 56.6, meaning buyers are losing steam, not gaining it. ATR of 27.9 on the 1H shows volatility is ripe for a snap. Targets aren’t dreams: TP1 at 1106.15, TP2 at 1062.62
ZEC+16.79%
$DOGE #DOGE
Broken Falling Wedge.
Successful retest could trigger a solid bullish wave during coming days✍️
DOGE+4.49%
$IOST Signal】1H pullback continuation, short-term long trade plan
$IOST After a 21% surge, entered consolidation; 1H high 0.0008125, low 0.000725, current price 0.000744. 1H MACD bearish crossover but the green histogram is narrowing; RSI fell from 61 to neutral-to-strong territory. 4H MACD remains in a bullish trend, Bollinger Bands are contracting, and bulls and bears are temporarily balanced. Order book depth imbalance is -9.14%, with slightly weaker aggressive buying and no signs of large-scale outflows yet. Funding rate is 0.01%, OI is stable, and there is currently no obvious leverage r
post-image
IOST+21.50%
BTC+0.31%
ETH+1.86%
SOL+3.94%
$ARB
UPDATE
#ARB is moving as predicted. Already 60%+ gain so far. ✍🏻
This is how we are cashing Market in VIP Room 👩‍💻👩‍💻👩‍💻
Join us today and start enjoying from day first 🤑🤑🤑
Already biggest discount offer available 70 USDT for lifetime Package✅
VIP:-
#ARBUSDT #ARBBTC #BTC #Bitcoin #Crypto
ARB+45.98%
BTC+0.31%
Everyone’s watching DOGE bounce—but the 4h chart is quietly screaming something else.

DOGE/USDT - SHORT

Trade Plan:
Entry: 0.08966 – 0.09026
SL: 0.09284
TP1: 0.08780
TP2: 0.08636
TP3: 0.08420

Why this setup?
- Price is pinned at 0.08996, but the real story is the **range-bound 1D trend**—no momentum to break out.
- RSI (15m) at 41.85 says buyers are already exhausted, not reloading.
- The short setup is armed: entry 0.08996, TP1 at 0.08780 (−2.4%), TP2 at 0.08636 (−4%).
- Why now? The ATR (0.001199) is tight—this coil tends to snap downward when volume fades, not up.

Debate:
Are
DOGE+4.43%
Load More

Join 40 M users in our growing community

⚡️ Join 40 M users in the crypto craze discussion

💬 Engage with your favorite top creators

👍 See what interests you

View More