




Square
Following
Hot
News
Profile
Share your thoughts
placeholder
Article
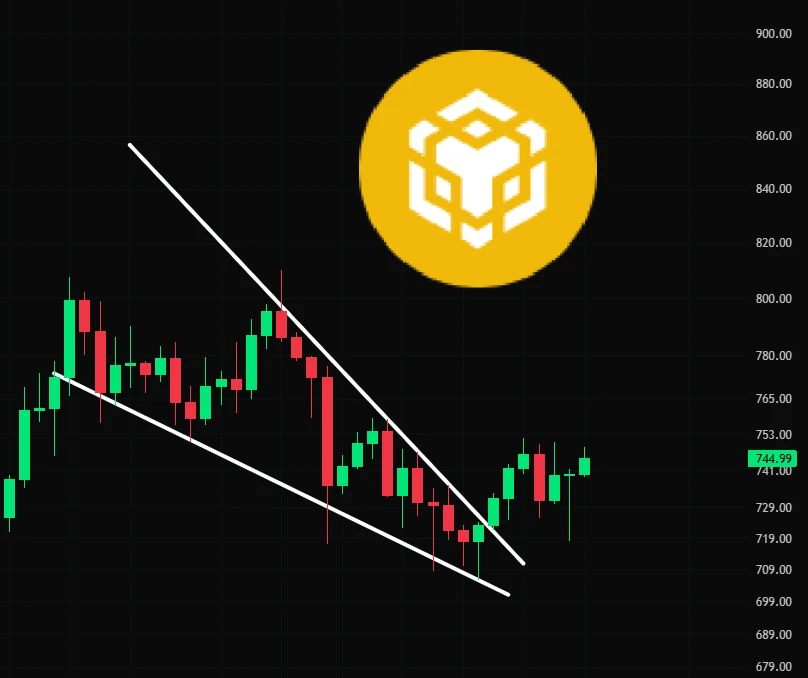
#BNB� is currently looking stronger than the rest of the market.
Let's keep an eye on it...
post-image
BNB+0.81%
crypto Market updates
live-cover
LIVE1,103
Trenches
STONK
S
bade
b
STONK
6GmA...UNgx
Market Cap
$.
Change
.
24h Vol
$.
Holders
.
BTC
B
bade
b
BTC
C5xp...pump
Market Cap
$.
Change
.
24h Vol
$.
Holders
.
CNPY
C
bade
b
CNPY
0xc6...ddd2
Market Cap
$.
Change
.
24h Vol
$.
Holders
.
LAUNCH
L
bade
b
LAUNCH
AhBi...Qj6C
Market Cap
$.
Change
.
24h Vol
$.
Holders
.
ZIG
Z
bade
b
ZIG
0x8c...1145
Market Cap
$.
Change
.
24h Vol
$.
Holders
.
Franklin Templeton, with $1.79 trillion under management, now has $56.10M of its BENJI money market fund on Arbitrum.
That is more than the $48.35M of the fund on Ethereum, one of eight networks it runs on.
@arbitrum
BENJI-1.11%
ARB+1.69%
ETH-0.15%
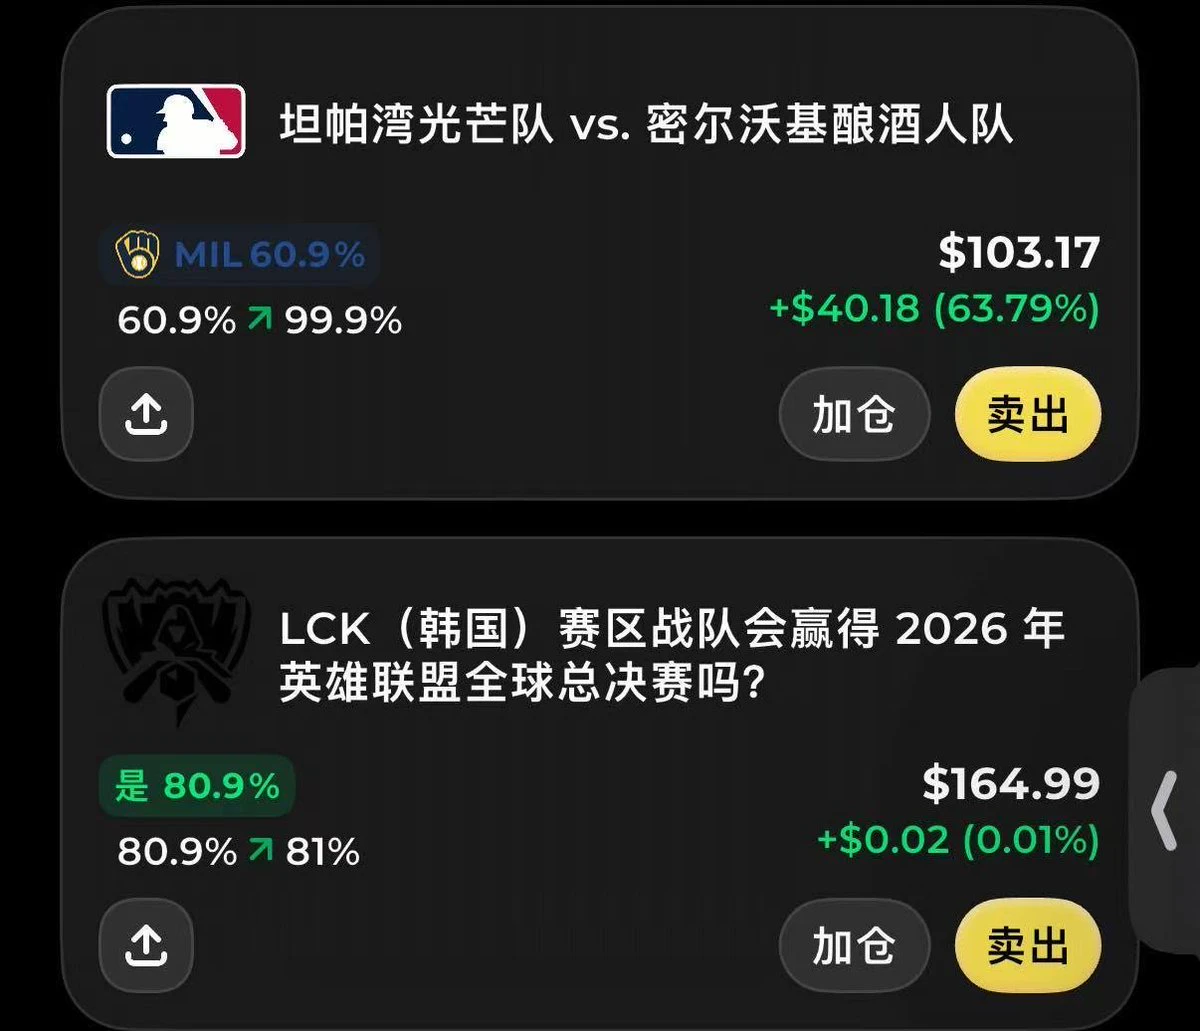
World Series Game 2 recap
Rays 4–5 Brewers (series 0–2)
Opening: The Rays dominated
Top of the first, Pratt’s throwing error opened the door,
consecutive hits + Liam Hicks’ two-run homer,
and suddenly it was 4–0.
Middle innings: The Brewers grind out at-bats and rally
Contreras and Mitchell immediately clawed back 2 runs in the bottom of the first;
Aranda’s error in the fourth gave them another run, making it 4–3.
Frelick’s game-tying homer in the sixth,
then rookie Pratt’s opposite-field hit put them ahead in the seventh.
Actually, besides the champion being the Brewers from the National Leag
post-image
Shorts dump it down 22.5%, $ANIME volume ratio 5.938—I’m bullish
$ANIME Currently at 0.00291, down 22.5% in 24h. I’m bullish at this level—the shorts are dumping their bags to you.
Futures sentiment is bearish, with a funding rate of -0.00064505 and a long-short account ratio of 0.9124. Shorts are overwhelmingly dominant. But spot isn’t buying it: 24h trading volume is 5564918 USDT, and the volume ratio has hit 5.938, with huge volume being fully absorbed. Daily RSI at 63.3 is strong; MACD has formed a golden cross below the zero line, and the red bars are still growing.
The headwinds are rea
ANIME-27.73%
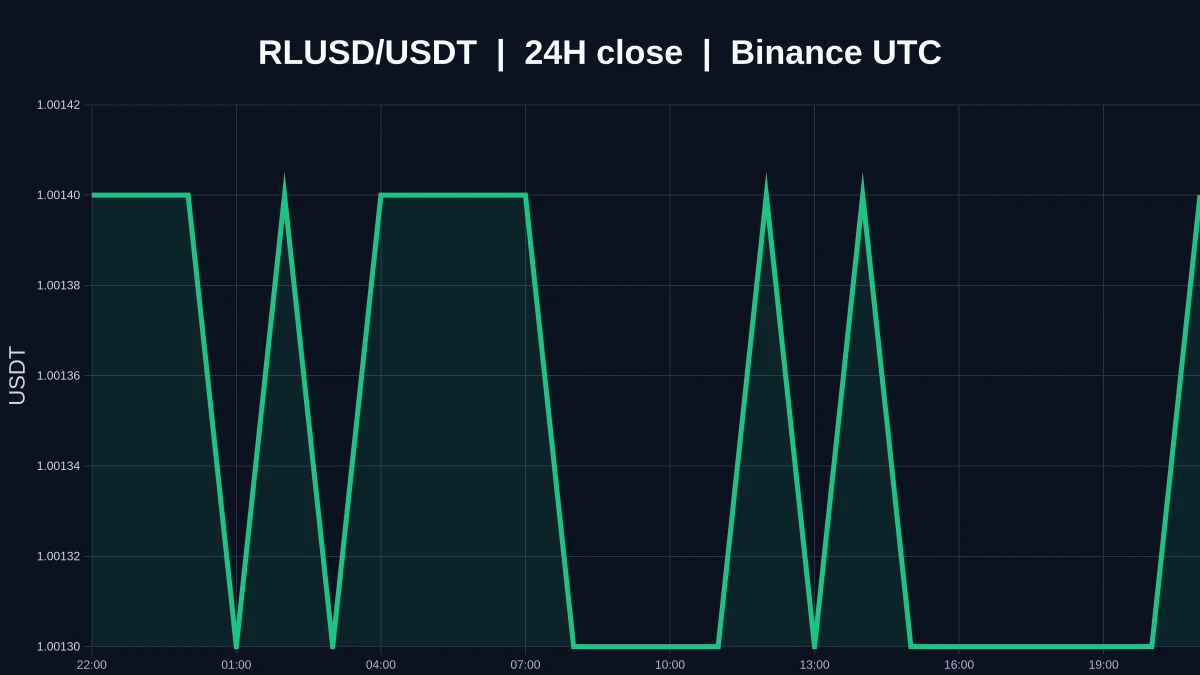
$RLUSD Currently quoted at 1.0013, 24H +0.00% (range: 1.0012–1.0015). The 1H trend is moderately strong, with RSI at 50; the 4H trend is moderately strong, with RSI at 62. If it holds above 1.0015, continue watching for upside potential; if it breaks below the 1.0012 support, the short-term structure may weaken. Market volatility is high; for observation only.
post-image
RLUSD+0.00%
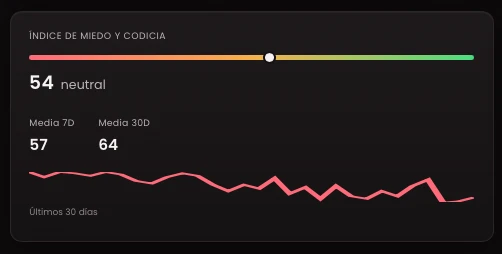
The market's greed is running out
Time to stay alert
post-image
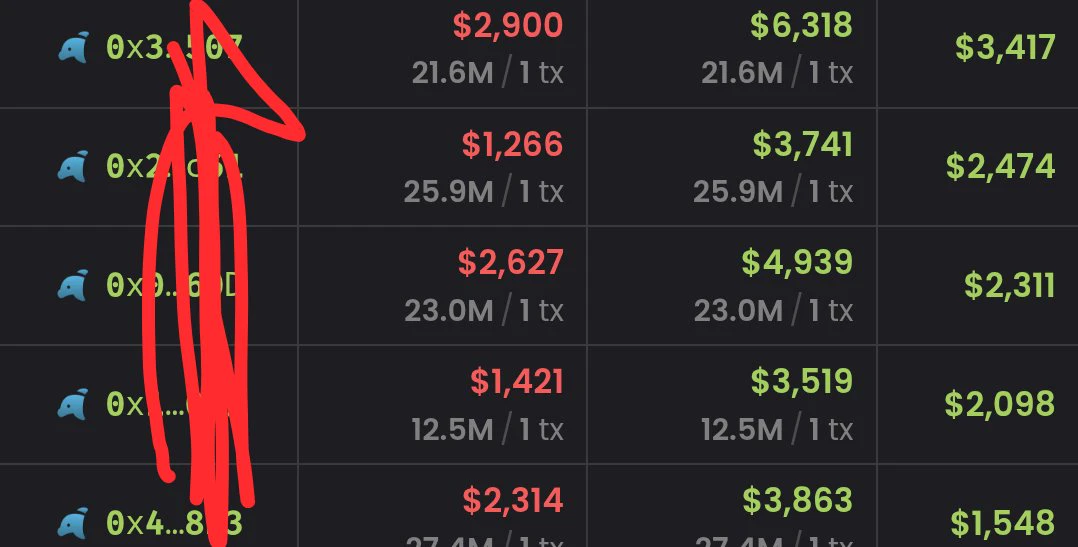
Check the transactions. God is good and crypto is a blessing ❤️
post-image
market update
live-cover
LIVE585
$BTC Current price 80489. The leveraged long/short ratio remains elevated, with borrowing to go long clearly outweighing borrowing to short. The market has pulled back a little, but bullish sentiment remains strong—when sentiment is this aligned, it’s worth staying alert for a potential reversal. 80000 is the short-term dividing line between strength and weakness. Don’t rush to draw conclusions before key news breaks.
$ET 2346. The long/short ratio is also rising, with bulls continuing to increase their borrowing to go long. The price is weakening along with the broader market, with little ind
post-image
BTC-0.07%
ET+1.94%
#Gate广场万圣节
PEPE/USDT Analysis Ahead of Halloween: Assessing the Potential for a 3x Rally
As the Halloween period approaches, market participants are watching assets for potential volatility. As for whether PEPE/USDT is poised for a 3x rally, current technical data indicate that the asset is consolidating, not on the verge of an immediate breakout.
A 3x rally from the current price of 0.000004382 would require the price to reach around 0.000013146. Although historical price action on the weekly chart shows levels above this mark, reaching this target would require significant structural change
EGY
EGYEgypt
Gate.Fun
MC:$3.61KHolders:1
0.16%
KatyPaty
#Gate广场万圣节
PEPE/USDT Pre-Halloween Analysis: Assessing the 3x Potential
As the Halloween period approaches, market participants are monitoring assets for potential volatility. Regarding the question of whether PEPE/USDT is preparing for a 3x increase, current technical data indicates that the asset is in a consolidation phase rather than an immediate breakout.
A 3x increase from the current price of 0.000004382 would require the price to reach approximately 0.000013146. While the weekly chart shows historical price action above this level, achieving this target requires significant structural changes. Here is the objective technical breakdown.
1-Week Chart Analysis
The weekly timeframe shows the price trading at 0.000004382. This is above the middle Bollinger Band at 0.000003380 but below the upper band at 0.000004726. The MACD indicator is in positive territory with the DIF at 0.000000079 and the DEA at -0.000000127. This indicates that the long term recovery trend remains intact. However, the On-Balance Volume is trending downward.
1-Day Chart Analysis
On the daily chart, the price is positioned between the middle Bollinger Band at 0.000004186 and the upper band at 0.000004666. The MACD is positive, with the DIF at 0.000000106 above the DEA at 0.000000075. The data shows short term stability within the current range.
4-Hour Chart Analysis
The 4-hour timeframe displays recent downward pressure. The price is currently below the middle Bollinger Band at 0.000004511 and is testing the lower band at 0.000004151. The MACD is negative, with the DIF at -0.00000005 below the DEA at 0.000000026. The MACD histogram is slightly negative, and the On-Balance Volume is trending down, confirming recent selling activity.
The Path to a 3x Increase
The data does not show an immediate setup for a 3x increase. The asset is currently consolidating. To achieve a 3x target, the price must first break through multiple resistance levels.
The immediate resistance is the 4-hour middle band at 0.000004511 and the daily upper band at 0.000004666.
A confirmed breakout above the recent high of 0.000005361 is necessary to establish a new upward structure.
Reaching 0.000013146 requires a sustained increase in trading volume and continuous higher highs across all timeframes.
During the Halloween holiday, market dynamics can change rapidly. Monitoring volume and resistance levels objectively is required to evaluate if the asset can transition from consolidation to a confirmed upward trend.
#GateSquareHalloween $PEPE ‌

repost-content-media
PEPE-4.23%
  • 3
This divergence across commodities is the real signal: financial demand is fading, while physical scarcity is growing. Copper and oil are moving in different directions, so don’t apply the same logic to every commodity. When trading, keep your hands steady—if you can’t see the picture clearly, don’t take a big position. Can your current position withstand this kind of divide? Tell us in the comments how you’re handling it.
post-image
XCU+0.29%
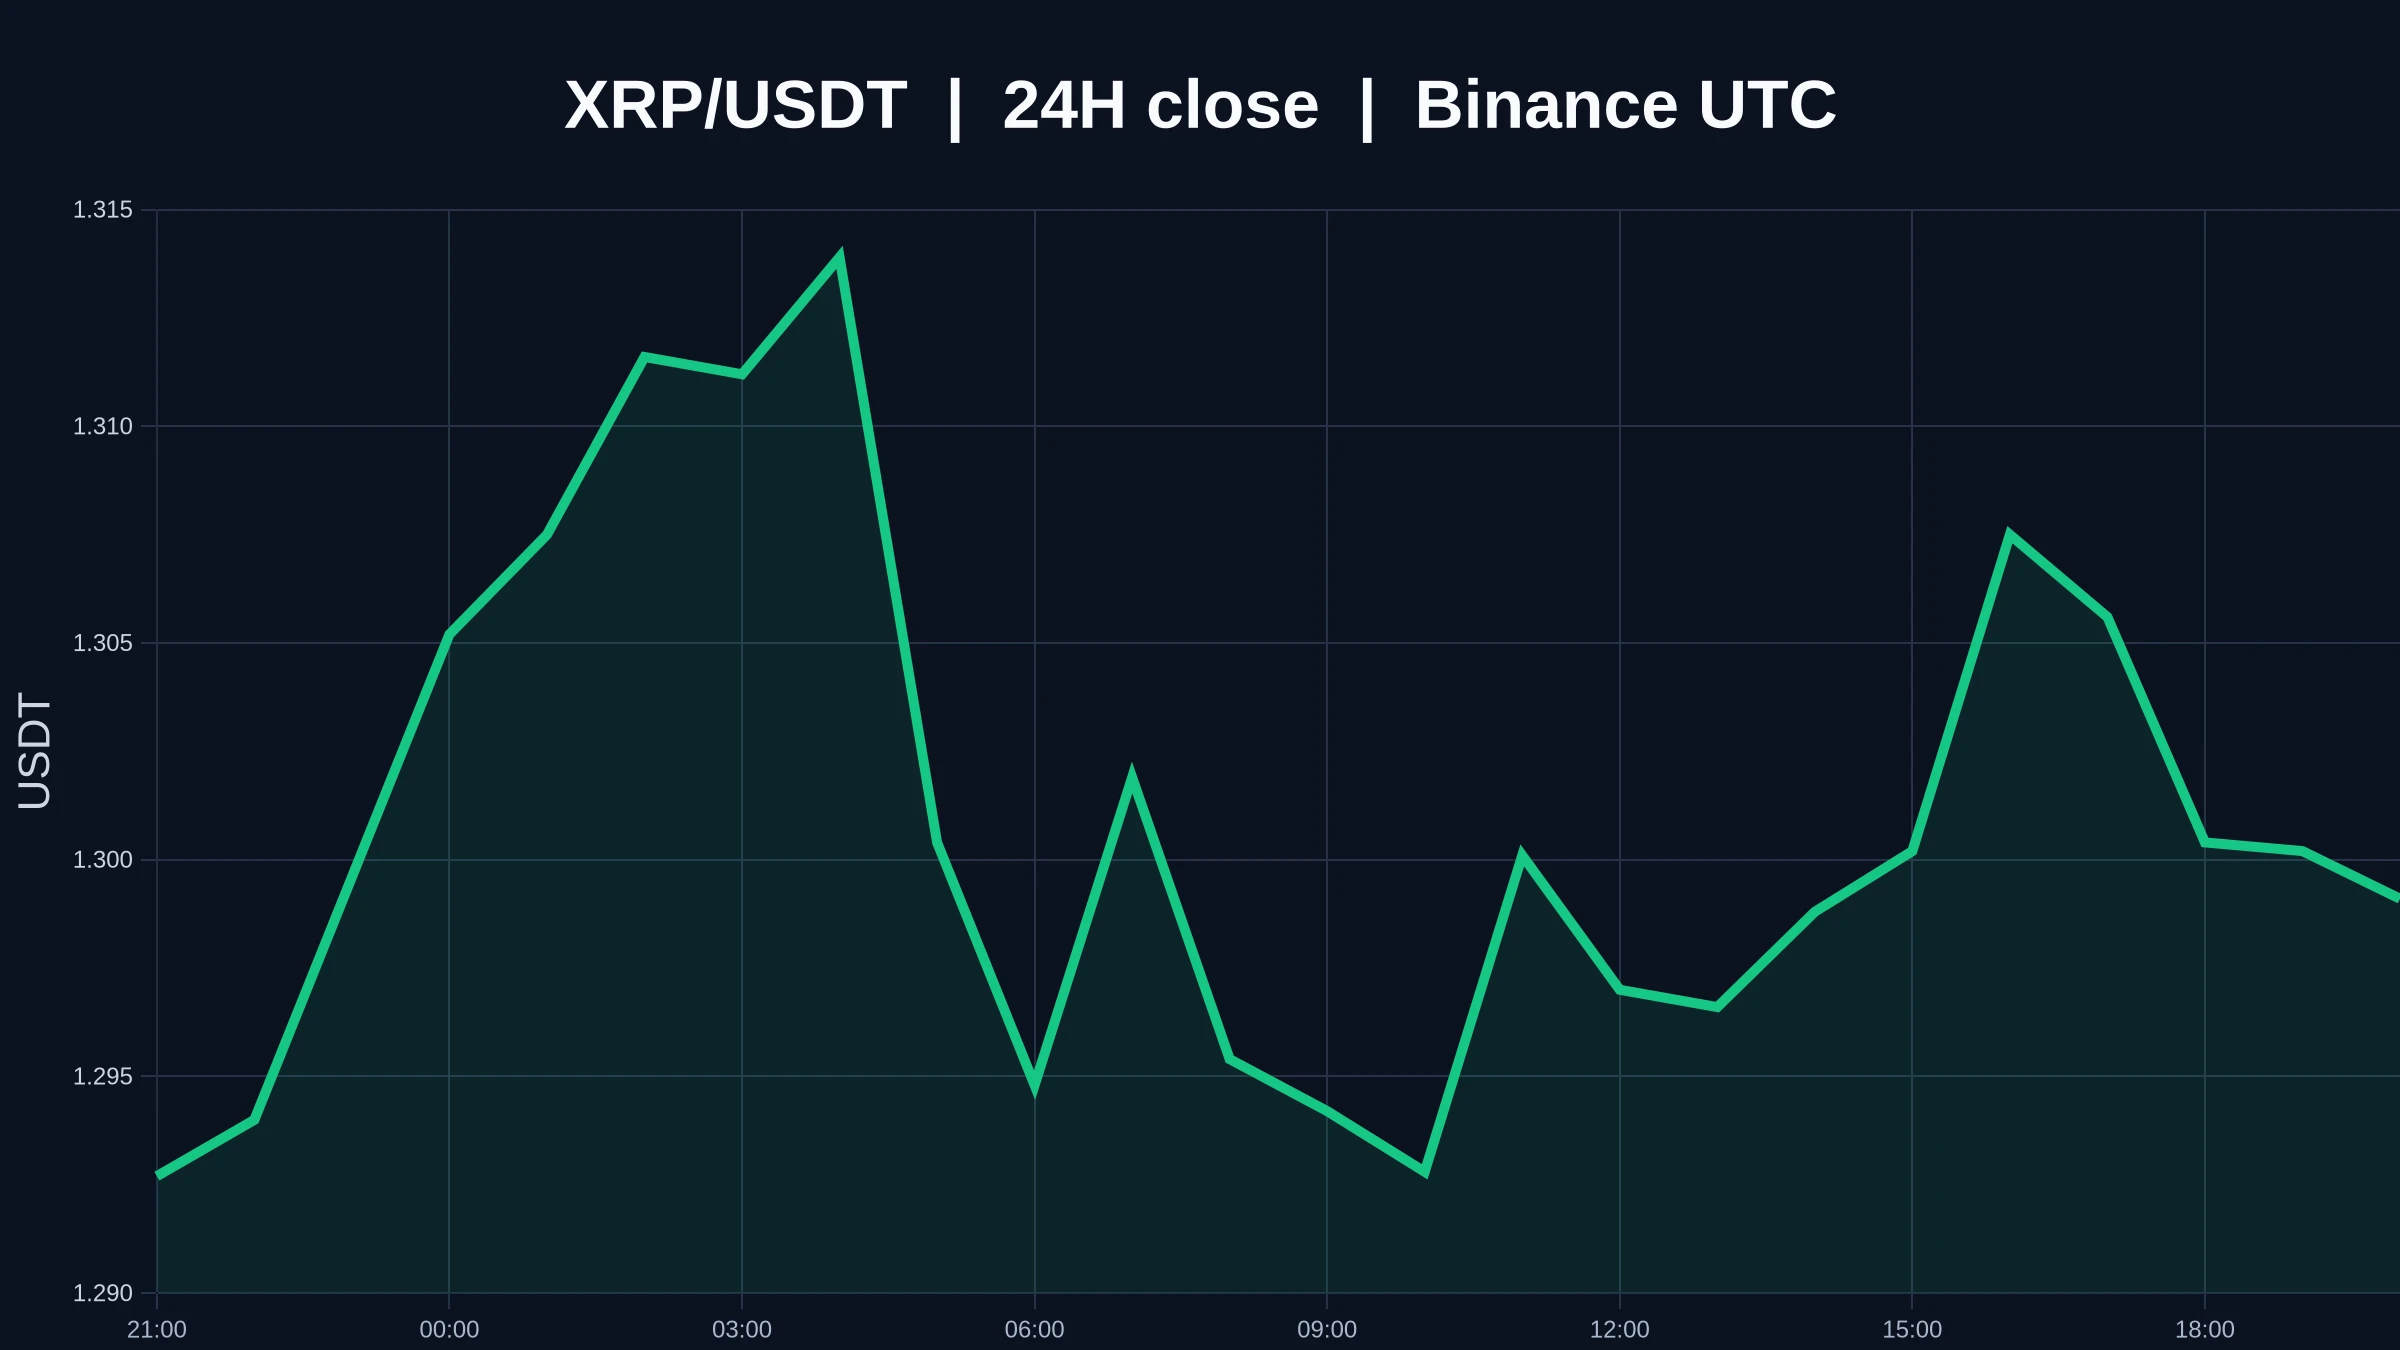
sol parked at $101.5, bnb quietly +1% at $740, xrp $1.30. the whole board is flat and my cat still looks more shocked than the chart. probably nothing
post-image
SOL+0.04%
BNB+0.81%
XRP+0.17%
Revolut, the fintech app with more than 70 million customers, is now an on-ramp on Jupiter Mobile.
Users pick Revolut Pay and move money from their Revolut account straight into a Solana wallet in seconds.
@JupiterExchange
JUP-1.65%
SOL+0.04%
What matters this time for $XRP isn’t simply whether it “goes up” or “goes down,” but which of the two nearby boundaries is actually dealt with first after the price reached 1.3003. Rather than picking a side, check for alignment across timeframes first. The 1-hour chart reflects short-term flows, while the 4-hour chart reflects the broader structure. When the two timeframes point in opposite directions, it only means the market is choosing a direction; a short-term shift cannot be treated as a trend reversal.
The price is still looking for answers between 1.2891 and 1.3159. Only after it trul
post-image
XRP+0.17%
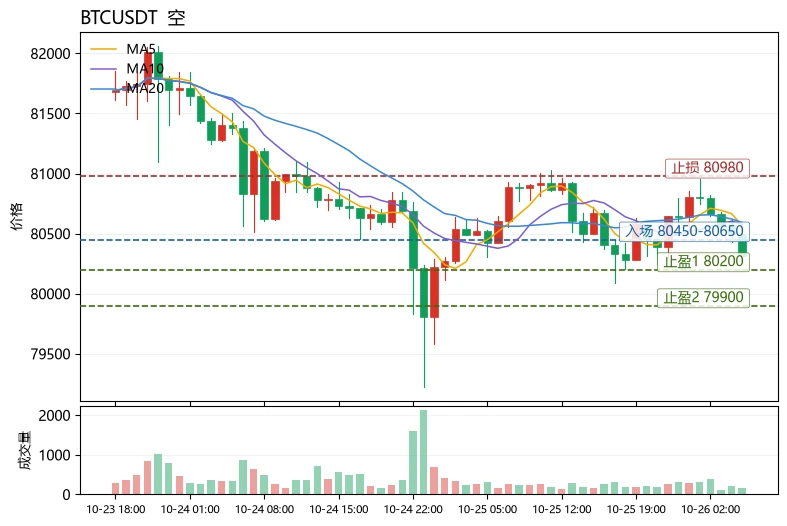
$BTC Short-term bias is bearish; favor shorting bounces. The core rationale is funding: BTC’s funding rate remains positive at +0.0033%, meaning longs are paying to hold positions, while the price has barely moved over 24h (-0.05%). This shows longs are crowded but unable to push the price higher, a typical “longs pay, shorts collect rent” setup. Any pullback could easily trigger a cascade of long stop-losses and liquidations. Technicals point the same way: MA5=80568 has fallen below MA20=80592.5, RSI=41.3 is in the weak zone, and the MACD histogram at -3.343 remains bearish. The price is nea
post-image
BTC-0.10%
AVAX+0.33%
AAVE+0.20%
Cricket season is officially in the books, which means it’s time to shift gears and completely lock in.
I had to step away from Amazon because they required a weekend shift. Since cricket matches only happen on weekends here, I picked up an overnight job so I could play out the season without missing a beat.
Now that the season is over, I’m not dropping that overnight job. I’m keeping it AND jumping back into Amazon.
That means I’ll be grinding anywhere from 80 to 100+ hours every single week moving forward.
If you see me a little less active during the day, now you know why. It’s pure executi
post-image
The Crypto market is looking very healthy here.
It's very important to be objective and understand the data.
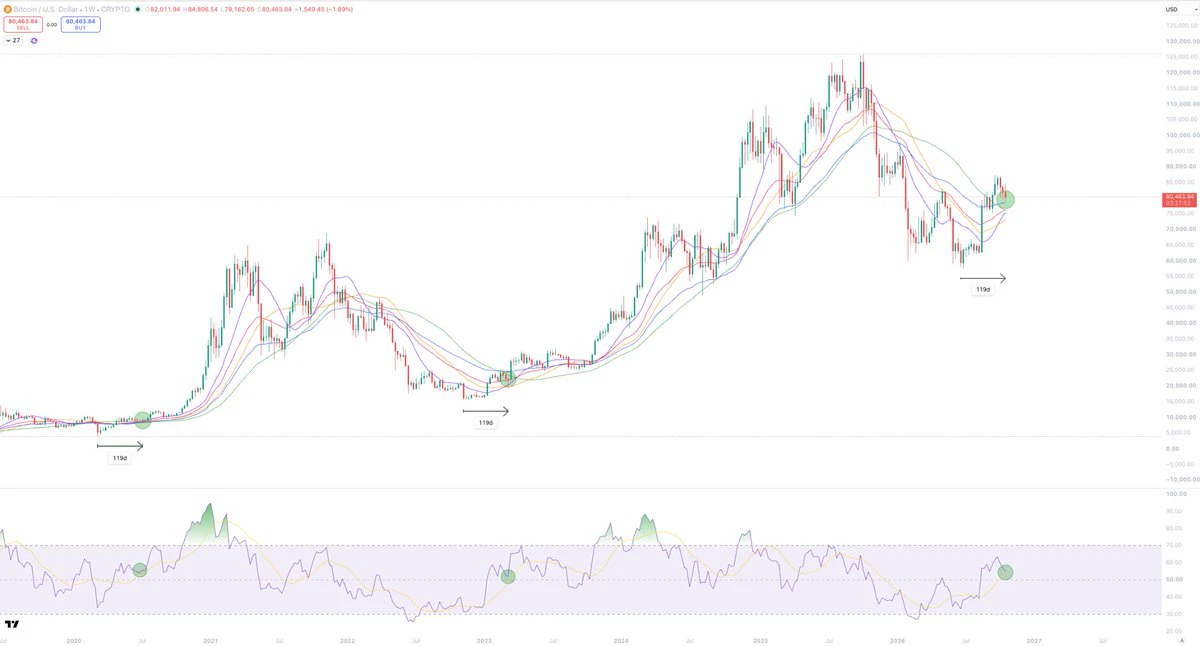
As we approach the weekly close, we are tracking very similarly to the previous two early bull market moves.
The setup is almost identical to both 2020 and 2023. But looks even more like 2020.
We are now 119 days from the bottom, and about to test the 1W RSI trend level(yellow line), whilst sitting above all key SMA+EMA levels that were reclaimed from the bears.
Bitcoin was in this exact position in both previous bottom moves higher. 119 days, close to retesting the RSI trend.
Both time
post-image
BTC-0.10%
  • 1
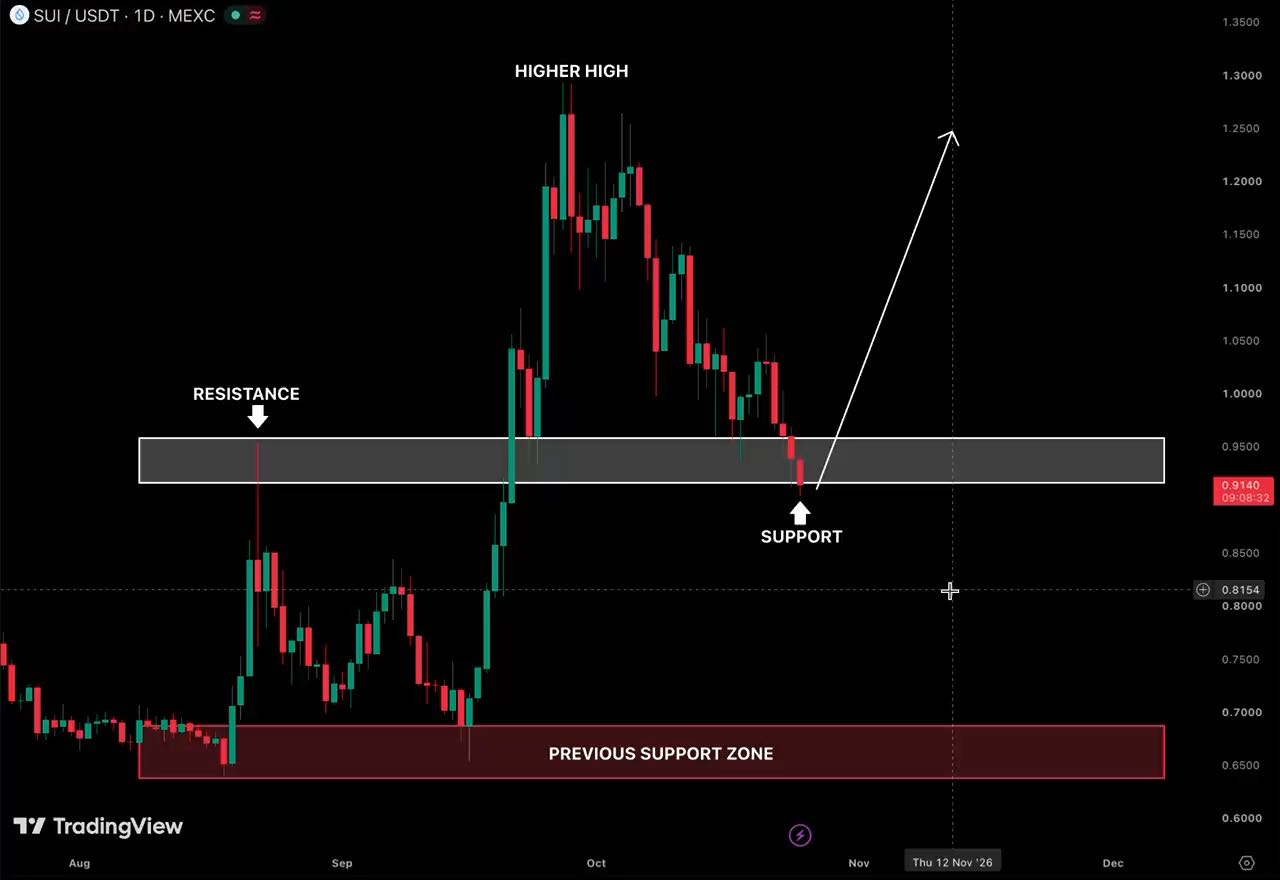
$SUI is testing the breakout zone again
This was resistance before, and now bulls need to prove it can hold as support
If it does, a bounce toward $1.10 and potentially $1.25 wouldn’t surprise me
Let’s see if buyers actually show up or if this level was just temporary support
SUI-1.32%
This morning, everyone will see 22**'s $ETH
post-image
ETH-0.10%
Load More

Join 40 M users in our growing community

⚡️ Join 40 M users in the crypto craze discussion

💬 Engage with your favorite top creators

👍 See what interests you

Trending Topics

USEarningsSeason

106.27k Views3.54k Discussing

The U.S. Q3 earnings season is in full swing, with major tech companies including Tesla and Meta reporting results. Market focus is shifting beyond revenue and profit toward AI spending, capital expenditure, margins and forward guidance. Which company’s earnings are you watching most closely?

GateWCTCS9GlobalTradingCompetition

742.79k Views8.12k Discussing

USConsumerSentimentNearRecordLow

13.43k Views308 Discussing

View More