Share your thoughts
placeholder
Article
#交易机器人 I'm using the ETHUSDT futures grid bot on Gate—join me in copy trading!
post-image
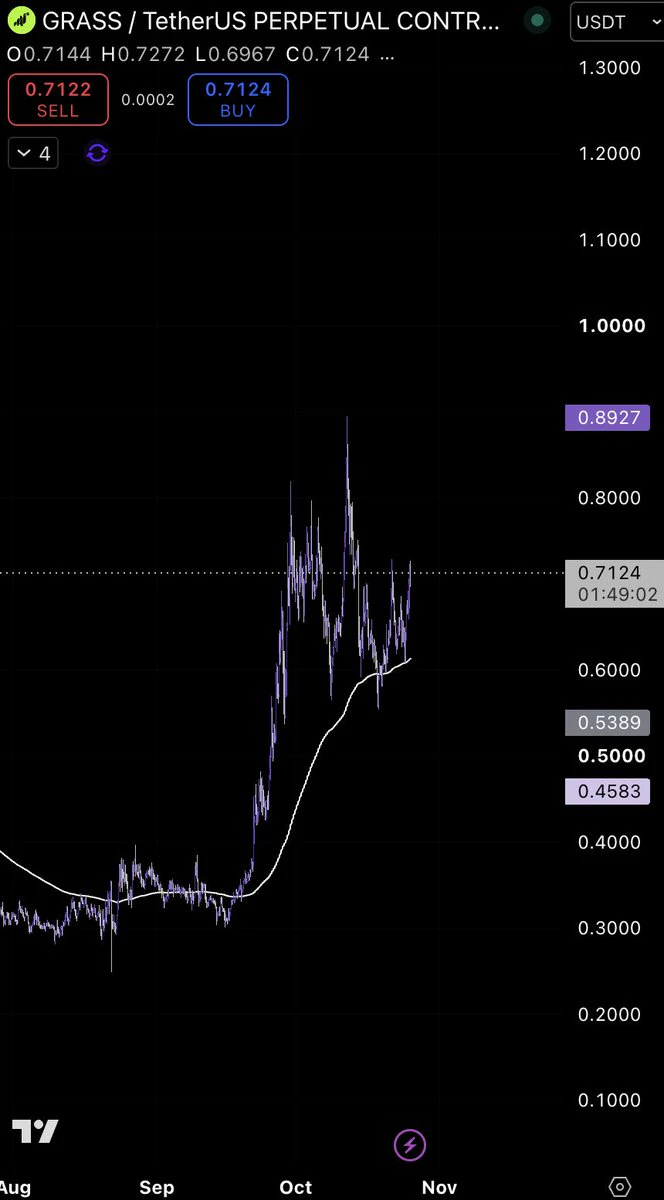
I only wanted to freeload a breakfast, but the market ended up wrapping me in dumplings for half a year. When I opened the chart this morning, before the market had fully started moving, I saw buying pressure firmly supporting the lows.
The bottoming process failed to make a new low, and funds were still quietly entering, so I knew this opportunity wouldn’t get away. I went long directly at the time, entering at 0.6959.
It’s 0.77 now, with a return of +211.23%; isn’t it fair to say I delivered the answer? The brothers on board should all be waking up laughing.
The market is waited out, and pro
post-image
DOGE-0.11%
LAB-2.52%
The curse of good Robinhood filters
post-image
hot Topics updates
live-cover
LIVE52
Don’t Let Your USDT Sit Idle! Gate Idle Money Makes Waiting Worthwhile
There’s a very practical rule in the trading market: opportunities don’t appear every day.
Sometimes BTC moves sideways, sometimes altcoins are too volatile, and sometimes macroeconomic data is about to be released. Often, the best move is simply to wait.
But waiting doesn’t mean your funds have to remain completely idle.
Gate Idle Money currently supports automatic yield generation for eligible stablecoins such as USDT and USDC. Once enabled, there’s no need to subscribe repeatedly or lock up your funds. The system calcula
USDC+0.01%
  • 43
Insiders are watching $DOT /USDT break below 0.932 and nobody is talking about it.

$DOT /USDT - SHORT

Trade Plan:
Entry: 1.062 – 1.074
SL: 1.145
TP1: 1.010
TP2: 0.972
TP3: 0.914

Why this setup?
Why now? The 1h price sits at 1.067 inside a narrow range, and the 15m RSI reading of 52.3 shows neither overbought nor oversold complacency, which makes the 1h ATR of 0.02461 a precise ruler for measuring the next leg down. The entry zone between 1.062 and 1.074 gives a defined risk setup, while TP1 at 1.010 and TP2 at 0.972 map the projected slide if the daily range continues to exhaust itself.
DOT+8.10%
I did nothing—just went to the restroom, and when I came back, the candlestick chart had already done the work for me😳

During the repeated intraday swings, $ARB kept retesting 0.10885 without breaking below it, while volume failed to pick up. I judged that funds were accumulating at this level, so I directly opened a long position.

When I came back, the price had shot straight up to 0.17025, giving me +3232.92% in unrealized profit. This move gave us the answer, brothers🔥

First take profit on 80% and put the bulk of it in my pocket; move the stop loss on the remaining 20% to around the
post-image
ARB-11.10%
SOL-2.57%
BTC-1.40%
BTC, Gold, and Crude Oil Analysis
live-cover
LIVE50
I was just thinking about heading up front to complain about the broader market, but then I looked down at the unrealized PnL on my short position—never mind, the market is always right. That rebound candlestick a few days ago before bed looked pretty intimidating, but I was watching the key levels above; the volume simply didn’t follow through—a classic low-volume bull trap. While everyone else was rushing out, I stayed calm and directly placed a short order, entering at 266.18. I just refreshed the chart, and it has already moved to 255.66, with unrealized gains of +77.81%. I timed this move
post-image
SNDK+0.04%
ETH-1.06%
I didn’t do anything—just went to the restroom, and when I came back, the K-line had already done the work for me. I opened the chart in the morning: $ETH was bottoming out without breaking down, while volume was starting to recover. I saw that the incoming capital looked substantial, so I went long. When I came back, it had moved from 2473.40 to 2485.34, +82.61%. Feels great, brothers. This bite of profit was satisfying—those on board should have woken up laughing. In terms of execution: put the bulk into your pocket first, take 80% off the table, and move the stop-loss on the remaining 20% c
post-image
ETH-1.06%
LAB-2.52%
SOL-2.57%
This was purely the market being in a good mood, casually tossing out some gold coins that happened to land right on my head.
I had just finished lunch and was checking the charts. The market was still dragging its feet, but I noticed funds quietly entering. Volume was expanding moderately while the price was still languishing at the lows—this setup felt like it was about to make a move.
Then it took off directly: $ENA climbed from 0.09610 all the way to 0.16474, with returns reaching +3439.18%. It was truly sluggish at first, but the result was truly sweet.
I took profit on 80% and left 20% o
post-image
ENA-6.85%
ETH-1.06%
ADA-1.39%
ethereum:native
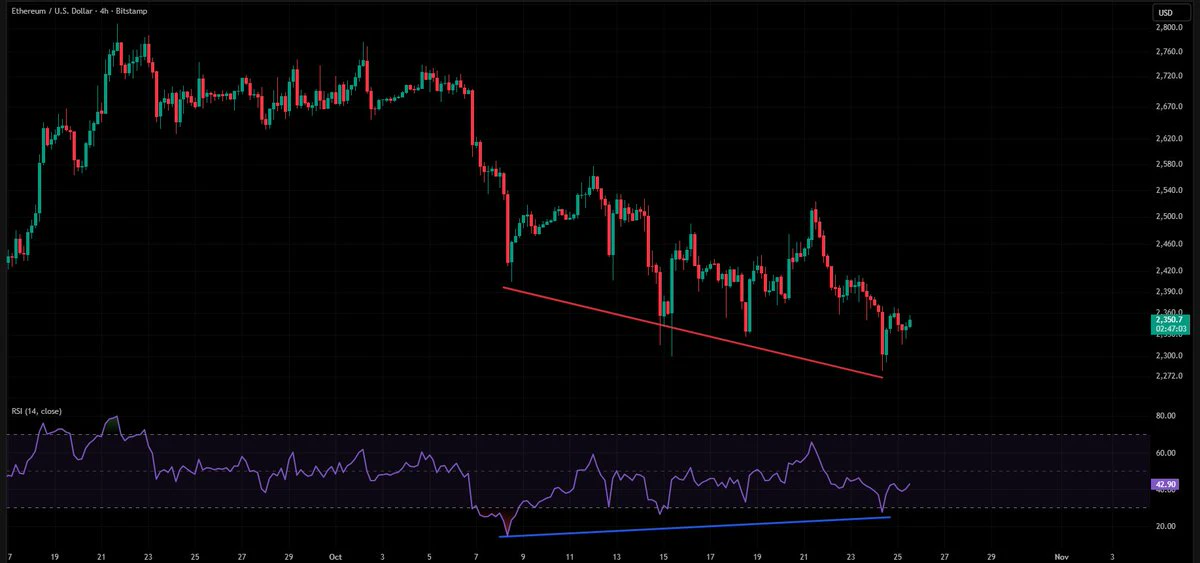
Higher low or one thousand US dollars
post-image
ETH-1.07%
Why is everyone suddenly shorting $CL /USDT right under the 1h range?

$CL /USDT - SHORT

Trade Plan:
Entry: 92.26 – 92.46
SL: 93.32
TP1: 91.64
TP2: 91.16
TP3: 90.44

Why this setup?


Debate:
Are we hitting TP2 at 91.16 or getting trapped before the invalidation at 90.32?

⚠️ Personal market analysis only. NFA — manage risk and DYOR.
Educational content, not investment advice or a recommendation to buy, sell, deposit, or withdraw any asset. No paid promotion or referral/affiliate links.
CL+0.45%
This little bit of red has me panicking—I keep feeling like it’ll come to its senses tomorrow and kick me out. 😅

When I opened the chart this morning, $BR was still hovering around 0.21096, with buying quietly strengthening and volume returning. After moving sideways at the bottom for so long, there was only one conclusion: it was building momentum, not crashing, so I went long directly without hesitation. ⚡

I just refreshed the page, and the current price is 0.27187, with gains of +568.92%. Unrealized gains are only paper profits, so take profit when it’s time to go.

I’ve also finishe
post-image
BR+16.64%
ADA-1.39%
LAB-2.52%
Nobody is talking about the quiet setup forming in SYMBOL right now.

$LTC /USDT - SHORT

Trade Plan:
Entry: 55.51 – 55.93
SL: 57.74
TP1: 54.20
TP2: 53.19
TP3: 51.67

Why this setup?
Why now? The 1h price is holding at 55.72 inside a tight range while the 15m RSI sits at 52, meaning momentum is neutral and a sudden slide is entirely possible. The 1h ATR of 0.84345 shows average hourly volatility, so any break below the entry zone of 55.51 to 55.93 will likely carry through the first target at 54.20 and push toward 53.19 at TP2. The daily trend being range-bound confirms there is no strong f
LTC+0.73%
This trend is so obvious I don’t even need to think—the account is partying on its own. While the screen was glowing green, $BTC was lying still around 77967.8. Others were cutting losses, but I saw a pullback holding firm, with funds stepping in every time it dipped. That signal is clear enough, right?
As expected, when I checked the charts after lunch, it shot straight up to 79196.9 in a single move. The +274.13% profit was safely tucked into my pocket—smooth and satisfying. This move was purely the market being in a good mood, casually scattering some gold coins that happened to land right
post-image
BTC-1.40%
SNDK+0.04%
LAB-2.52%
a-meme-coin:native wow 😮
0x385f4f8ae47651ce5f58f5265395a669f8281e18
post-image
MEME-0.56%
$XAUT /USDT is range bound, but something is about to break it lower.

$XAUT /USDT - SHORT

Trade Plan:
Entry: 4409.9 – 4414.5
SL: 4434.1
TP1: 4395.8
TP2: 4384.8
TP3: 4368.3

Why this setup?
Why now? The daily trend is range, which means the market is coiled and waiting for a directional catalyst. The 1h ATR of 9.135926 shows enough volatility to fuel a sharp move once price decides. The 15m RSI at 68.58 is not overbought enough to trap shorts, suggesting room for further downside. The entry zone sits at 4412.2, with TP1 at 4395.8 and TP2 at 4384.8, offering a clear risk to reward setup for
XAUT-0.26%
$XLM /USDT is silently coiling for a move most traders will miss.

$XLM /USDT - SHORT

Trade Plan:
Entry: 0.19201 – 0.19341
SL: 0.19943
TP1: 0.18767
TP2: 0.18431
TP3: 0.17927

Why this setup?
Why now? The 1h price sits at 0.19277 inside a tight range, the 15m RSI reads 58.72 showing neither overbought nor oversold exhaustion, and the 1h ATR of 0.0028 confirms volatility is compressing before a directional burst. The daily trend is range-bound, which often precedes a sharp breakout, and the entry zone between 0.19201 and 0.19341 offers a precise trigger for a short bias. Targeting TP1 at 0.1
XLM+3.47%
This entry point was not perfect; I tried a long at the area where the price tested the low for a second time on the $UAI hourly chart. The moving averages had not fully turned yet, so I could only use a tight stop-loss in exchange for room for profits later.

After entry, the price action was very sticky. Several rallies were pushed back, making it look as though the trend was weakening. But the key levels during each pullback never broke below the key reference level at entry, so I chose to reduce my trading frequency and let the position run.

Only after the key level above was broken did
post-image
UAI+21.96%
ETH-1.06%
LAB-2.52%
Load More

Join 40 M users in our growing community

⚡️ Join 40 M users in the crypto craze discussion

💬 Engage with your favorite top creators

👍 See what interests you

View More