Square
Following
Hot
News
Profile
Share your thoughts
placeholder
Article
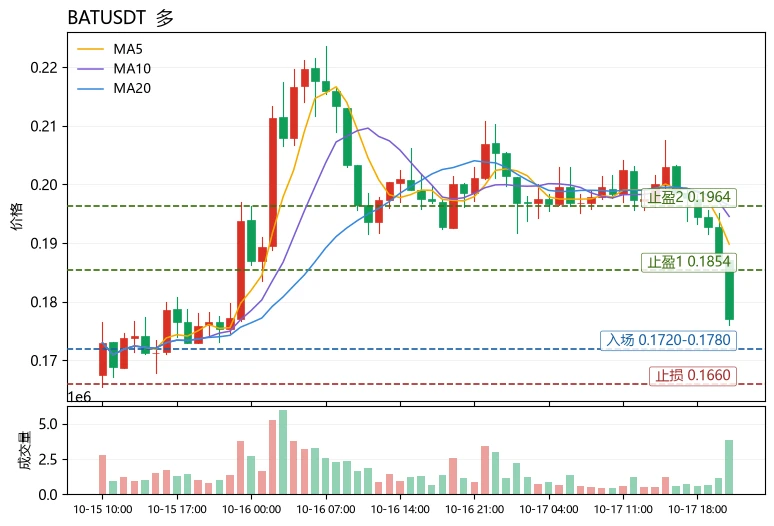
The most unusual detail in today’s market action is not the decline itself, but the divergence between the decline and the leverage structure: $BAT is down 10.37% over 24 hours, the steepest drop of the three, yet the funding rate remains positive at 0.0004%. This suggests longs have not yet conceded and shorts have not completed the squeeze. This combination of “price falling while funding stays positive” often means the downward move still has momentum.
Compared with others in the same sector, $UN is down 3.74% and $OP is down 7.93%. BAT’s decline is about 2.8 times UNI’s, while its 30-ca
post-image
BAT-10.14%
UNI-3.51%
OP-7.67%
#ShareWeekly ‌$SOL Weekly Report: range, position and indicators at $104.27
Solana trades around $104.27 today. It is a week of tight ranges, a defended $100 floor and a major network upgrade on the calendar. Here is the full picture.
Price position: how high and how low
SOL slipped to $100.43 this week, its lowest since mid-September, before buyers defended $100 again. A rebound from $100.62 reached $106.20 on Thursday, and today's session high is $107.44. By my math, price now sits about 3.8% above the week low and about 3% below today's high.
Performance against the market, measured as the
SOL-1.14%
  • 2
Trenches
AGT
A
bade
b
AGT
0x5d...e274
Market Cap
$.
Change
.
24h Vol
$.
Holders
.
CNPY
C
bade
b
CNPY
0xc6...ddd2
Market Cap
$.
Change
.
24h Vol
$.
Holders
.
FOLIO
F
bade
b
FOLIO
0x5f...e411
Market Cap
$.
Change
.
24h Vol
$.
Holders
.
FTR
F
bade
b
FTR
DFMt...pump
Market Cap
$.
Change
.
24h Vol
$.
Holders
.
DOPE
D
bade
b
DOPE
0xf9...8899
Market Cap
$.
Change
.
24h Vol
$.
Holders
.
$BTC has a strong narrative, but the candlestick structure tells me something else: the Senate vote is still pending, funding rates have been positive for three straight days, longs are paying shorts, and auto-compounding yield aggregators can’t offset the costs at this level. I’ll archive my take for now and come back tomorrow to check. If you’re watching, keep an eye on it.
post-image
BTC-0.39%
How am I supposed to explain this to my husband when I get home tonight? My butt is so red.
Longs have been badly shaken out at support; it’s time for a relief bounce after oversold conditions! Open a long position $TI .
Entry: 0.661 - 0.666 Take Profit 1: 0.6980 Take Profit 2: 0.7256 Stop Loss: 0.641 Trade the chart here. Let’s take a look at $SO and $EPIC .
post-image
EPIC+30.06%
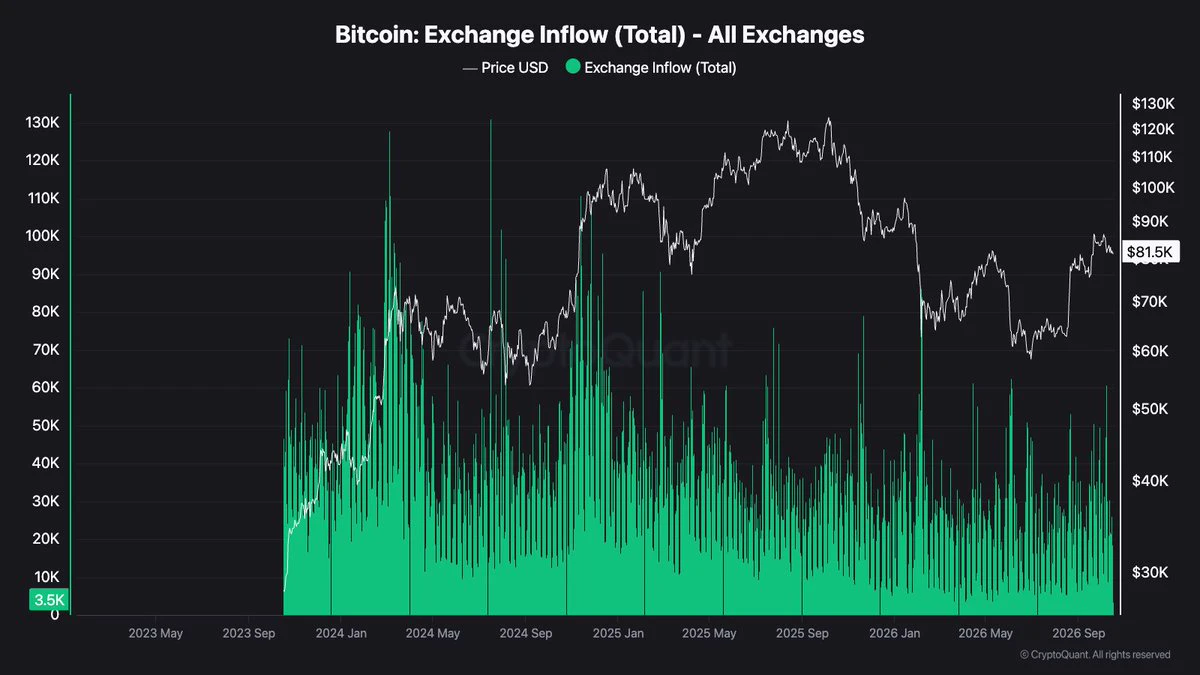
Bitcoin exchange inflows have remained active throughout the cycle, with several major spikes since 2023
Despite BTC trading near $81.5K, inflows continue to fluctuate significantly
Higher exchange inflows can indicate potential selling pressure, but they don't confirm that holders are selling
#Bitcoin #BTC
post-image
BTC-0.49%
#ShareWeekly ‌$ZEC in ten numbers: a different way to read the week at $1,162
Instead of a standard chart review, here are ten numbers that explain where Zcash stands today, what they mean, and what to watch next.
1. $1,162: the price in context
Trackers show ZEC between about $1,144 and $1,176 on October 17, so $1,162 sits in the middle of the live range. Over the past 24 hours the high was $1,239.00 and the low was $1,130.36.
2. #10: its rank by size
ZEC ranks tenth by market cap. Its market cap is about $19.98 billion, which puts a privacy coin in the same top-ten conversation as the bigge
ZEC-4.80%
  • 7
$BTC is standing at the bull-bear dividing line!
Key support is being tested again. If it holds, $90,000 is still within reach! If it breaks, the price could return to the $70,000 range. This weekly battle will determine the direction ahead! The latest BTC weekly chart shows that after a deep correction, Bitcoin has rebounded to a previously important support area and is now testing this key price zone. As the chart shows, this area has attracted buying support several times in the past. Now that the price has returned near it, bulls and bears are battling for control of the medium-term trend
post-image
ZEC-4.80%
$XRP Strongly bullish: If buyers regain control, a rebound from the 1.28 support zone could drive the price back up to 1.35–1.42. Long $XRP Entry: 1.3000–1.3100 Stop-loss: 1.2700 Take-profit 1: 1.3300 Take-profit 2: 1.3500 Take-profit 3: 1.3800 Take-profit 4: 1.4200 Trade here $XRP : 👇
post-image
XRP-2.66%
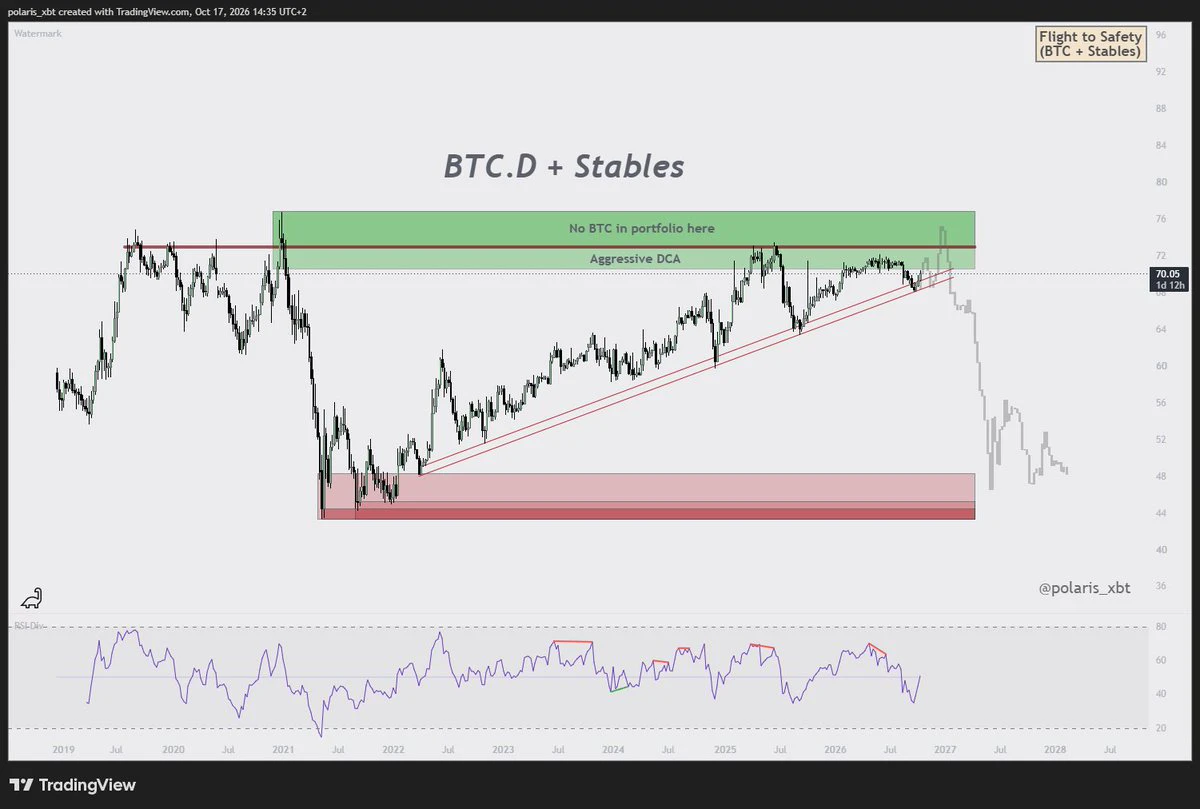
$BTC Dom
This chart has been my main guide
▫️ We touched the trendline in September, and that’s when the top on BTC formed
▫️ I’ve been risk-off ever since, focused only on shorts
▫️ This mode likely continues for several more weeks before we see a bottom
post-image
BTC-0.49%
Jensen Huang: Current market turmoil will pass, AI will bring change
live-cover
LIVE2,716
After the Sharp Drop in Memory Chip Stocks, a Golden Opportunity or a Valuation Trap?
A sudden sharp decline in Japanese and South Korean stocks has put the semiconductor sector under renewed pressure. The Nikkei 225 fell 4.90%, the Korea Composite Stock Price Index (KOSPI) fell 7.56%, and memory chip stocks have also become a market focus. For investors who have long been bullish on the AI supply chain, is this correction a rare buying opportunity or the start of further risk unwinding?
SK hynix and SanDisk have drawn attention because of the memory demand driven by artificial intelligence. A
META-3.68%
🔥TRX has run out of steam! Everyone who chased the highs is now left holding the bag!
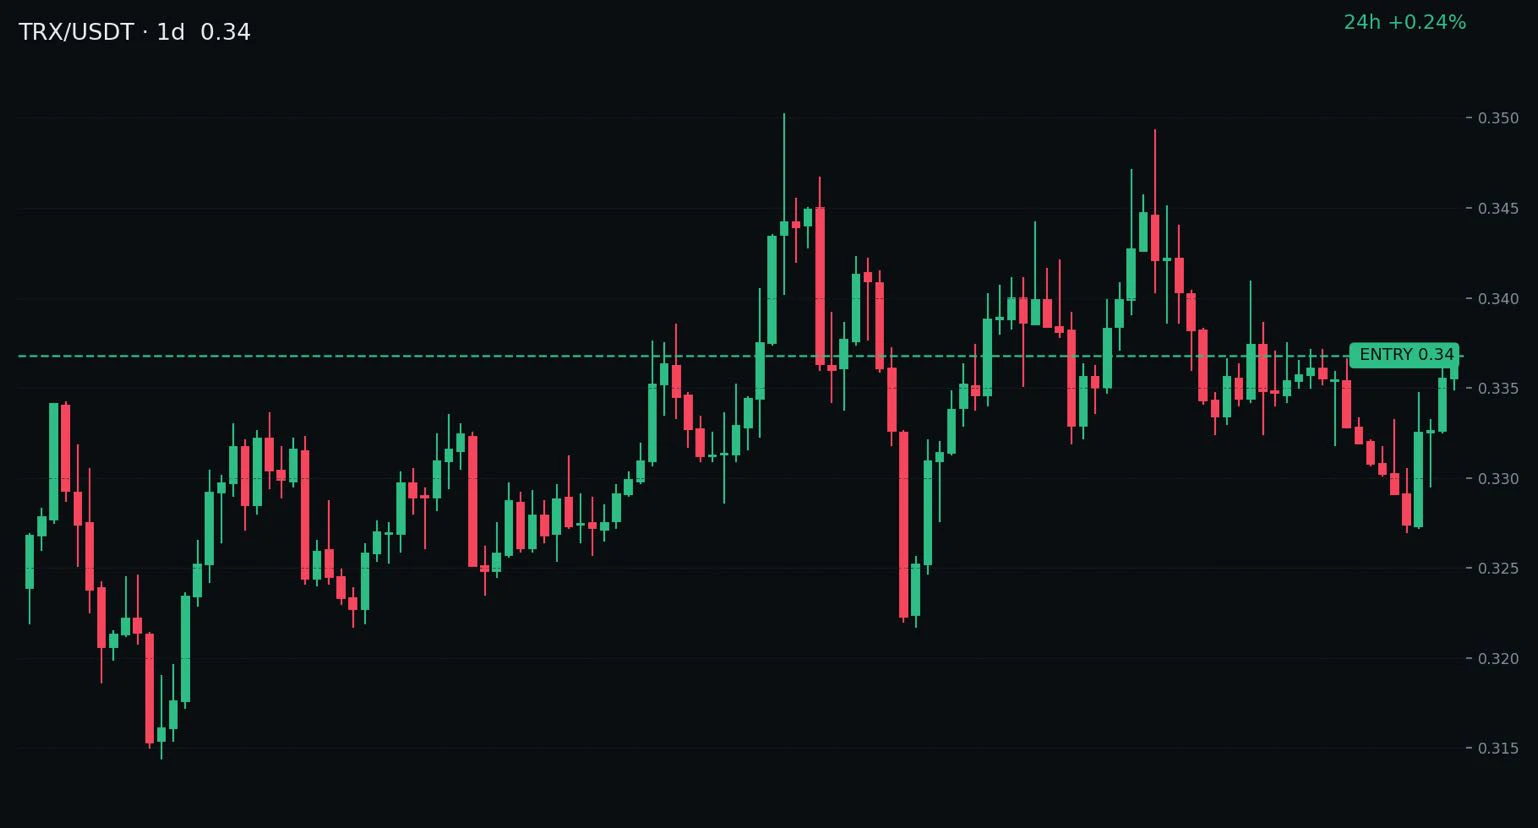
TRX surged to $0.34 today before losing steam, with a 24h change of +0% and steady volume. The bulls have fired their last shot, and everyone getting in now is a potential bagholder. Nine out of ten traders chasing the highs are carrying bags for market makers; the rest are here to pay tuition. Charging in at this level isn’t bravery—it’s having money to burn.
1. Event: TRX failed to break through its 24h high of $0.34 and retreated after the surge, with bullish momentum completely exhausted. Stalling at the
post-image
TRX+0.47%
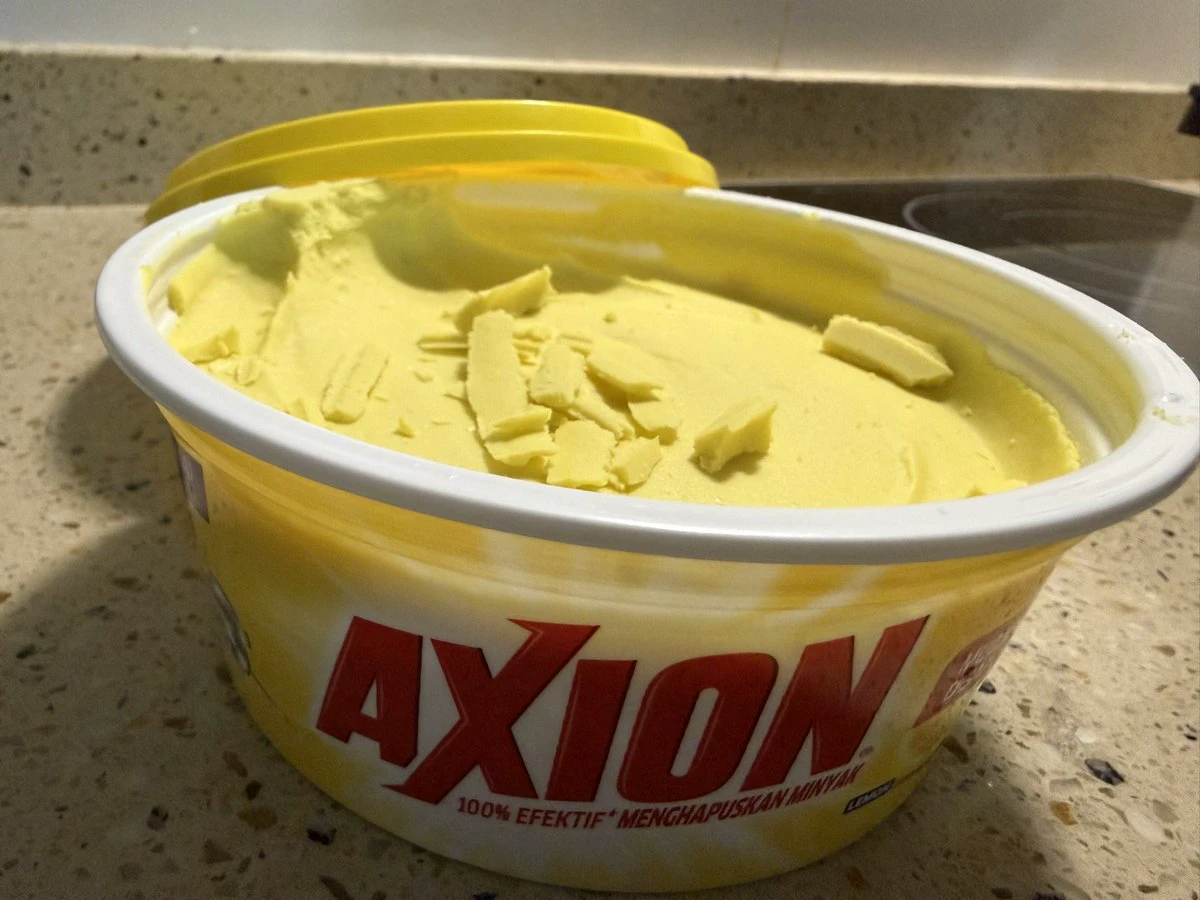
I've used liquid dishwashing detergent for decades
Today I saw this kind of “solid dishwashing detergent” for the first time
It looks like ice cream🍦
The lemon scent🍋 smells quite nice
Have you ever used it?
post-image
#USMemoryStocksExtendLosses
US MEMORY STOCKS UNDER PRESSURE: CHINA'S CHALLENGE, AI VALUATIONS AND WHAT COMES NEXT
The latest sell-off in memory chip stocks is becoming more than a routine market correction. Micron (MU), SanDisk (SNDK), Western Digital (WDC), and South Korea's SK Hynix are facing renewed selling pressure as investors reassess competition, future profitability, and the sustainability of the AI-driven rally. Reports have pointed to approximately $1 trillion in combined market value disappearing from memory-related companies over a relatively short period.
Although individual per
MU-5.66%
SNDK-6.90%
WDC-6.91%
SK Hynix+0.79%
DRAM-3.08%
🤯 THIS IS MASSIVE
Deutsche Bank is preparing to launch crypto custody in a few weeks
Initial service will support Bitcoin and Ethereum, with plans to expand into stablecoins
The bank also plans to offer tokenized deposits and blockchain-based securities
Deutsche Bank holds €1.44 TRILLION in total assets
BTC-0.49%
ETH-1.38%
GOLD $XAU /USDT REJECTING MOVING AVERAGE RESISTANCE ARE BEARS TARGETING $4136.18 NEXT?
Pair: $XAU /USDT
Direction: SHORT
Entry Price: 4172.16
Target Levels (Take Profit)
TP 1: 4158.67 0.32%
TP 2: 4149.67 0.54%
TP 3: 4136.18 0.86%
Stop Loss
SL: 4190.15
Technical Breakdown
Price Action & Structure: XAU ($4172.16) failed to clear resistance at $4190.15, printing a series of lower highs and small upper wicks that confirm sell-side distribution. The current candle compression indicates fading buying pressure and paves the way for bears to test recent structural floor levels.
Moving Averages & C
XAU+0.04%
I’ve been using Qulian VPN for quite some time; global affiliate commissions are as high as 50%.
Stable enough for personal use, with prompt affiliate payouts.
Affiliate application center:
Website address:
post-image
Load More

Join 40 M users in our growing community

⚡️ Join 40 M users in the crypto craze discussion

💬 Engage with your favorite top creators

👍 See what interests you

Trending Topics

USSeptemberPPIBeatsExpectations

91.35k Views1.92k Discussing

US September PPI came in at 6.3% YoY, well above the 5.3% market expectation, pointing to renewed producer-side inflation pressure. Weekly jobless claims were 199K, broadly in line with forecasts. Could hotter inflation further reduce room for rate cuts, and what does it mean for $BTC, US stocks, and gold?

GateWCTCS9GlobalTradingCompetition

37.87k Views6.64k Discussing

GateBTCAndETHFuturesVolumeRanksTop3

53.8k Views1.78k Discussing

View More