Share your thoughts
placeholder
Article
Everyone is sleeping on a bullish daily trend for SYMBOL right now.

$NEAR /USDT - LONG

Trade Plan:
Entry: 2.2951 – 2.3215
SL: 2.1819
TP1: 2.4031
TP2: 2.4663
TP3: 2.5611

Why this setup?
Why now? The 1h price sits at 2.3083, perfectly aligning with the entry_ref inside the 2.2951 to 2.3215 zone, confirming a precise long trigger. The 15m RSI at 43.76 shows room to run before overbought, while the 1h ATR of 0.052662 suggests this move has real momentum behind it, not just a random bounce. The daily trend is bullish, and the structured targets sit at 2.4031 and 2.4663, with the line in the s
NEAR-4.46%
Why is SYMBOL about to break lower when everyone expects a bounce?

$SLX /USDT - SHORT

Trade Plan:
Entry: 0.06923 – 0.06963
SL: 0.07139
TP1: 0.06796
TP2: 0.06698
TP3: 0.06551

Why this setup?
Why now? The daily trend is range-bound, which often precedes a sharp directional move once momentum decides. The 1h ATR sits at 0.000816, meaning the average candle range is tight enough for a clean breakdown to deliver a high-ratio entry. The 15m RSI reads 42.92, confirming sellers are in control but not yet exhausted. The entry zone is 0.06923 to 0.06963, targeting the 1h price of 0.06943 as a prec
SLX+0.40%
$PONS breaks all the previous records as daily trading volume reaches ATH at $919M 🔥
Welcome Robinhood Chain 🚀 🚀 @RobinhoodCrypto
post-image
PONS-12.78%
$XRP BATTLES AT THE $1.43 MAKE-OR-BREAK RESISTANCE PIVOT! ⚡ 🐂
Entry: 1.41 - 1.43 ⚡
$XRP is attempting a high-risk recovery, pushing aggressively into the key $1.41–$1.43 zone. 🔍 Sellers are fiercely defending this upper level, making it a critical dividing line for short-term momentum.
A sharp rejection here opens the door to a rapid drop toward the $1.39 and $1.38 liquidity levels. 📊 However, if buyers (bulls) break through $1.43 and secure a higher-timeframe close, the structural expansion opens the path to the next upside phase.
💡 Order flow is tightly concentrated around this pivot, s
post-image
XRP-0.51%
No vision, couldn’t hold on—the profits on this move were paper-thin, but I loved every bit of it. Honestly, sometimes making money isn’t about having conviction; it’s about the market feeding you, and luckily, I caught this meal.

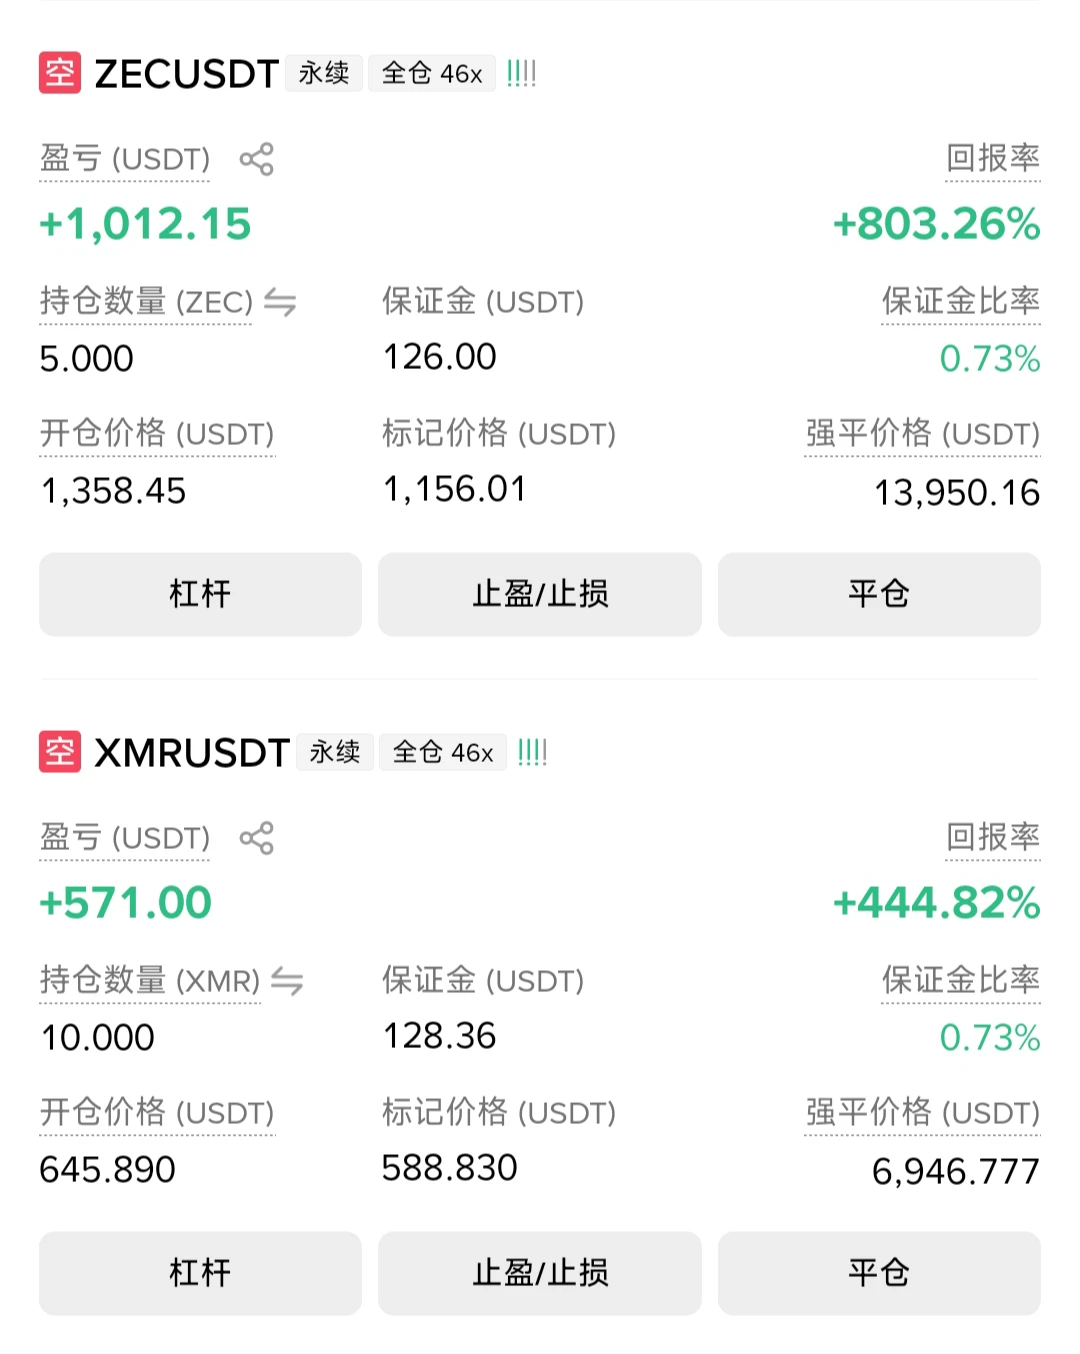
$ZEC A few days ago in the afternoon, the market was still bottoming out. Many people were losing patience, but I kept my eye on 857.01. It was bottoming without breaking down, with the bottom repeatedly confirmed—what does that mean? Someone was supporting it below. So I gave the signal to open a long and told everyone to follow and lie in wait.

Looking at it to
post-image
ZEC-4.37%
DOGE+1.16%
SNDK+0.32%
With this trend, I don't even need to think—the account is dancing on its own.
A few days ago, before bed, I already felt that $SKHYNIX was acting strange. The rebound was weak, but the pullback was also shallow—a classic case of both bulls and bears waiting for direction. When it kept oscillating intraday, I said that when a range is compressed to the extreme, either nothing happens, or once it breaks, there will be a major move. I entered directly at 1235.91 and waited for the wind.
When I looked this morning, wow—it shot straight up to 1338.97, +592.1%. Those who were already in the trade s
post-image
SKHYNIX+3.83%
SNDK+0.32%
BNB-0.95%
Understanding Bitcoin Momentum on 5M & 15M Charts
live-cover
LIVE39
Just watch how everyone is rushing to fomo now just to become exit liquidity
You will learn 😂
post-image
Insiders are quietly stacking shorts on $XAU /USDT while the 1h price holds a suspiciously flat range.

$XAU /USDT - SHORT

Trade Plan:
Entry: 4411.58 – 4417.00
SL: 4440.26
TP1: 4394.81
TP2: 4381.82
TP3: 4362.35

Why this setup?


Debate:
Are we about to sweep 4456 and trap the shorts, or is this range about to explode downward?

⚠️ Personal market analysis only. NFA — manage risk and DYOR.
Educational content, not investment advice or a recommendation to buy, sell, deposit, or withdraw any asset. No paid promotion or referral/affiliate links.
XAU-0.29%
hot Topics updates
live-cover
LIVE24
$ZEC /USDT is sitting on a bullish daily trend but nobody is talking about the 15m RSI reading of 47.46.

$ZEC /USDT - LONG

Trade Plan:
Entry: 1162.81 – 1175.23
SL: 1109.45
TP1: 1213.70
TP2: 1243.48
TP3: 1288.16

Why this setup?
Why now? The 4h structure confirms a LONG bias with 95% confidence while the 1h price sits at 1169.02 inside the entry zone between 1162.81 and 1175.23. The 1h ATR of 24.820874 shows enough volatility to reach TP1 at 1213.70 and then extend to TP2 at 1243.48 without a wick rejection. The daily trend is bullish, which means the 15m RSI at 47.46 is not oversold but b
ZEC-4.37%
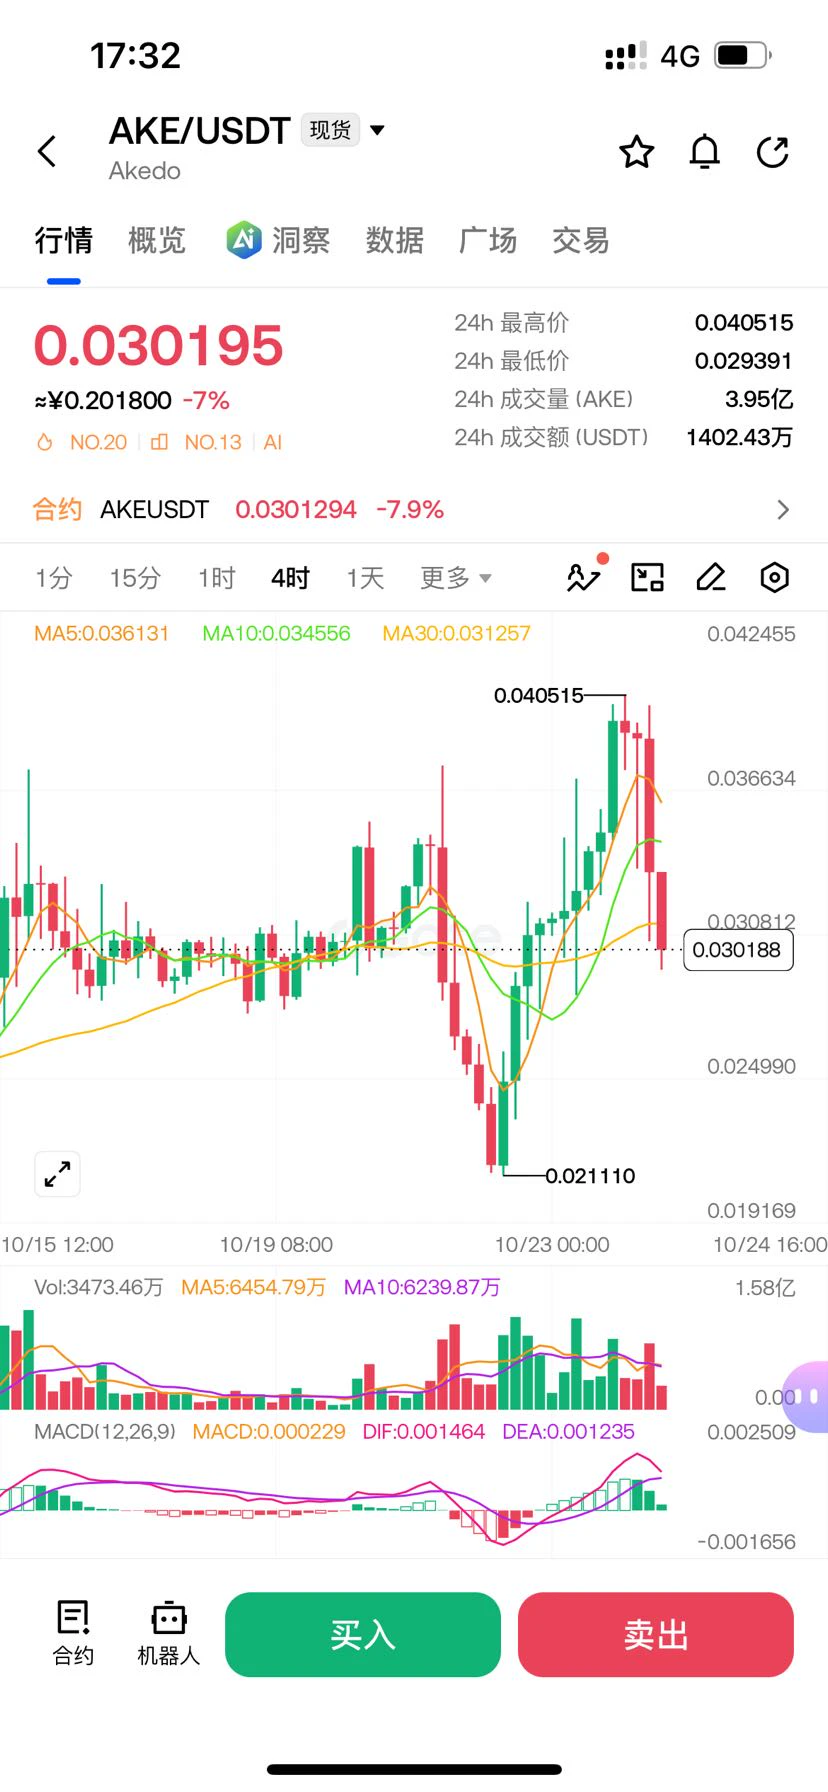
$AKE broke above its previous high but did not accelerate immediately, instead quickly pulling back. I treated the breakout level as a key reference level and entered long when the pullback held above it. This was a standard breakout-and-retest confirmation; as long as this level holds, the logic remains unchanged.

After entry, the price did not continue pulling back and instead rallied directly. During the first surge, I took profit on 70% as planned, while gradually moving the stop-loss higher on the remaining 30% to let the profits run.

The biggest taboo during this process is frequentl
post-image
AKE+9.46%
SNDK+0.32%
ZEC-4.37%
$XLM /USDT is range-bound, but the 1h setup hints at a short squeeze nobody is talking about.

$XLM /USDT - SHORT

Trade Plan:
Entry: 0.19221 – 0.19365
SL: 0.19983
TP1: 0.18775
TP2: 0.18430
TP3: 0.17913

Why this setup?
Why now? The daily trend is range, yet the 1h ATR of 0.002876 shows volatility is compressing, which often precedes a directional burst. The 15m RSI at 58.47 is neither overbought nor oversold, meaning the next impulse can run hard without a warning divergence. The entry zone at 0.19293 aligns perfectly with the 1h price, giving a clean trigger for a short bias. TP1 at 0.187
post-image
XLM+5.28%
🚨 JUST IN: OpenAI chief scientist Jakub Pachocki calls for “extreme caution” as AI capabilities rapidly advance.
No big-picture thinking, can't hold; the profits this round are paper-thin, but I love it to death. Just after lunch, when checking the chart, $HEMI climbed back near 0.008967, with resistance sitting up there. Every push upward fell just short. One look at the trend and I knew it wouldn't break higher, so I shorted right away and waited for the pullback. 🍲

Now at 0.008731, +52.69%—this round wasn't for nothing. Everyone on board should be waking up with a smile. It feels really good. Time for a proper meal. With a trend like this, I don't even need to think—the account is out there dancin
post-image
HEMI-24.79%
ZEC-4.37%
BTC-0.55%
🌈 Official support starts today | Gate’s Dajin Dog is now live!
Include #Gate上线打金狗限时免Gas费 when sharing content on Gate Square to win rewards + traffic support!
🏆 Quality Content Award
10 outstanding creators will be selected, with each receiving:
🎁 100 USDT position trial voucher + 7 days of Gate Square traffic support
Traffic support can be combined with other campaigns.
🍀 Lucky Trade-Sharing Award
Complete a trade through Dajin Dog, share a screenshot of your trade or holdings on Square, and 3 winners will be drawn to receive 5 USDT each!
📌 You can post:
🔹 Dajin Dog product experience
post-image
hyperliquid:native 🎯
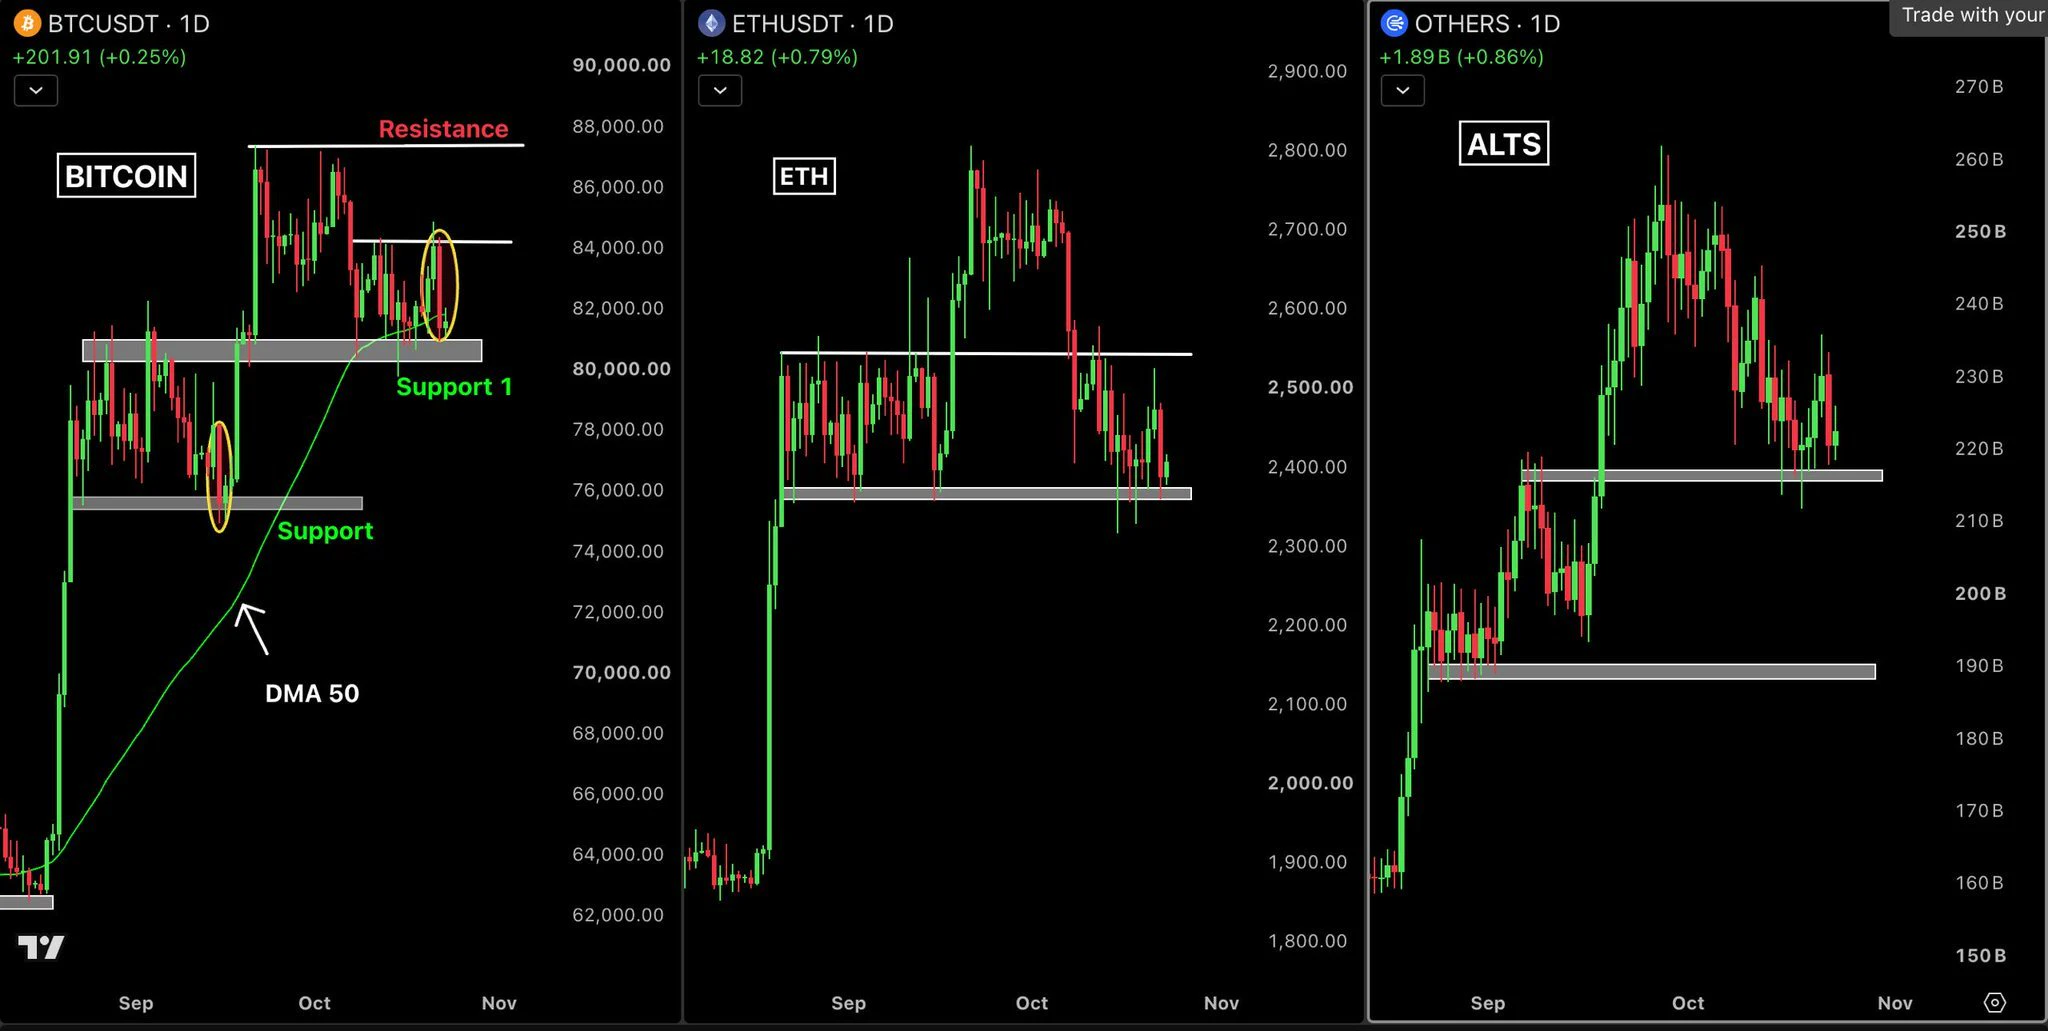
HTF still holding, no major change. Crazy pump, RSI high but no signs of stopping yet ✔️
1H: weak H&S formed → led to this dump. Trendline could get tested if BTC sweeps M/O. Break = deeper pullback, possible sweep of $80
1D: bearish engulfing candle forming, hints at deeper pullback IF it closes like this. Losing M/O could send us to $80, $78, or even $76 retest if we get a dump around PPI/CPI
1W: RSI still stretched. Another red close = 2 bearish divergences in 3 weeks (huge, but too early to call)
Huge untested 1W FVG below that we'll likely tag eventually
Not opening
HYPE-2.20%
BTC-0.53%
Why is everyone suddenly watching SYKAI after the 1D trend turned bearish?

$SKYAI /USDT - SHORT

Trade Plan:
Entry: 0.05604 – 0.05648
SL: 0.05842
TP1: 0.05464
TP2: 0.05356
TP3: 0.05194

Why this setup?


Debate:
Are we heading to TP2 at 0.05356 or is 0.05879 about to trap the shorts?

⚠️ Personal market analysis only. NFA — manage risk and DYOR.
Educational content, not investment advice or a recommendation to buy, sell, deposit, or withdraw any asset. No paid promotion or referral/affiliate links.
SKYAI-5.84%
$MARSCOIN has plunged 17%, and you’re still buying the dip? Retail suckers really are endless! The price of 0.1521 looks tempting, but 240M USD in 24h trading volume shows that the big players are dumping like crazy. Wasn’t the roller coaster from 0.197 down to 0.1469 exciting enough? Let me be blunt: this coin is just the market maker’s ATM. A rebound to 0.16 is your chance to escape; set your stop-loss at 0.145. Anyone catching this falling knife is an idiot. If your position is over 5%, you should halve it now. Don’t tell me about some Musk narrative—he hasn’t even mentioned this shitcoin
MARSCOIN-16.54%
Load More

Join 40 M users in our growing community

⚡️ Join 40 M users in the crypto craze discussion

💬 Engage with your favorite top creators

👍 See what interests you

View More