Square
Following
Hot
News
Profile

DilbaTheGreat

vip
DeFi Analyst
Futures Trading Strategist
Diamond Hands
I’m Dilba a crypto trader with a strategic approach, consistently sharing real insights with discipline and experience
11
Following
232
Followers
1.8k
Liked
Guy's $SNDK and $MU i expect more downside from this stocks 🚨 ‌ ‌
SNDK+0.65%
MU-1.11%
Guy's PONS is showing signs of recovery.
$PONS BUY NOW $0.268
SL, $0.257
TP, $0.286 - $0.294 👌
PONS+3.89%
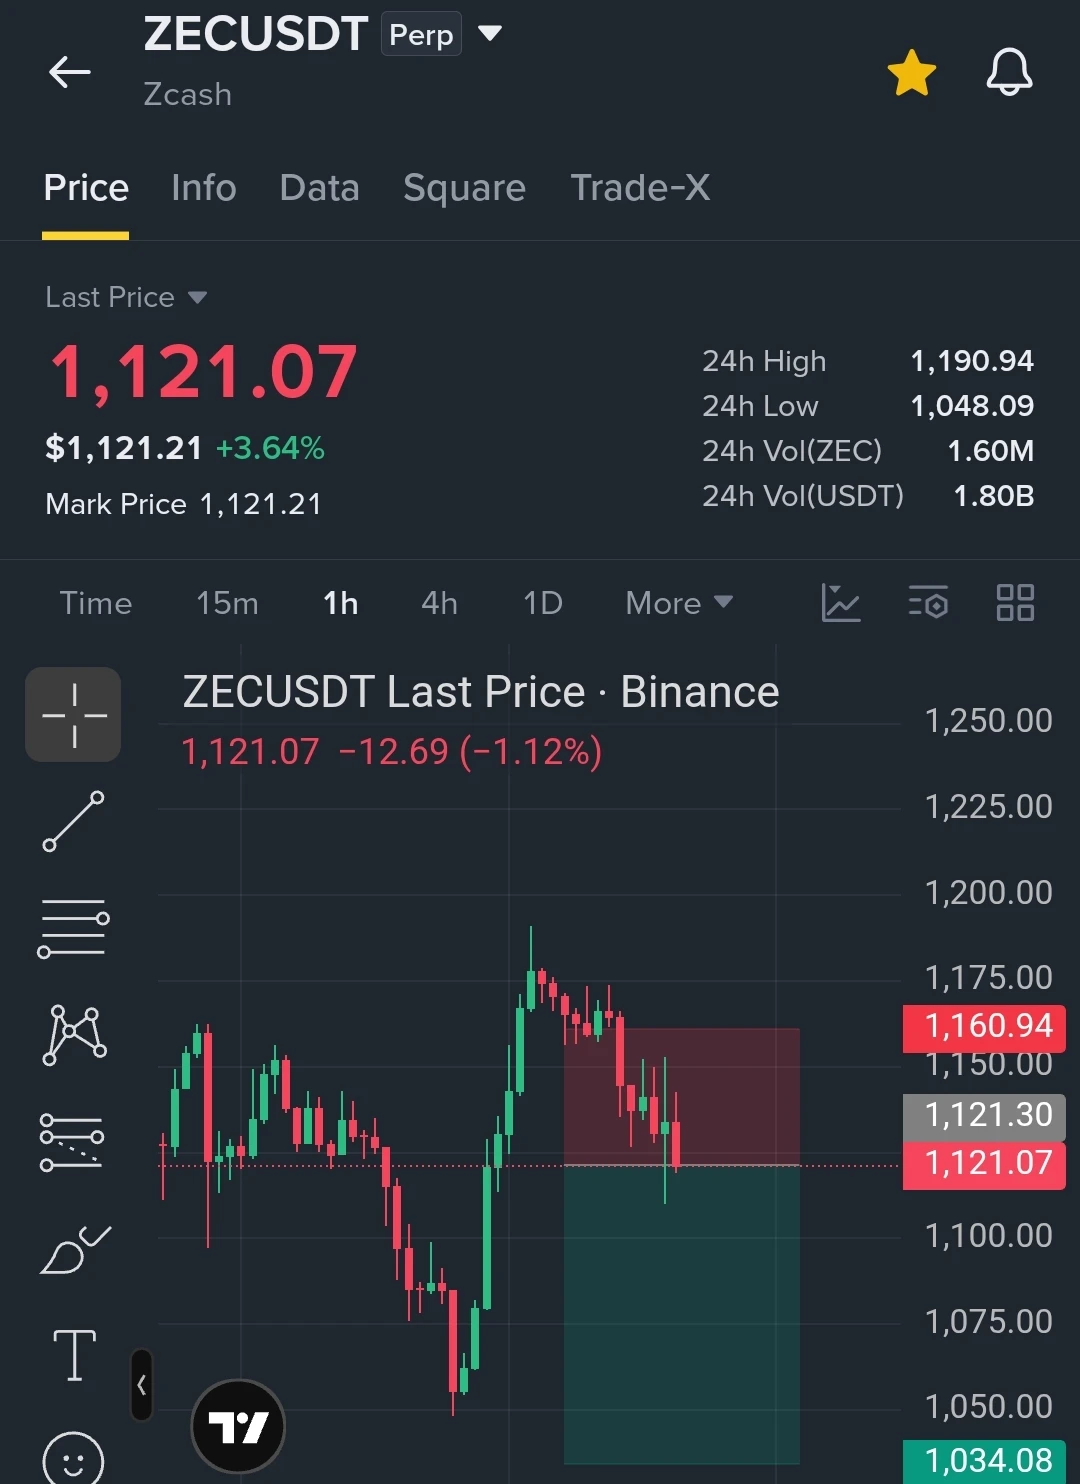
Sellers are stepping back in and the rejection here is getting clear.
$ZEC SELL NOW 1,122
SL: 1,158
TP1: 1,094
TP2: 1,055
Full TP: 1,025
Price is failing to push higher as selling pressure increases, so sellers stay in control while it holds below resistance.
Trade $ZEC
post-image
ZEC-1.54%
$CAP is bleeding out — how low can it go? ‼️
Price is sitting at $0.0700, fighting to hold the $0.0661 low after getting crushed from the $0.1219 peak. The 8H structure is making clean lower highs, and the bounce we see right now is weak.
The key level to watch is $0.0768. As long as price stays below it, the downside prevails.
If bulls reclaim $0.0768: A relief bounce could push back toward the $0.0880 zone but low probability.
If bears break $0.0661: The doors open for a deeper slide toward the $0.0480 base.
My read: Sellers are fully in control. I'm not looking for longs here until price p
CAP-6.22%
The double top is confirmed, buyers are trapped and the floor is giving way.
$DUSK SELL NOW 0.1134
SL: 0.1220
TP1: 0.1080
TP2: 0.1035
Full TP: 0.0980
Price formed a clear double-top structure at 0.1328 and is now printing aggressive lower highs.
Momentum has flipped heavily bearish with consecutive red candles slicing through local support zones.
A confirmed 1H close below the 0.1111 24h low will trigger the next leg of the downtrend.
Trade $DUSK
DUSK+3.56%
$BTC IS LOSING MOMENTUM — $80K IS THE LEVEL TO WATCH! 👀
BTC is hovering near $81,175, and the 4H chart is showing weakness.
🔴 Below $80,500: $79,700 comes into focus.
🟢 Reclaim $81,500–$82,000: Buyers could fight back.
I'm watching $80,500 closely. A breakdown could open the door to more downside.
BTC-0.93%
$NEAR SELL NOW 4.89 🚨
SL: 5.10
TP1: 4.76
TP2: 4.58
Full TP: 4.40
1H chart shows a sharp rejection from the 5.440 peak, printing a clear series of lower highs and lower lows as the uptrend structure collapses.
Price has now lost the 5.084 support shelf and is accelerating downward, confirming aggressive seller dominance and opening a fresh leg down.
With the 24h low at 4.764 sitting right on the edge, a clean break targets the 4.527 swing base for a full retrace.
Trade $NEAR
NEAR-5.31%
$AGT IS THE PUMP RUNNING OUT OF STEAM? 👀
AGT exploded from $0.0135 to $0.1047 and is now trading near $0.075.
👀 Key levels to watch:
- Resistance: $0.089–$0.105
- Support: $0.069, then $0.049
If support breaks, a deeper pullback could follow. If buyers step back in, another rally is possible.
⚠️ Don't FOMO. After a move this explosive, volatility cuts both ways.
AGT+9.86%
$RLC SELL NOW 0.768 🚨
SL: 0.840
TP1: 0.710
TP2: 0.6550
Full TP: 0.605
4H chart shows a sharp rejection from the 1.4887 peak, printing a clear series of lower highs and lower lows as the uptrend structure collapses.
Price has now lost the 0.7895 support shelf and is accelerating downward, confirming aggressive seller dominance and opening a fresh leg down.
With the 24h low at 0.7559 sitting right on the edge, a clean break targets the 0.6463 zone and the 0.6041 swing base.
Trade $RLC
RLC-4.64%
$ZEC ’s structure has shifted from bullish to bearish, with strong selling pressure and price struggling to recover. 💀
📉 Bearish evidence: Price is making lower highs and lower lows, showing sellers are dominating. A break below $1,080 could open the way toward $900 - $800
🟢 What could change? Reclaiming $1,250 would be an early sign that buyers are fighting back.
My read: The trend shift is what matters here. If bearish structure continues, holding a short could capture a larger move. But also risk management matters here.
ZEC-1.54%
$SNDK IN FREE FALL — $1,200 NEXT? ‼️
SNDK is showing strong bearish momentum on the daily chart, trading around $1,310 as sellers keep pushing lower.
Losing $1,300 could open the door toward $1,200.
My read: Sellers are in control. I’m watching $1,300 closely. If it breaks, more downside is possible toward $1,200 - $1,100.
SNDK+0.65%
$AGT JUST PUMPED OVER 108% BUT GUY'S DON’T LET FOMO TRAP YOU. 💀
AGT is exploded from $0.014 to $0.03665. Momentum is wild, but a sharp pullback is possible.
🟢 Bullish: Holding $0.032 and breaking $0.03665 could fuel another leg up.
🔴 Bearish: Losing $0.032 could trigger a deeper correction.
My read: AGT is moving fast, but chasing after a 108% pump is risky.
AGT+9.86%
GRVT is surging through resistance with strong momentum.
$GRVT BUY NOW 0.2266
SL: 0.2130
TP1: 0.2330
TP2: 0.2400
Full TP: 0.2550
Price swept the 0.2029 low, then built a tight base of higher lows instead of continuing down — sellers ran out of steam.
The 1H structure just flipped with a strong green candle pushing straight through the range high at 0.2168.
Holding above 0.2268 confirms the breakout, opening the path back to the 0.2404 origin and beyond.
Trade $GRVT
GRVT+17.77%
𝐒𝐖𝐈𝐍𝐆 𝐓𝐑𝐀𝐃𝐄 🚀
$COLLECT BUY NOW 0.0222
SL: 0.0195
TP1: 0.0260
TP2: 0.0295
Full TP: 0.0330
Price is consolidating above support with demand building, so buyers can keep pressing toward the next resistance.
Trade $COLLECT
COLLECT-2.24%
$SNDK IS BREAKING DOWN — HOW MUCH LOWER CAN IT GO? 🚨
SNDK has dropped sharply and is now trading around $1,428 after losing the $1,470 support area.
Bullish scenario: If buyers reclaim $1,470 and hold above it, we could see a recovery.
Bearish scenario: If selling continues, the next important area to watch is around $1,313.
My read: The daily chart remains weak, and buyers haven't shown enough strength to confirm a reversal. I'm watching whether SNDK can reclaim $1,470 or continue moving lower.
SNDK+0.65%
$CT IS SHOWING STRENGTH AND MORE UPSIDE AHEAD?
CT has recovered strongly from $0.295 and is now trading around $0.398. Buyers have pushed price higher, and the chart is starting to look stronger.
Bullish scenario: If CT breaks above $0.406 and holds, we could see another move toward $0.415 and higher.
Bearish scenario: If price gets rejected and loses $0.372, a deeper pullback could follow.
My read: I’m expecting more movement from CT. Buyers are showing strength, but I want to see a clean breakout above $0.406 to confirm the next push. I’m watching this one closely.
CT+2.58%
𝐁𝐈𝐆 𝐒𝐇𝐎𝐑𝐓 𝐒𝐄𝐓𝐔𝐏 🚨
$RLC SELL NOW 0.846
SL: 0.905
TP1: 0.750
TP2: 0.680
Full TP: 0.550
4H chart shows a vertical parabolic pump into 1.4887 that was instantly rejected, printing a clear series of lower highs as the rally collapses.
Price has now lost the 0.9748 support shelf and is accelerating downward, confirming aggressive seller dominance and opening a fresh leg down.
With the 24h low at 0.8470 sitting right on the edge, a clean break targets the 0.6463 swing base for a full retrace.
Trade $RLC
RLC-4.64%
This reclaim signals buyers stepping back in.
$ZEC BUY NOW 1,247
SL: 1,210
TP1: 1,310
TP2: 1,340
Full TP: 1,380
1H chart flushed into 1,122.38, sweeping the lows before printing a strong V-shaped recovery that reclaimed the entire drop zone.
Price is now pushing through 1,247.22 with consecutive bullish candles, confirming dip buyers are active and momentum has flipped back up.
A clean break above 1,260.55 opens the path to the 1,310.38 resistance and the major swing high at 1,348.89.
Trade $ZEC
ZEC-1.54%
$SNDK SELLERS ARE TAKING CONTROL. 🚨
SNDK is down 7.61%, with price falling sharply to $1,484 after failing to hold higher levels.
Bullish scenario: If buyers defend the $1,467 area and push price back above $1,556, we could see a recovery.
Bearish scenario: If $1,467 breaks, further downside could follow as sellers remain in control.
My read: The daily chart looks weak right now. I want to see buyers defend support before expecting a recovery. If support fails, I’ll be watching for further downside.
SNDK+0.65%
Rejection at the highs and this lower highs signal sellers stepping back in.
$BTC SELL NOW 82,530.9
SL: 83,700
TP1: 81,80
TP2: 81,000
Full TP: 80,300
1H chart shows a sharp rejection from the 84,340.2 peak, printing a clear lower high as the recovery rally loses steam.
Price has now lost the 82,782 support shelf and is rolling over, confirming momentum has shifted to the downside.
With the 24h low at 82,349.1 sitting right on the edge, a clean break targets the 81,903 zone and the 80,344 swing base.
Trade $BTC
BTC-0.93%