Share your thoughts
placeholder
Article
btc market chart
live-cover
LIVE25
$AKE has decisively broken out of the previous sideways consolidation range, forming a strong bullish candlestick. The breakout is supported by strong momentum, and the bullish setup remains valid as long as the price holds above the breakout zone.
Bullish setup entry: $0.0350 – $0.0380TP1: $0.0420TP2: $0.0450TP3: $0.0500Stop-loss: $0.0280Buy and trade $B
ZEC.
post-image
AKE+73.42%
ZEC-1.45%
The AI Rally Is Bigger Than One Stock
What if the most important AI signal isn't the biggest stock—but the number of companies moving together?
This rebound spread across chips, servers, connectivity and AI applications.
Does broader participation make the rally more meaningful?
Part 1 established the headline: Nasdaq gained 1.69%.
Now comes the more interesting question—how broad was the AI move?
The latest session showed strong participation across multiple layers of the technology ecosystem. Tempus AI rose 14.85%, Supermicro 9.50%, Astera Labs 9.06% and Arm 8.57%. Semiconductor names also a
post-image
xxx40xxx
AI Rebound: New Cycle or Relief Rally?
The AI trade just came roaring back—but the bigger story may be what happens next.
Nasdaq jumped 1.69% while several AI names gained nearly double-digit percentages.
Is this the beginning of another AI expansion, or simply a powerful relief rally?
September has already reminded investors how quickly the market can change direction.
After a volatile week dominated by inflation concerns, oil prices, Treasury yields and the Federal Reserve's first rate hike since 2023, U.S. equities suddenly regained momentum. The Nasdaq closed 1.69% higher, the S&P 500 added 1.14%, and the Dow gained 0.61%. The VIX also dropped 10.23%, showing a clear reduction in near-term market fear.
But the most interesting part was inside the technology sector.
Tempus AI surged 14.85%, Supermicro gained 9.50%, Astera Labs rose 9.06%, and Arm climbed 8.57%. Semiconductor stocks were particularly strong, with the Philadelphia Semiconductor Index gaining 3.14%.
That creates an important distinction.
The market did not simply buy “technology.” It aggressively repriced companies connected to the AI infrastructure chain.
For Web3 and crypto traders, this is a familiar pattern. Narratives can move first, but sustainable trends require liquidity, participation and fundamental confirmation.
AI now faces the same test.
One strong session proves momentum—not a new market regime.
Over the next four parts, we will examine breadth, liquidity, infrastructure and valuation to determine what this rebound is actually telling us.
The first signal is bullish momentum. The next question is much harder: can the AI trade keep attracting capital after the initial excitement fades?
This content is not investment advice. Always perform your own research before making financial decisions.
$BTC $GT $ETH
#USAIConceptStocksReboundAcrossTheBoard #Gate广场中秋团圆局 #美股AI概念股全线反弹 #GateSquareMidAutumnReunion #JapanRealEstatePowerChipStocksRise
repost-content-media
BTC+6.02%
GT+6.40%
ETH+7.48%
  • 1
Financial News, Crypto Market Updates, Real-World Strategies
live-cover
LIVE81
Cracking hike today. You can’t beat the Lake District 🥾 ⛰️
post-image
$Ltc all the way!
post-image
LTC+6.06%
$MSTR
clear red diagonal resistance breakout! 💥
post-image
MSTR+16.35%
  • 1
BREAKING 🚨Bank of Japan hikes benchmark rate to 1.25%, a 31‑year peak 🚀The 25‑basis‑point increase marks the first tightening since 1995, pushing Japan’s policy rate to its highest level in three decades. Markets anticipate tighter monetary stance may curb inflation but could pressure export‑driven growth. Global investors are recalibrating portfolios amid shifting Asian yield curves.Stay tuned for updates 🔔$G, $STR, $AKE
post-image
AKE+73.42%
Everyone calling $XAG /USDT a breakout is missing the 1h setup forming right now.

$XAG /USDT - SHORT

Trade Plan:
Entry: 66.24 – 66.44
SL: 67.28
TP1: 65.63
TP2: 65.16
TP3: 64.45

Why this setup?
Why now? The 4h trend is range-bound, but the 1h RSI at 44.22 signals fading momentum before the next leg. With a 1h ATR of 0.393242, the entry zone between 66.24 and 66.44 offers a precise short trigger at 66.34. TP1 sits at 65.63, and TP2 at 65.16, giving clear profit-taking levels that align with the daily range structure. The invalidation level of 65.34 is the hard line in the sand that protect
XAG+1.59%
Precisely predicts in advance and leads hundreds of people to place orders to catch the top, accurate to within 0.2 every time—who else? The scalp-trend streamer.
Happy $STONK10 ATH
Why is everyone suddenly ignoring $ENA /USDT right now?

$ENA /USDT - LONG

Trade Plan:
Entry: 0.16609 – 0.16785
SL: 0.15856
TP1: 0.17328
TP2: 0.17748
TP3: 0.18379

Why this setup?
Why now? The daily trend is bullish and the 1h price is sitting at 0.16699, which means the market has already moved into the entry zone defined by 0.16609 to 0.16785. The 15m RSI is at 58.02, showing room to run before overbought territory while the 1h ATR of 0.003504 tells us the next hourly move could be substantial. If the long setup plays out, the first target is 0.17328 and the second target is 0.17748, wit
ENA+8.75%
#晒出我的持仓收益 In a bull market, you just have to hold on tight.
post-image
$BTC Signal】Long|1H momentum continuation, buy the dip
$BTC RSI: 1H 82.74, 4H 78.09; order book depth -79.05%, Bid/Ask 0.12. The 4H MACD histogram expanded to 531.8, while the 1H MACD histogram contracted to 294.8. Price is above the 4H Bollinger upper band at 79765, while the 1H upper band at 81606 remains untouched. 4H volume fell back from 93465 to 23317, the funding rate is 0.0062%, and OI is stable. The current price is near the upper edge of the entry zone; place limit orders at 80635.964 - 80878.600. The risk-reward ratio is 1.50, with a stop-loss distance of 0.7%-1.0%. I prefer lettin
post-image
BTC+5.99%
GN to those who GN💤
post-image
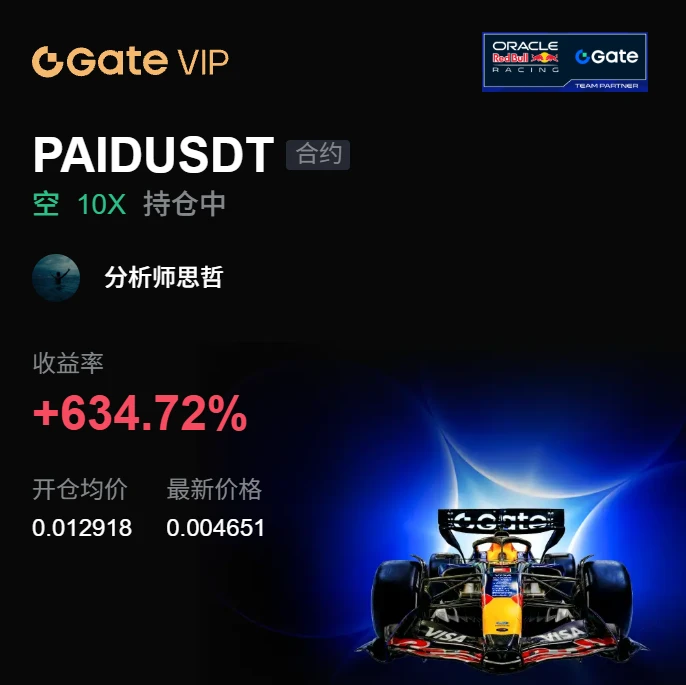
I didn’t make any particular judgment; I just held it a little longer and didn’t expect it to really cooperate.

During the repeated intraday swings, I watched $PTB . There were no buyers on the way up, selling pressure was strong, and trading volume was low, so I advised shorting at high levels and waiting for a breakdown.

Opened a short at 0.0008905; it fell to 0.000675, with unrealized gains of +594.25%. That was a satisfying bite of profit—it was worth the wait.

Take 80% off first, and protect the remaining 20% at the breakeven price. Even if it rebounds, don’t give the profits back; i
post-image
PTB+4.85%
BTC+5.99%
DOGE+7.59%
$NEAR NEAR Rises to $3.48: Secret TVL Milestone and ETF Application
NEAR Protocol (NEAR) reached $3.48 on the morning of September 18, 2026, gaining 29.51% in the last 24 hours. Intraday trading ranged between $2,635 and $3,516, pushing market capitalization above $4.11 billion. This surge is driven by three key developments:
The Secret TVL Milestone and the NEAR@3.33 Program
NEAR’s privacy-focused cross-chain trading pipeline, Confidential Intents, reached a total locked value (TVL) of $70 million on September 15. This threshold triggered a snapshot under the NEAR@3.33 incentive program. Ac
post-image
$AKE Signal】Long + 1H overbought breakout retest
$AKE 1H RSI 89.69, 4H RSI 77.02, with funds in the overbought zone continuing to push price higher.
The 1H/4H MACD bullish bars are expanding, and the Bollinger upper bands at 0.0330/0.0331 have been pierced by the current price of 0.035636. Order book depth imbalance is -34.10%, bid/ask is 0.49, bids below are sparse, and clear signs of distribution at the highs are evident. Funding rate is 0.0712%, OI is stable, and the 24H gain is 69.17%. The risk/reward ratio at this level is approximately 1.5, making placing orders on a pullback more ratio
post-image
AKE+73.08%
BTC+6.02%
ETH+7.48%
SOL+12.82%
$btc you see it..
Mid range held..
Red line into Q4..
post-image
BTC+6.02%
#JapanRealEstatePowerChipStocksRise Japan’s stock market is giving investors a more interesting question than simply “Is the Nikkei going higher?”
The real question is:
Where is the next wave of capital going?
Real estate.
Power infrastructure.
Or semiconductors.
And I think this is where the current Japanese market becomes much more interesting.
Semiconductors still have one of the clearest structural narratives. Japan’s manufacturing sentiment improved sharply in September, with strong semiconductor and data-centre demand cited as an important driver. At the same time, Japan and the U.S. are
Load More

Join 40 M users in our growing community

⚡️ Join 40 M users in the crypto craze discussion

💬 Engage with your favorite top creators

👍 See what interests you

Trending Topics

JapanRealEstatePowerChipStocksRise

58.65k Views3.56k Discussing

Japan's Nikkei extended gains on Sept 18, with real estate, power, and semiconductor sectors leading. Gate covers over 12,800 global stocks and ETFs, offering one-stop USDT trading across US, HK, Korean, and Japanese markets. [👉 Read more](https://www.odaily.news/en/newsflash/518749)

USAIConceptStocksRally

33.45k Views507 Discussing

GateTopsStockPerpetualCoverage

37.59k Views2.31k Discussing

View More