Share your thoughts
placeholder
Article
#SECApprovesLimitedOnChainTradingOfTokenizedStocks
The SEC just moved tokenized stocks from an interesting crypto experiment closer to regulated U.S. market infrastructure.
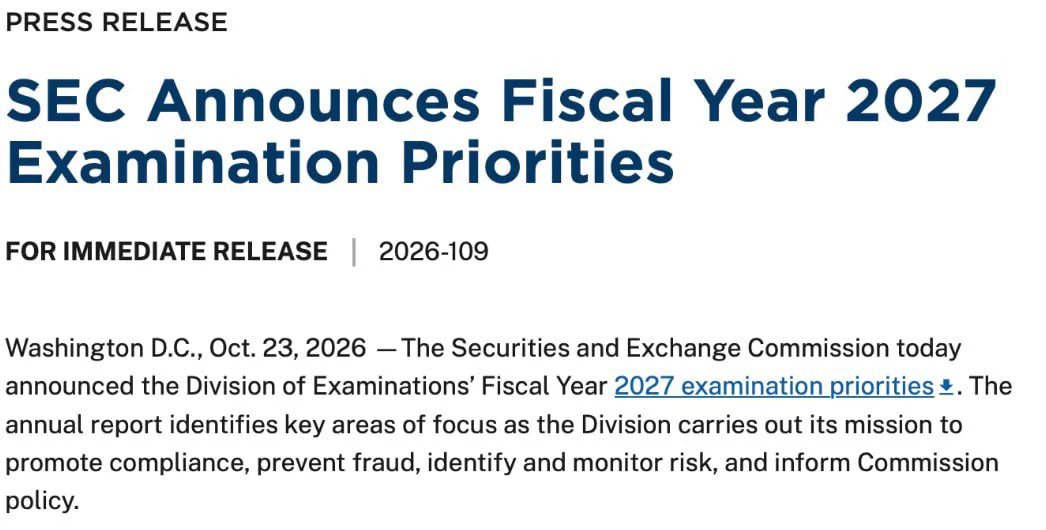
On September 17, the SEC issued its “Innovation Exemption,” creating a temporary five-year framework for qualifying Tokenized Securities Venues to trade tokenized NMS stocks through permissioned automated market makers and liquidity pools. This is important because the SEC is not simply allowing anyone to put stock tickers on a blockchain. The venues and products have to operate under specific conditions.
The biggest point
post-image
  • 1
$ONE secured as profit. That’s it for this week. Rest over the weekend and spend time with your family. We’ll fight again next week, brothers.
post-image
ONE+0.56%
alright when top?
post-image
$INTC No worries if you missed entering the short position—another opportunity has arrived!
$M At the current price around 994, you can consider entering the short position directly!
Entry logic: resistance at the 1000 round-number level and the 12-hour MACD zero-line watershed; enter after the daily MACD death cross, stop-loss at 1020, take-profit at 966–947, with a suitable risk-reward ratio—let's do it!
post-image
INTC-1.94%
$SOL Signal】Long + 1H momentum continuation/order book support
$SOL 1H bullish momentum continues, RSI 85.37, with price riding the upper band. The 4H MACD red histogram is expanding, while the 1H momentum histogram is narrowing. Order book depth imbalance is 21.32%, Bid/Ask is 1.54, and bids below are active.
🎯Direction: Long
⚡Entry/pending order: 111.9133 - 112.2500
🛑Stop-loss: 111.1275
🚀Target 1: 113.9338
🚀Target 2: 114.7756
🛡️Trade management:
- Execution strategy: Reduce the position by 50% after reaching Target 1 and move the stop-loss up to breakeven. If the price falls back to th
post-image
SOL+11.67%
BTC+5.88%
ETH+6.88%
Rally or Trap? Three Risks and One Question
A single 1.7% day on the Nasdaq is not a trend.
But the great turning points in market history also started with days like this.
What separates the two? Three gauges and one question.
Risk 1 — the rate path. The Fed ended its 2026 cycle with a hike and signalled one more before year-end. Tightening conditions press directly on growth companies that book most of their cash flow in future years.
Risk 2 — concentration. Information technology now accounts for roughly 38% of the S&P 500, against a long-run average near 18%. When an index is carried by a
post-image
xxx40xxx
It's Called the AI Rally, But the Fuel Is Liquidity
The market calls it an AI rally.
But would this picture have formed if the 10-year Treasury yield had not slipped below 5% and the VIX had not dropped 11%?
And does on-chain liquidity tell the same story?
Three variables carried risk appetite on 17 September: a 4.93% 10-year yield, a VIX at 15.7 and softer oil. Together they lower the cost of carrying risk. More often than not, prices are moved by conditions rather than headlines.
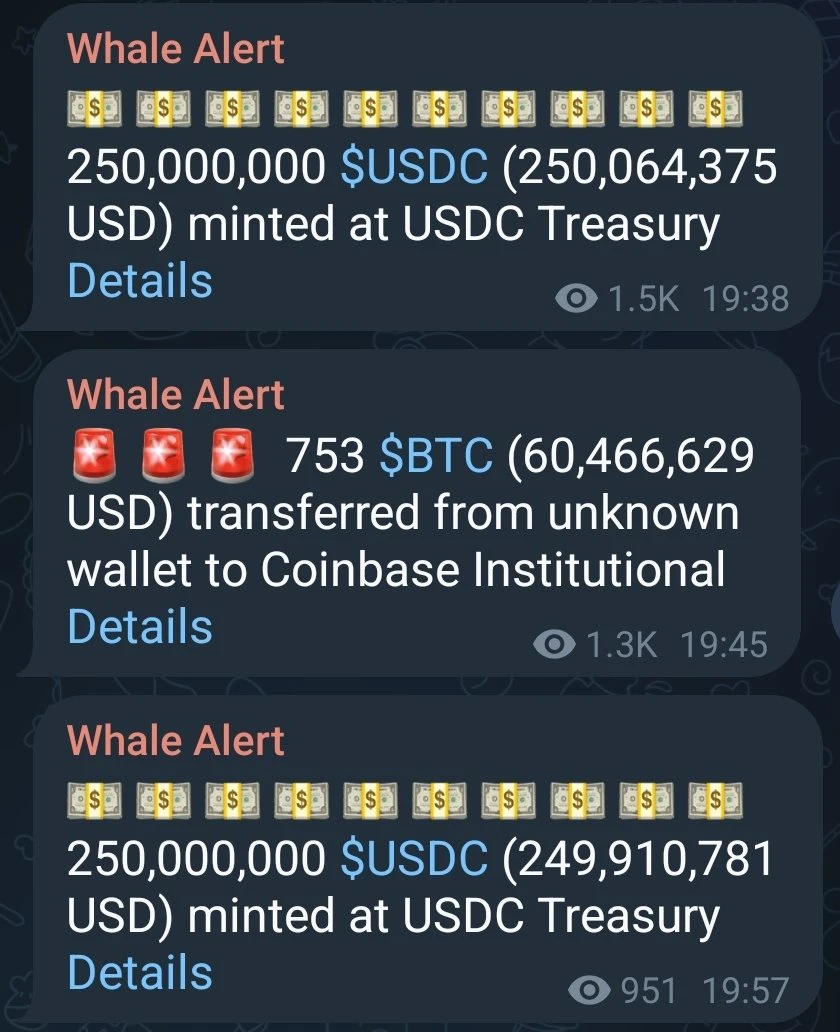
Crypto lives this dynamic faster. Stablecoin supply, transfer volumes in cash-like assets such as USDC, collateral quality inside DeFi protocols and the depth of liquidity pools rank among the most transparent measures of risk appetite. That is Web3's edge: this data sits on-chain rather than behind closed doors. An analyst watching on-chain liquidity can answer "where is the leverage coming from?" far faster than in traditional markets.
The first signs of deteriorating risk appetite show up here early too: tightening collateral ratios, sudden jumps in lending rates, stablecoin flows changing direction. In traditional markets such signals arrive late, after the close; on-chain they are readable in real time — an asymmetry that makes Web3 tooling a genuinely useful complementary risk panel.
GateSquare is where that bridge gets built: while the AI narrative drives the Nasdaq, the same theme finds expression in crypto through new Launchpad structures, tokenomics design and DeFi products. One caveat still applies: correlation is not causation, and the two markets do not always react to the same headline in the same direction.
So what is this optimism missing? Three concrete risks — and the series finale — in Article 5.
This content is not investment advice. Always perform your own research before making financial decisions.
$BTC $GT $ETH
#Gate广场中秋团圆局 #美股AI概念股全线反弹 #GateMemeCarnival #WhereToParkStablecoinsWhileWaiting #GateSquareMidAutumnReunion
repost-content-media
BTC+5.88%
GT+6.19%
ETH+6.88%
  • 9
Crypto narratives move fast.
Blockchain data moves differently.
So what happens when the story on social media disagrees with what is happening on-chain?
This is where on-chain analysis becomes powerful.
A Meme token may suddenly become the center of attention on social platforms. Posts multiply, communities become more active and traders begin discussing potential breakouts.
But blockchain activity can provide another perspective.
Wallet distribution, transaction activity, token movements and liquidity changes can help traders understand how participation is developing.
The important word is
post-image
xxx40xxx
A Meme token can have enormous attention and surprisingly little liquidity.
That combination can create explosive moves in both directions.
But how much of a rally is actually supported by real market depth?
Liquidity is one of the most overlooked concepts in speculative crypto markets.
When liquidity is deep, larger orders can often be absorbed with less price impact. When liquidity becomes thin, relatively small orders can move price much more aggressively.
This matters enormously for Meme assets.
A trader may see a rapid breakout and assume that strong demand is driving the market. But if available liquidity is limited, part of the move may simply reflect how little capital is required to shift the order book or available pools.
That does not automatically make the move invalid.
It changes the risk profile.
DeFi liquidity pools, centralized exchange order books, stablecoin flows and trading volume can all influence how efficiently a market functions. This is why liquidity should be viewed as infrastructure behind price—not just another technical indicator.
The same principle applies during pullbacks.
When sellers appear, a thin market can accelerate downward movement. A deeper market may absorb selling more efficiently. This difference can completely change execution, slippage and risk management.
The key lesson is simple: volatility is not only about sentiment.
It is also about market depth.
For GateSquare traders, this creates a useful discussion point. Instead of simply posting “bullish” or “bearish,” explain what you see in liquidity and why it changes your thesis.
The next question becomes even more interesting:
If liquidity is the market’s fuel, where is that fuel actually coming from?
This content is not investment advice. Always perform your own research before making financial decisions.
$ARC $ARGUS $GSTOCKBSC
#GateMemeCarnival #Gate广场中秋团圆局 #Arc生态热门代币波动加剧 #ArcEcosystemHotTokensSeeIncreasedVolatility
#GateSquareMidAutumnReunion
repost-content-media
BTC+5.88%
GT+6.19%
ETH+6.88%
  • 2
#每周来晒 #Where to Put Idle Funds When the Market Direction Is Unclear
Bull or bear market uncertain, I had some stablecoins on hand but never knew where to put them, so they just sat there. Later, I saw people in the community sharing their allocation ideas, and decided to organize my own plan as well.
First, my situation: I have around 5,000 USDT—not a lot, but I don't want it sitting idle. A 10,000 USDT allocation plan was widely discussed in the community, with the core idea being to “give every dollar a clear purpose”—some funds ready for immediate use, some earning steady returns, and some
post-image
GUSD-0.01%
BTC+5.88%
  • 6
$PAXG Buy long 🟢
Current price: 4381. Technical momentum is mixed: short-term moving averages are under pressure, while longer-term moving averages continue to provide support. RSI is near neutral, so further confirmation is needed. 🔹 Entry: 4370–4385🎯 TP1: 4405🎯 TP2: 4435🎯 TP3: 4470🛑 SL: 4338$PAXG leverage: up to 10x. Invalidation: A sustained break below 4338 would weaken the long setup. $PAXG HYPEJumpsOver11%
post-image
PAXG+0.74%
#WhereToParkStablecoinsWhileWaitingTo Park Stablecoins While Waiting for the Next Market Opportunity
In the crypto market, patience is a strategy, not a weakness. When the market becomes uncertain and major assets start moving sideways, many traders face an important question. Where should we park our stablecoins while waiting for the next big opportunity?
Stablecoins offer traders a way to maintain exposure to digital assets without directly holding volatile cryptocurrencies. However, simply holding stablecoins is not the only option. Depending on your goals, risk tolerance, and investment ho
USDC-0.04%
BTC+5.88%
ETH+6.88%
Three central banks in 72 hours. Bitcoin SV did not print a new low. 🔥💥
Bitcoin SV is not a yen-carry trade. 💪🏼
The protocol does not rewrite itself when Tokyo, London or Washington moves the policy rate.
15 September — Clarity Act cloture missed 60 (49–50).
16 September — Fed +25 bp to 3.75–4.00%.
17 September — BoE held 3.75%; three of nine voted to hike.
18 September — Bank of Japan +25 bp to 1.25%, the highest since April 1995. ⚠️
That is the maximum short-term macro tape.
The textbook ending is a fresh correction low. It did not print.
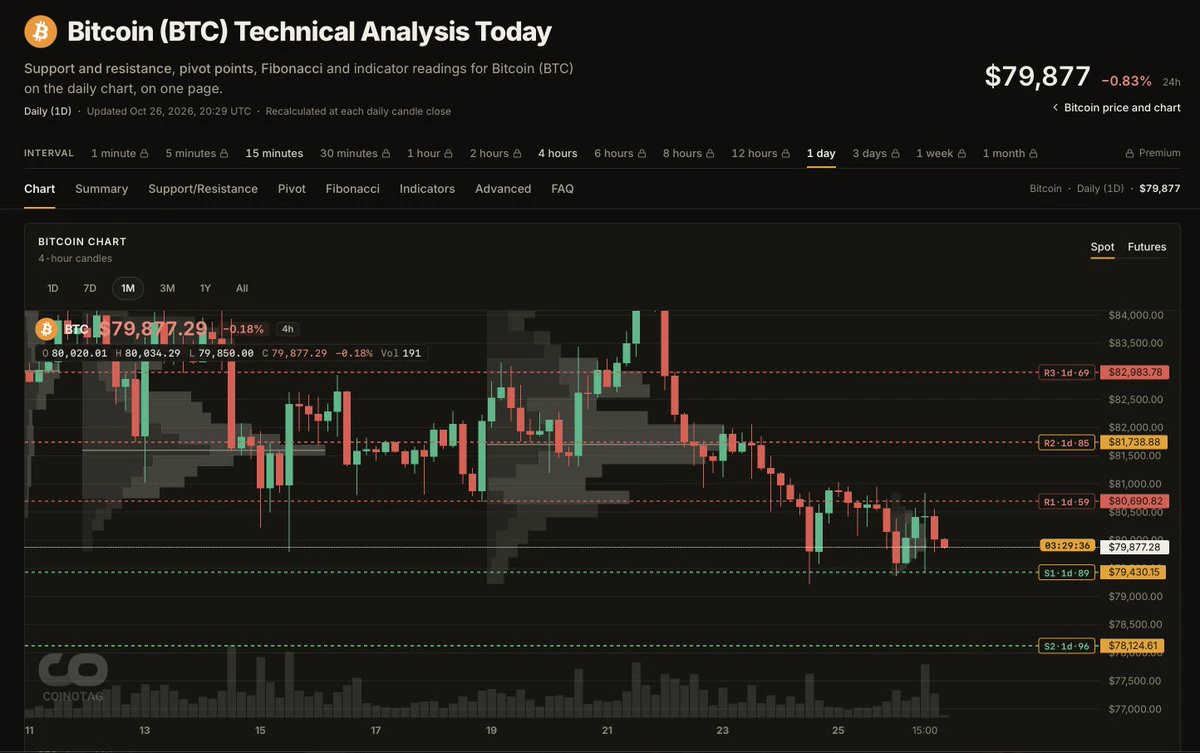
BTC recovered from about $75,600 toward $80,000.
post-image
BTC+5.88%
BSV+6.16%
  • 3
long the top type shi
post-image
The Sui founder, instead of jumping on the RWA train like he did with the stablecoin and privacy metas, is busy buying a <$1M mcap shitcoin in hopes that people bring their animal instincts and negative-sum games to his chain 🤡
post-image
SUI+9.76%
RWA+0.44%
#美股AI概念股全线反弹 🌙 | Short positions during the day, swept again at night
【Market | After Friday’s Close】
• BTC ~$81,000 (24h +5.5%), holding the $8K–$80.5K support zone
• ETH ~$2,600 (+5.78%), +27.9% this month, still -46.7% year-to-date
• SOL leads altcoins with +8.19%; BNB +4.55%, XRP +4.85%
• Total market cap ~$1.58T, 24h volume $30.7B, liquidity score 69.56
【Key Events of the Week】
Thursday’s first rate hike in 3 years + repairs to the Saudi pipeline → marginal easing of inflation concerns; but with the 10Y U.S. Treasury yield nearing 5%, the $82K above BTC has continued to feel like it is b
BTC+5.88%
ETH+6.88%
SOL+11.67%
BNB+5.07%
XRP+7.31%
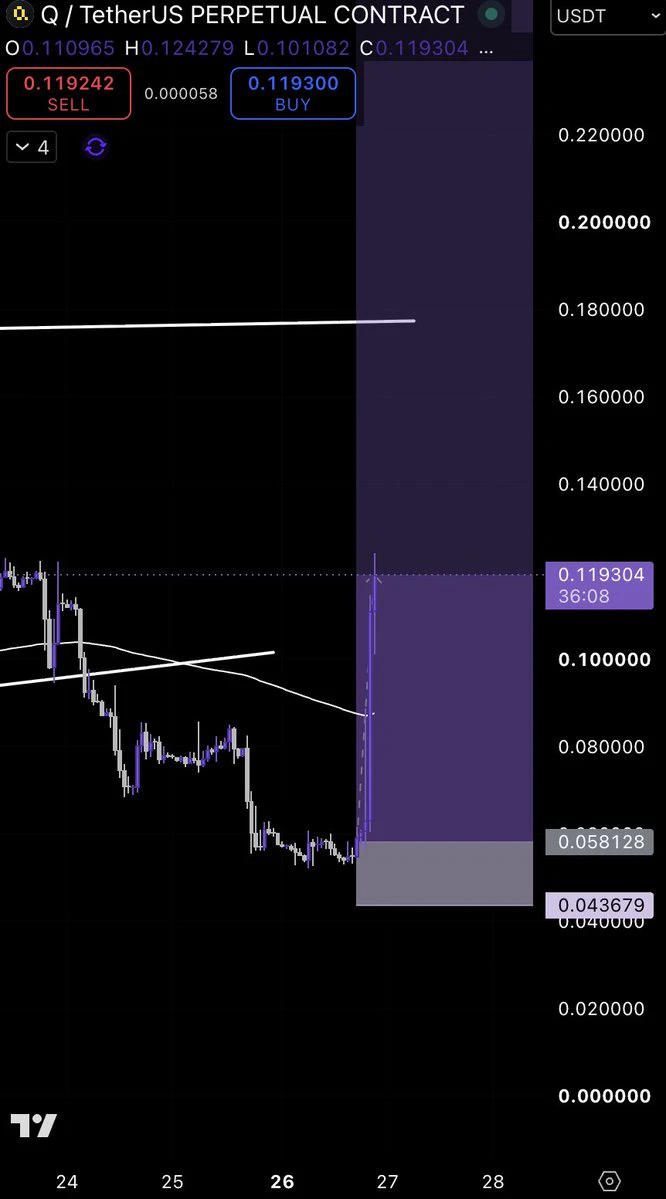
$CROSS Down nearly 29% in a day—those who bought in at 0.1876 are probably green-faced now.
What does this trend look like? Like rushing into an elevator only to realize you pressed the down button, and the doors are welded shut. The 24-hour trading volume is 54.6M, which is not small, indicating that some are cutting losses and running while others are scooping up around 0.128. The low of 0.1282 was hit right on target, signaling a short-term sentiment bottom.
The old-timers in the group all know: don’t buy the dip during a sharp drop; wait for stabilization. Those looking to bet on a rebound
CROSS-23.39%
$INJ Current price 6.72, 24h +19.49%, trading volume 25.0M USDT, funding rate +0.0100%, Fear & Greed Index 56. MA5 at 6.6476 has crossed above MA20 at 6.26985, and the MACD histogram at +0.02222 remains bullish, but RSI has reached 71.1 and entered the overbought zone. The Bollinger upper band at 7.0546 is acting as short-term resistance, while the 21.69% amplitude over 30 candles indicates a considerable risk of wick formation.
The funding rate of +0.01% is mildly positive, indicating that longs are willing to pay to hold positions, but positioning has not yet reached an extreme level of crow
post-image
INJ+19.03%
SNXX+16.15%
Billions wiped from the charts as the entire post golden cross pump vanishes in seconds. Can the bulls survive this heavy regulatory showdown? Quick breakdown of the current chaos: $BTC price action is crashing hard ahead of the Senate Clarity Act vote this afternoon, paired with growing Fed rate hike worries. Total market tension is through the roof right now. Fingers crossed we find some solid support soon. #Bitcoin #CryptoTrading #GateIdleEarnAutoYieldUpTo3% #GateLaunchesTrenchesWith0GasFee
post-image
BTC+5.88%
Oil Prices Stay Elevated! Higher Energy Costs Add Pressure Across Global Markets
live-cover
LIVE938
Why Did Tech Rally While the Fed Raised Rates?
The Fed raised rates, and tech stocks still rallied.
Every textbook says the opposite should happen.
The explanation comes down to one thing: the gap between what the market had priced in and what it actually got.
On 16 September, the Fed raised its policy rate by 25 basis points to 3.75–4.00%. The decision was unanimous at 12–0 and marked the first hike since 2023. Projections point to one more increase before year-end. August CPI came in at 3.4% year on year with core inflation at 2.4%, and nonfarm payrolls beat expectations at +162,000. The mac
post-image
xxx40xxx
One Day, +14.9%: Is This a Turn, or Just a Bounce?
One stock jumped 14.9% in a single session.
Most of the market read it as the return of the AI rally.
But the central bank raised rates the same week — so where did the buying really come from?
On Thursday, 17 September 2026, all three major US indices closed higher. The Nasdaq Composite gained 1.7% to 26,418.30, the S&P 500 added 1.1% to 7,637.76, and the Dow Jones rose 0.6% to 51,778.04. The day belonged to AI names: Tempus AI (TEM) climbed 14.9%, Super Micro Computer (SMCI) 9.5%, Astera Labs (ALAB) 9.0% and Arm Holdings (ARM) 8.5%. The semiconductor index added 3.1%.
Step back, though, and the numbers tell a different story. Over the full week the Nasdaq was up just 0.3%, while the Dow was down 1.5%. What we have is not a trend change but a powerful one-day surge.
The reason is that each of the four stocks carried its own company news: a growth message from Tempus AI management at a healthcare conference, record order intake at Super Micro, a new memory controller from Astera Labs, and a data-centre chip target at Arm.
The takeaway is blunt: headlines amplify moves, data supplies context. In Web3, analysts who read on-chain liquidity before the headline apply exactly the same discipline here.
So are these four really part of one story? The answer is more uncomfortable than it looks — Article 2 goes straight at it.
This content is not investment advice. Always perform your own research before making financial decisions.
$BTC $GT $ETH
#Gate广场中秋团圆局 #美股AI概念股全线反弹 #USAIConceptStocksRally #JapanRealEstatePowerChipStocksRise #GateSquareMidAutumnReunion
repost-content-media
UBS-0.10%
  • 5
  • 1
Load More

Join 40 M users in our growing community

⚡️ Join 40 M users in the crypto craze discussion

💬 Engage with your favorite top creators

👍 See what interests you

Trending Topics

JapanRealEstatePowerChipStocksRise

58.56k Views3.5k Discussing

Japan's Nikkei extended gains on Sept 18, with real estate, power, and semiconductor sectors leading. Gate covers over 12,800 global stocks and ETFs, offering one-stop USDT trading across US, HK, Korean, and Japanese markets. [👉 Read more](https://www.odaily.news/en/newsflash/518749)

USAIConceptStocksRally

33.39k Views466 Discussing

GateTopsStockPerpetualCoverage

37.54k Views2.31k Discussing

View More