










#WCTCS9 #BTC #ShareWeekly
BTC Market Analysis: Holding the 76K Floor, Waiting for Confirmation Above 78.4K
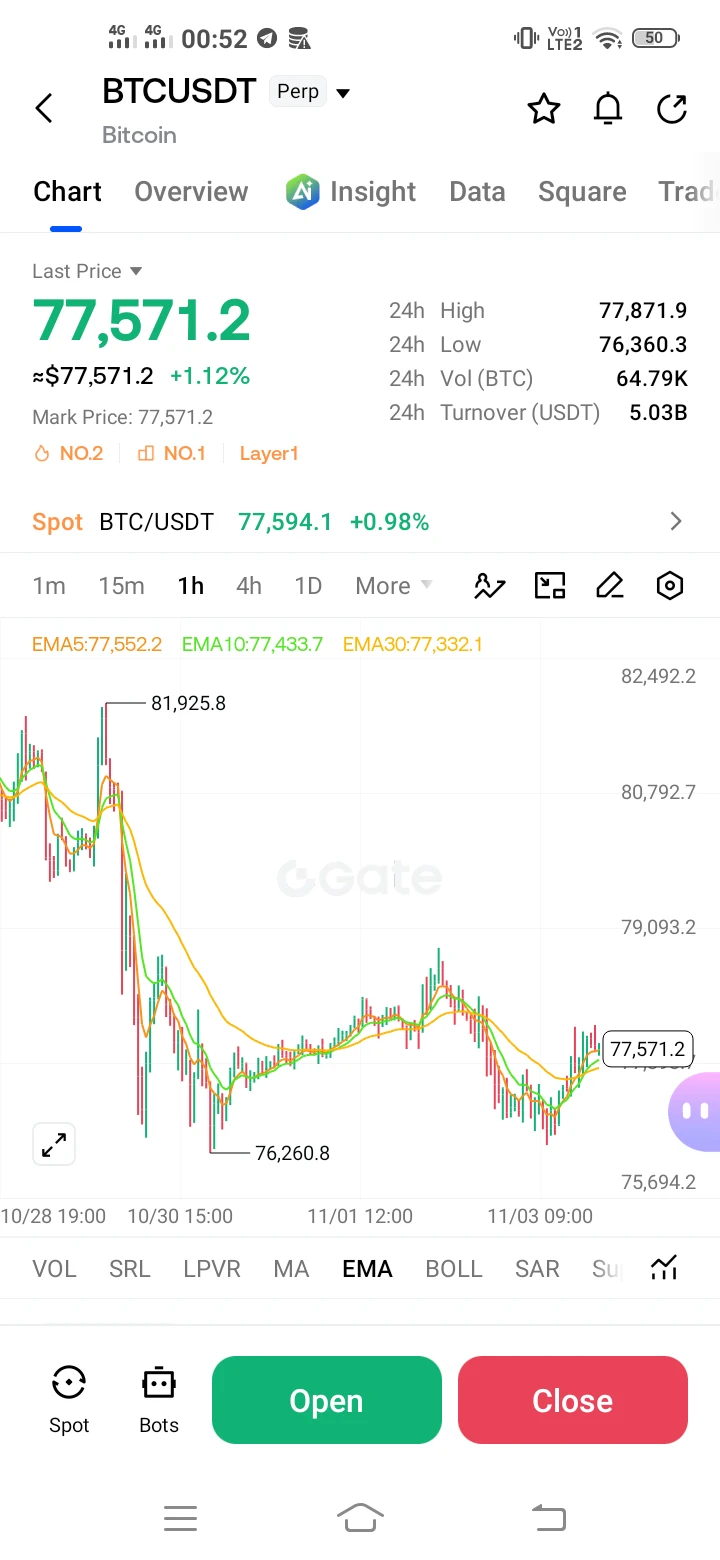
Bitcoin is trading around 77,500 USDT on Gate spot, up roughly 0.9% from the previous daily close of 76,806.6, with today's intraday range between 76,387 and 77,894. The bigger picture is still cautious. Since early October, BTC has been making lower highs, moving from the 87,200 area on October 2 to 84,900 in late October, then 81,965 on October 29, and finally 78,860 on November 2. Price has been rejected at each of those levels. The 76,000 to 76,400 zone has held several times, including the October 30 low at 76,283 and today's low near 76,387, so the market is building a base, but it has not yet shown a clear trend reversal.
The daily indicators reflect that mixed picture. RSI sits near 35, which is close to oversold but does not signal a bottom by itself. MACD remains negative, and the short-term moving averages are stacked against the price: the 7-day EMA is around 78,370 and the 30-day EMA around 80,600, both above current price. The 200-day moving average near 73,200 and the 120-day near 74,500 are well below, which means the long-term structure is still intact even though the short-term momentum is weak. ADX is around 19, which suggests the trend is not strong in either direction. Directional readings also favor sellers for now, with the minus directional indicator well above the plus indicator. Put simply, BTC is in a range-building or pullback phase, not yet a confirmed uptrend.
Key support levels to watch are 76,300 to 76,400 as the first line, where recent wicks have been bought; 75,000 to 75,650, the September 15 low and close area and a stronger demand zone; and 74,500 to 74,000, where the 120-day and 200-day averages sit. A daily close below 74,000 would weaken the bullish case considerably and open room toward the low 73,000s.
Key resistance levels are 78,000 to 78,400, which includes the 7-day EMA and the November 1 high, and this is the first real test for bulls; 78,860 to 79,000, the November 2 high, where sellers have been active; 80,600 to 80,800, which combines the 30-day EMA and the Bollinger middle band and is the key level for trend change; and 81,300 to 82,000, the late October breakdown zone. Above that, 84,900 is the October swing high.
On the 1-day chart, the pattern is a lower-high sequence inside a broader range between roughly 76,000 and 87,000. A breakout above 78,400 with a daily close, followed by a reclaim of 80,600, would be the first real sign that buyers are taking control. Until then, the chart favors range trading.
On the 3-day view, which is built from the same daily data, the structure is still a rebound inside a larger correction. For the trend to be called up on a 3-day basis, price needs to close above roughly 80,600 and hold above 78,000 on pullbacks. A failure to reclaim 80,600 keeps the range intact, and a loss of 76,000 would shift the 3-day structure back toward a deeper test.
Here is a possible trading framework, not a recommendation. For a conservative long, the entry zone is 76,400 to 76,900, only after the price holds the support rather than chasing a green candle. Stop loss 1 (SL1) is 75,900, just below the 76,000 floor. Stop loss 2 (SL2) is 75,000, below the September low zone. Stop loss 3 (SL3) is 74,300, below the 120-day average, which would signal the broader structure has failed. Take profit 1 (TP1) is 78,400, where the 7-day EMA and prior resistance meet. Take profit 2 (TP2) is 80,600, the main trend-change level. Take profit 3 (TP3) is 82,000, the area of the late October breakdown.
Position sizing matters more than the exact entry. Risking no more than 1 to 2 percent of trading capital per idea, and scaling out at TP1 to reduce exposure, keeps a single wrong call from doing lasting damage. Avoid buying into resistance near 78,000 to 78,400 without confirmation, and avoid adding to a losing long below 76,000.
On timing, a realistic timeframe for the bullish case to play out is a few weeks rather than days. If price holds 76,000 and reclaims 78,400 with volume in the next several sessions, the market could move toward 80,600 within one to three weeks. If that does not happen, the range can persist longer and the best trades remain short-term.
The bearish scenario is simple to define. A daily close below 76,000 with rising volume would invalidate the base and open the path toward 75,000 and then 74,000. In that case, waiting for a retest of lower resistance before taking any new long is the safer approach.
$BTC
BTC Market Analysis: Holding the 76K Floor, Waiting for Confirmation Above 78.4K
Bitcoin is trading around 77,500 USDT on Gate spot, up roughly 0.9% from the previous daily close of 76,806.6, with today's intraday range between 76,387 and 77,894. The bigger picture is still cautious. Since early October, BTC has been making lower highs, moving from the 87,200 area on October 2 to 84,900 in late October, then 81,965 on October 29, and finally 78,860 on November 2. Price has been rejected at each of those levels. The 76,000 to 76,400 zone has held several times, including the October 30 low at 76,283 and today's low near 76,387, so the market is building a base, but it has not yet shown a clear trend reversal.
The daily indicators reflect that mixed picture. RSI sits near 35, which is close to oversold but does not signal a bottom by itself. MACD remains negative, and the short-term moving averages are stacked against the price: the 7-day EMA is around 78,370 and the 30-day EMA around 80,600, both above current price. The 200-day moving average near 73,200 and the 120-day near 74,500 are well below, which means the long-term structure is still intact even though the short-term momentum is weak. ADX is around 19, which suggests the trend is not strong in either direction. Directional readings also favor sellers for now, with the minus directional indicator well above the plus indicator. Put simply, BTC is in a range-building or pullback phase, not yet a confirmed uptrend.
Key support levels to watch are 76,300 to 76,400 as the first line, where recent wicks have been bought; 75,000 to 75,650, the September 15 low and close area and a stronger demand zone; and 74,500 to 74,000, where the 120-day and 200-day averages sit. A daily close below 74,000 would weaken the bullish case considerably and open room toward the low 73,000s.
Key resistance levels are 78,000 to 78,400, which includes the 7-day EMA and the November 1 high, and this is the first real test for bulls; 78,860 to 79,000, the November 2 high, where sellers have been active; 80,600 to 80,800, which combines the 30-day EMA and the Bollinger middle band and is the key level for trend change; and 81,300 to 82,000, the late October breakdown zone. Above that, 84,900 is the October swing high.
On the 1-day chart, the pattern is a lower-high sequence inside a broader range between roughly 76,000 and 87,000. A breakout above 78,400 with a daily close, followed by a reclaim of 80,600, would be the first real sign that buyers are taking control. Until then, the chart favors range trading.
On the 3-day view, which is built from the same daily data, the structure is still a rebound inside a larger correction. For the trend to be called up on a 3-day basis, price needs to close above roughly 80,600 and hold above 78,000 on pullbacks. A failure to reclaim 80,600 keeps the range intact, and a loss of 76,000 would shift the 3-day structure back toward a deeper test.
Here is a possible trading framework, not a recommendation. For a conservative long, the entry zone is 76,400 to 76,900, only after the price holds the support rather than chasing a green candle. Stop loss 1 (SL1) is 75,900, just below the 76,000 floor. Stop loss 2 (SL2) is 75,000, below the September low zone. Stop loss 3 (SL3) is 74,300, below the 120-day average, which would signal the broader structure has failed. Take profit 1 (TP1) is 78,400, where the 7-day EMA and prior resistance meet. Take profit 2 (TP2) is 80,600, the main trend-change level. Take profit 3 (TP3) is 82,000, the area of the late October breakdown.
Position sizing matters more than the exact entry. Risking no more than 1 to 2 percent of trading capital per idea, and scaling out at TP1 to reduce exposure, keeps a single wrong call from doing lasting damage. Avoid buying into resistance near 78,000 to 78,400 without confirmation, and avoid adding to a losing long below 76,000.
On timing, a realistic timeframe for the bullish case to play out is a few weeks rather than days. If price holds 76,000 and reclaims 78,400 with volume in the next several sessions, the market could move toward 80,600 within one to three weeks. If that does not happen, the range can persist longer and the best trades remain short-term.
The bearish scenario is simple to define. A daily close below 76,000 with rising volume would invalidate the base and open the path toward 75,000 and then 74,000. In that case, waiting for a retest of lower resistance before taking any new long is the safer approach.
$BTC