Square
Following
Hot
News
Notifications
Profile
Share your thoughts
placeholder
Article
#USStocksFaceHistoricSelloff

Hunting for a Reversal in the SOXL Crash .

$SOXL

soxl

SOXL

CFD

40.93

-38.19%

‌

The chart tells a dramatic story. SOXL, a 3x leveraged semiconductor ETF, has experienced a catastrophic drop, plummeting -38.19% to trade at $40.93. The price has sliced through the Bollinger Bands and moving averages like a hot knife through butter, driven by headline fears (as noted: "AI buildout fears hit chip stocks").

When an asset falls this violently, panic selling is common. However, for the technical trader, a massive sell-off often sets the stage for a sharp
SOXL-38.25%
# Why Might a Once-Effective Strategy Gradually Stop Working?

If a trading strategy has consistently delivered profits in the past, why might it start losing frequently months later, or even after a longer period?

Has the market changed, or is there a problem with the strategy itself?

In the digital asset market, this question is especially worth considering. Market participants, liquidity, volatility structure, and trading behavior can all change. Opportunities that could be captured in the past may not remain available forever.

**The fact that a strategy once worked only shows that it pe
post-image
Trenches
BTC
B
bade
b
BTC
C5xp...pump
Market Cap
$.
Change
.
24h Vol
$.
Holders
.
ZIG
Z
bade
b
ZIG
0x8c...1145
Market Cap
$.
Change
.
24h Vol
$.
Holders
.
STONK
S
bade
b
STONK
6GmA...UNgx
Market Cap
$.
Change
.
24h Vol
$.
Holders
.
GM
G
bade
b
GM
0x13...7777
Market Cap
$.
Change
.
24h Vol
$.
Holders
.
DESSA
D
bade
b
DESSA
npz2...pump
Market Cap
$.
Change
.
24h Vol
$.
Holders
.
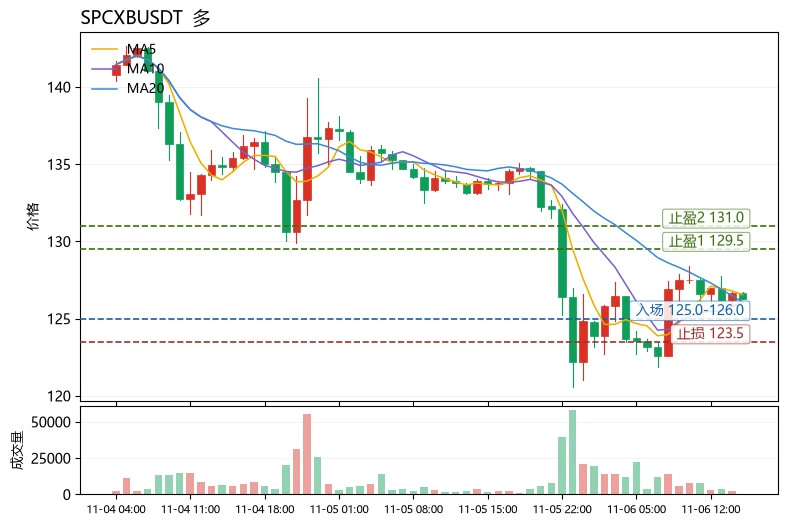
$SPCXB The most unusual detail today is not the drop, but the moving-average structure: the price fell 5.77% in 24 hours, yet MA5 remains above MA20 (126.554 versus 126.081), and the MACD histogram is still positive at +0.4746. This indicates the decline is taking place within a bullish alignment, making it a pullback rather than a trend breakdown—an ideal example for illustrating a reusable method: to judge whether a trend is healthy, first check the relative positions of the moving averages, then see whether momentum indicators are diverging, and finally use the Bollinger Bands to locate the
post-image
SPCXB
SPCXBSpaceX
Four.meme
MC:$3.12KHolders:2
0%
WLFI-0.16%
ETF outflows of $430 million in a single day are more worth watching than the price itself. U.S. spot Bitcoin ETFs saw net outflows of $430.2 million in one day, while Ethereum ETFs lost $99.97 million over the same period, nearly $100 million. More than $400 million in withdrawals in a single day is no small amount for any thematic ETF, especially when it comes from spot Bitcoin ETFs, which makes the signal even more significant. Coincidentally, the Nasdaq fell 5.52% that same day. Tech stocks broke down first, and crypto followed with outflows. A 5.52% single-day drop is among the steeper pu
post-image
BTC-5.05%
ETH-7.19%
NAS100+1.91%
  • 9
  • 2
#USStocksFaceHistoricSelloff
The daily chart reveals a classic "V-shaped" recovery following a significant capitulation.
$XAUT ‌

Macro Analysis: XAUT/USDT (1D Chart)

Current Market Sentiment: Aggressive Bullish Reversal (Macro), Short-Term Consolidation

While the 1-hour chart showed immediate bearish pressure, the 1-Day chart tells a completely different story. After a prolonged downtrend from the September highs of 4,366.3, the price found a hard floor at 3,872.5 and staged a massive, aggressive bounce.

🔶️Technical Observations (Daily):

1. Moving Averages: The price has aggressively
XAUT+0.30%
  • 5
Judge the chart pattern for yourself. Anyway, if it stays sideways there for a while, I’d suggest going long at a slightly lower level and setting a tight stop-loss; a move up is still possible
  • 3
  • 1
One long, one short—facts prove that accurate judgment is the only truth.
post-image
I. The takeaway first
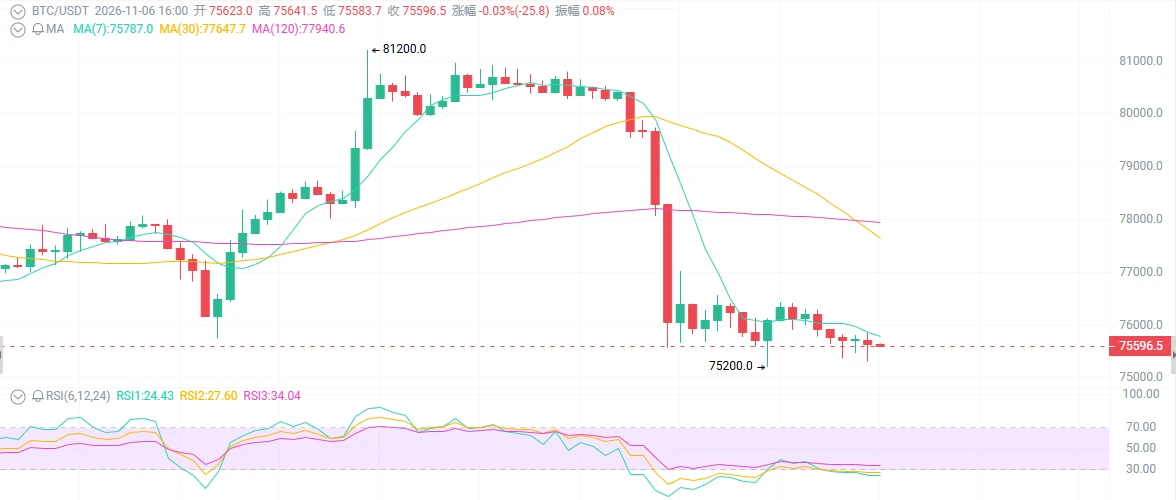
BTC had just moved above 80000 yesterday, but today it was pushed back down near 75000; ETH also fell all the way from 2450 to around 2200.
This is not an ordinary minor pullback, but a sudden reversal in market risk sentiment. The most dangerous move right now is to rush in and buy the dip just because prices have fallen a lot.
As of publication, BTC was around 75600, with a 24-hour high of 80790 and low of 75200, down more than 6%; ETH was around 2225, with a high of 2434 and low of 2206, down more than 8%.
The structure has turned weak again, but after consecutive decl
post-image
ETH-1.26%
BTC-0.67%
[ NEW STREAMER ] MARKET POSITION
live-cover
LIVE1,716
TODAY UPDATE
live-cover
LIVE1,502
Bitcoin at $75,600—can you sleep tonight?
Over $1 billion in liquidations in 24 hours, all longs. U.S. stocks crashed 5%, and BTC plunged 6% along with them, dropping straight from 81k to 75.6k. The Fear and Greed Index fell to 28, and the groups are full of “It’s over, it’s over.” But just now, the price held firm at 75k—is this the final drop, or the gateway to the abyss?

First, the surface picture: blood in the streets, but someone’s picking up chips in the basement.

The Nasdaq fell 5.5%, the S&P 500 fell 4.4%; AI valuations are getting hammered, tech spending is under scrutiny, and the D
post-image
BTC-0.67%
ETH-1.26%
SOL-0.77%
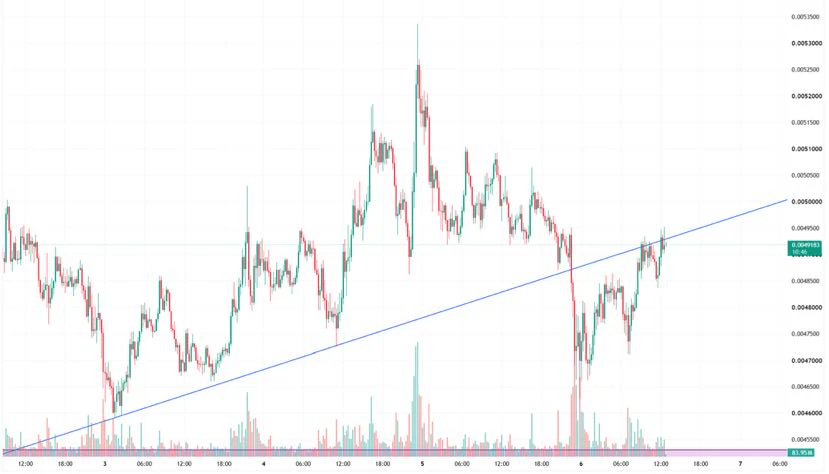
Last night, global risk assets plunged across the board, and $PEPE 's performance actually surprised me😯
BTC fell more than 6% over the past 24 hours, while PEPE was down only about 1.8% over the same period
It briefly dipped to around 0.00000463 intraday, then quickly recovered most of its losses and climbed back above 0.0000049
This is worth paying attention to👀
In theory, a sentiment-driven meme like PEPE should face greater selling pressure when global markets are gripped by fear; but this time, its relative performance was clearly stronger than BTC's, which at least shows that short-ter
post-image
PEPE+1.05%
  • 5
  • 2
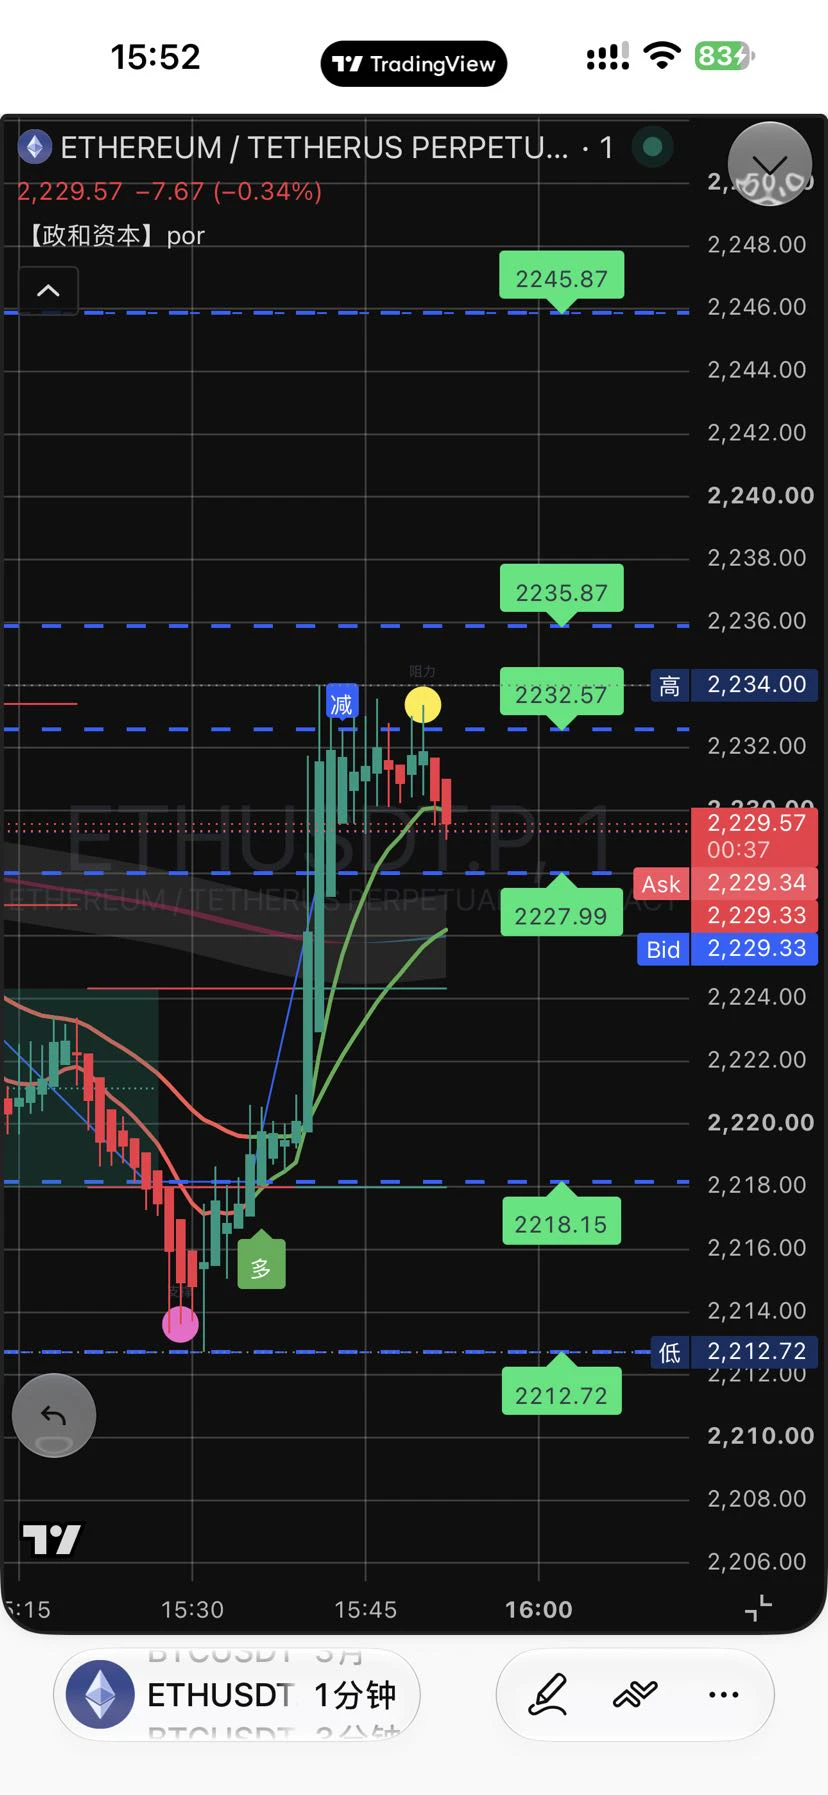
November 6, 2026 (Friday) ETH Futures Strategy for Today (based on the current range of approximately $2,220–$2,230)
Core view (bearish; cautious about rebounds)
ETH has quickly pulled back from around $2,420 to around $2,220, breaking recent support, with weak short-term momentum. Today, prioritize looking for a short if a rebound stalls, or consider going long only after a retest of lower support. Keep positions light.
Specific strategies
1. Shorting a rebound (primary strategy)
• Watch zone: $2,270–$2,320 (or near $2,350)
• Entry reference: Consider a small short if signs of stalling emer
post-image
ETH-1.23%
The sweeping MAGA movement is over
(2016-2026)
The AI bubble was a movement wrongly launched by Trump and exploited by Huang, Da, Ao, and Ma. Lacking experience in building artificial general intelligence and eager for quick results, they exaggerated the role of subjective will and Scaling Law, and failed to conduct serious commercial validation. This allowed right-wing adventurism, characterized by inflated valuations, reckless command-giving, and grandstanding, to run rampant in Silicon Valley.
#Trump #TrumpOut
post-image
🤖 After AI tech stocks plunged, will the next wave of opportunity be in applications?

U.S. stocks saw a sharp correction overnight, with chip, server, and data center stocks all under pressure. AI’s high valuations are once again being put to the test.

But the AI story isn’t over. The market’s focus is shifting:

From “who is investing the most in computing power” to “who can actually make money with AI.”

🔍 Google: Can AI search and advertising generate more revenue?

☁️ Microsoft, Amazon: Can cloud computing and AI services continue to deliver growth?

🚀 Meta, Palantir, Oracle: Ca
post-image
GOOGL-2.22%
MSFT-3.65%
AMZN-2.11%
PLTR-9.79%
ORCL-7.02%
You can go from a $20 portfolio to $2k in minutes.
That's the beauty of trading meme coins.
post-image
MEME-0.94%
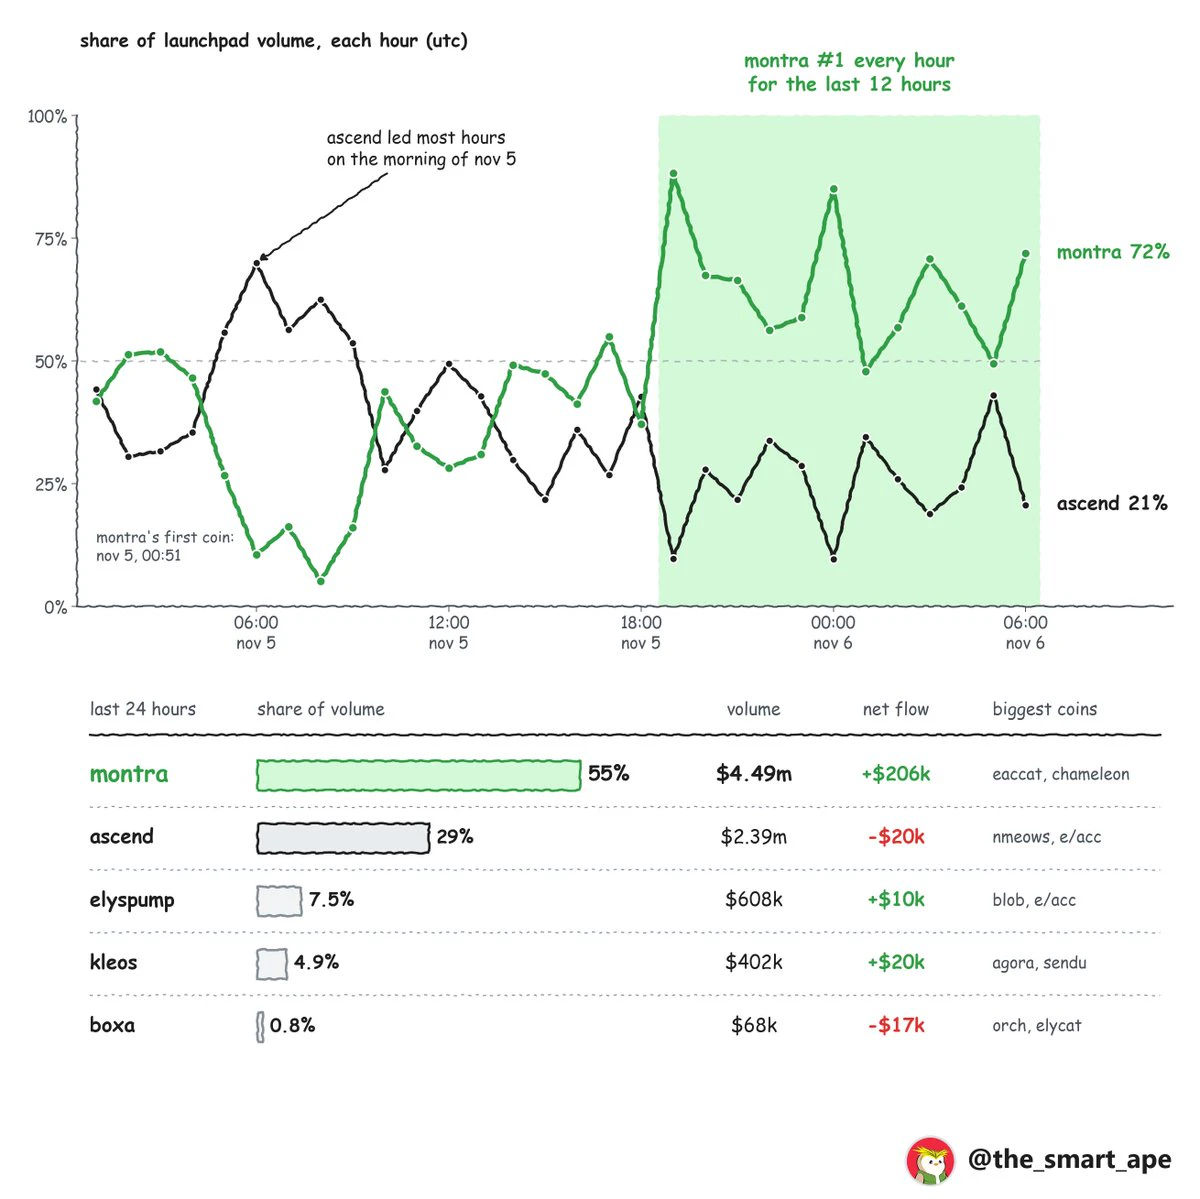
the @Enter_Elysium launchpad war has a clear winner. and it’s not @AscendLaunch.
@MontraXYZ launched its first coin 30 hours ago. in the last 24 hours it did 55% of all launchpad volume on elysium.
last 24h, platform tokens excluded:
> montra: $4.49m. 55%
> ascend: $2.39m. 29%
> elyspump: $608k. 7.5%
> @TheKleos_: $402k. 4.9%
> @Boxa_Elysium: $68k. 0.8%
montra has done the most volume every single hour for the last 12 hours.
and it’s not one coin carrying it. take out its biggest coin, $eaccat, and montra still did about $3m. more than ascend did in total.
the money is moving in the same direc
post-image
Market update;
Tonight’s nonfarm payrolls (U.S. October nonfarm employment + unemployment rate): released at 21:30 Beijing time
It’s standard time, so remember this time.
Key related data:
- At 21:30, nonfarm payrolls, the unemployment rate, and average hourly earnings are all released (all three affect Fed expectations, and volatility in BTC and ETH will intensify)
- At 23:00, the preliminary University of Michigan Consumer Sentiment Index is released, a secondary market-moving data point
Note: Sharp wicks and repeated stop-loss sweeps are very common around nonfarm payrolls. If trading lever
post-image
BTC-0.65%
ETH-1.23%
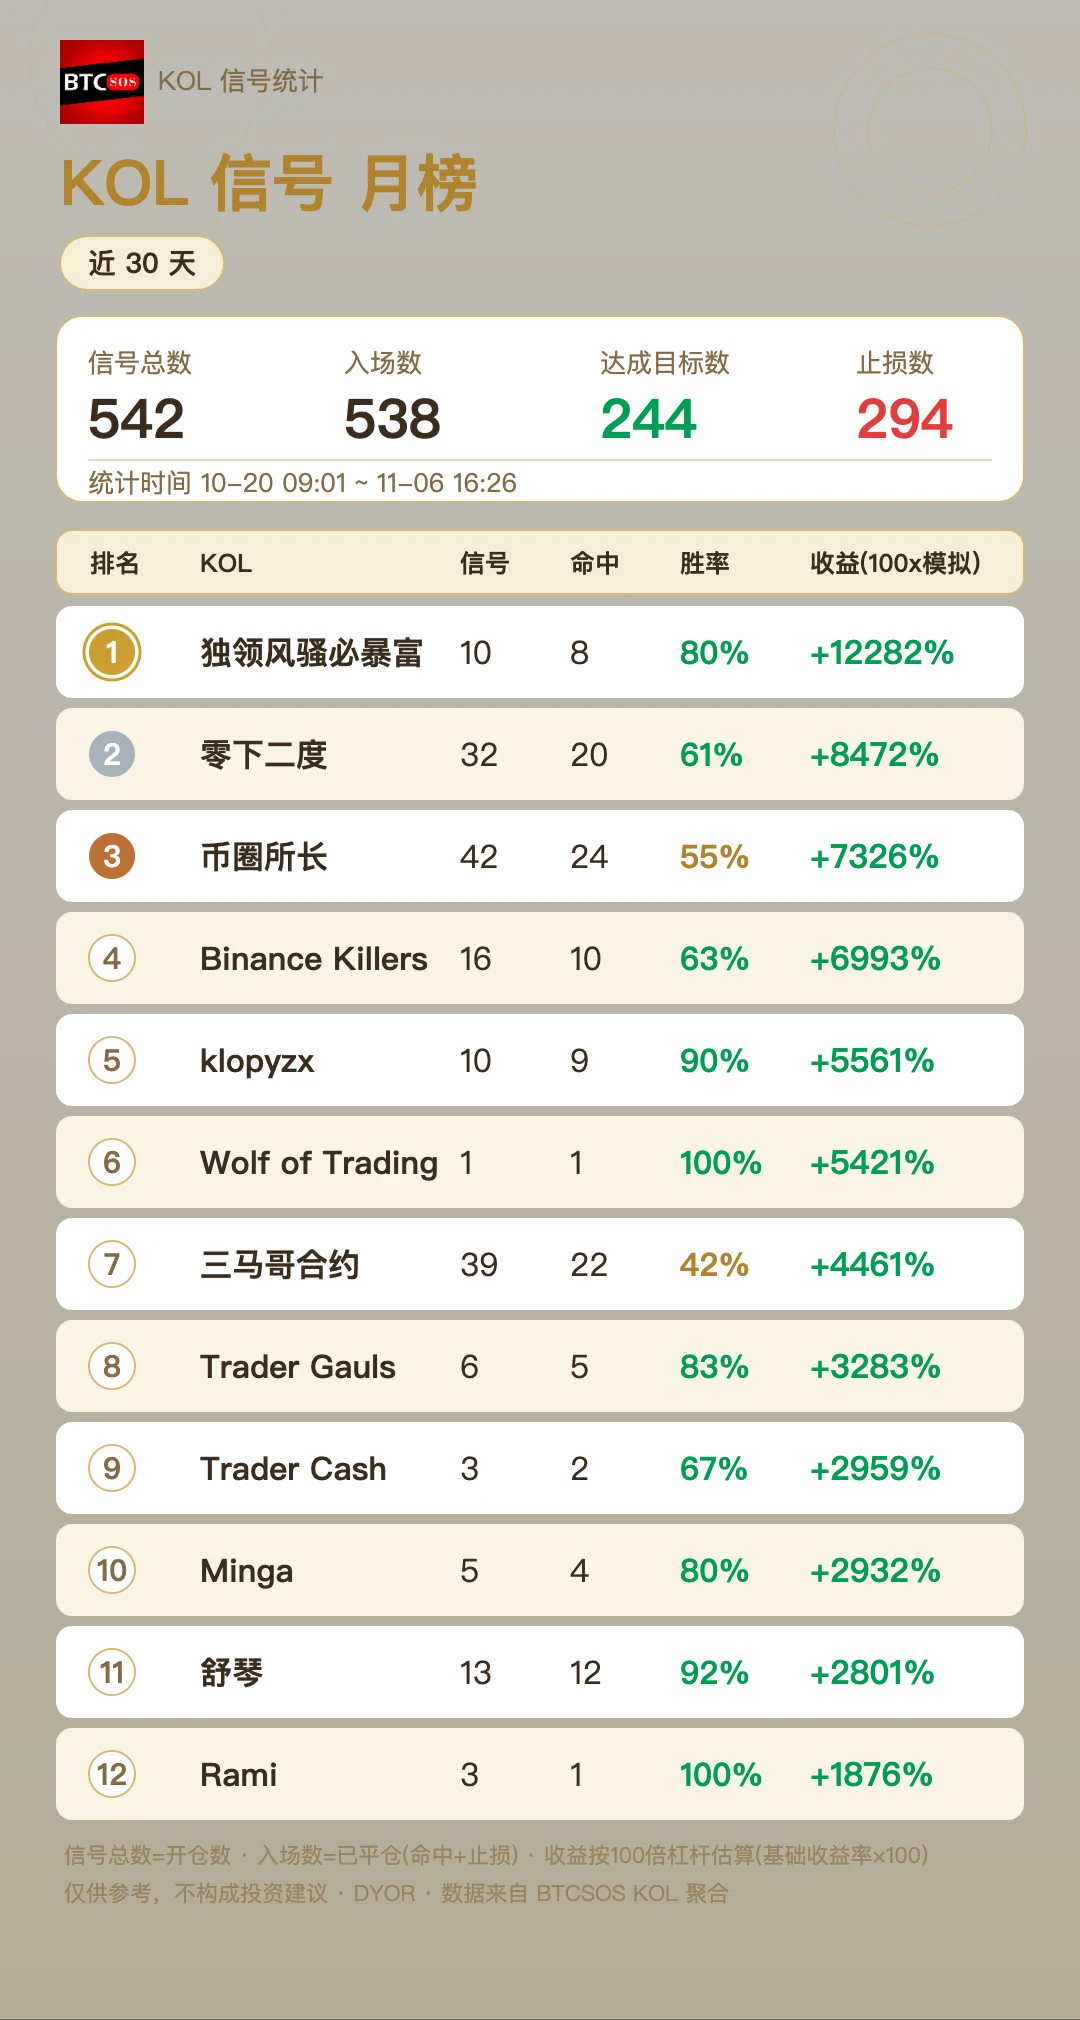
KOL leaderboard for the past 30 days (simulated returns based on 100x capital): 542 signals, 538 settled, 244 wins, 294 stop-losses—an overall win rate below 50%. That’s the reality of the battlefield.
Top-ranked “Stand Out and Get Rich” scored an 80% win rate across 10 trades, with simulated returns of +12282%; klopyzx went 9 for 10, posting a 90% win rate to round out the Top 5 🫠
Note: Simulated results are not the same as live trading and are for reference only. See the image for the full leaderboard. Incidentally, last period’s (11-03) top-ranked trader was also “Stand Out and Get Rich” (
post-image
BTC-5.05%
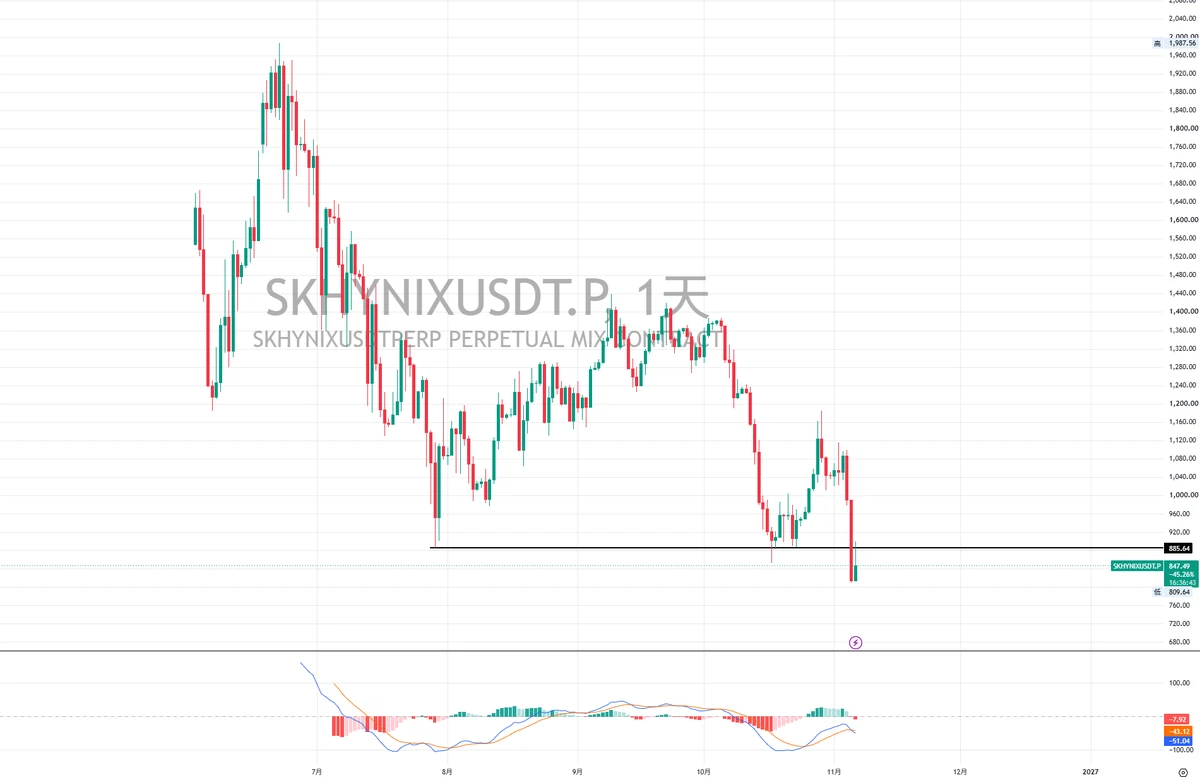
$SKHYNIX
SK Hynix SKHY
It’s also following the decline on shorter time frames, but for some reason I don’t feel like buying the dip on SK Hynix.
If you want to buy the dip, you could pick up some spot, too. It should basically move in sync with Micron and SanDisk. For now, the rebound target is $1,200!
post-image
SKHY-13.76%
SNDK-22.24%
Load More

Join 40 M users in our growing community

⚡️ Join 40 M users in the crypto craze discussion

💬 Engage with your favorite top creators

👍 See what interests you

Trending Topics

USStocksFaceHistoricSelloff

4.09k Views3.64k Discussing

U.S. stocks suffered a sharp selloff on Thursday, with the Nasdaq closing down more than 5% and the Philadelphia Semiconductor Index falling over 12%. AI and chip stocks including $NVDA and $AMD were hit especially hard. Markets are reassessing AI valuations, data-center spending and future returns. Is this just short-term deleveraging, or the start of a deeper correction in the AI trade? Which sectors are you watching next?

GateLaunchesPoSECProofOfSecurity

14.32k Views591 Discussing

USNonfarmPayrolls

12.42k Views4.05k Discussing

View More