Square
Following
Hot
News
Notifications
Profile
Share your thoughts
placeholder
Article
A brief analysis of BTC short-term trends from Dow Theory, Chan Theory, Elliott Wave Theory, volume-price relationships, order flow, and price action (strategy recommendations)
Comprehensive assessment
Dow Theory confirms that the break below 75,000 has accelerated the bearish trend + volume is contracting as the market consolidates
Chan Theory: Each stroke makes a new low; the 75,460 potential bottom fractal is unreliable due to low volume
Elliott Wave Theory: Subwave ③ of Wave C's fifth wave is nearly complete (74,791 is just 31 points above the 1.0× target); a subwave ④ rebound could begin
BTC-0.67%
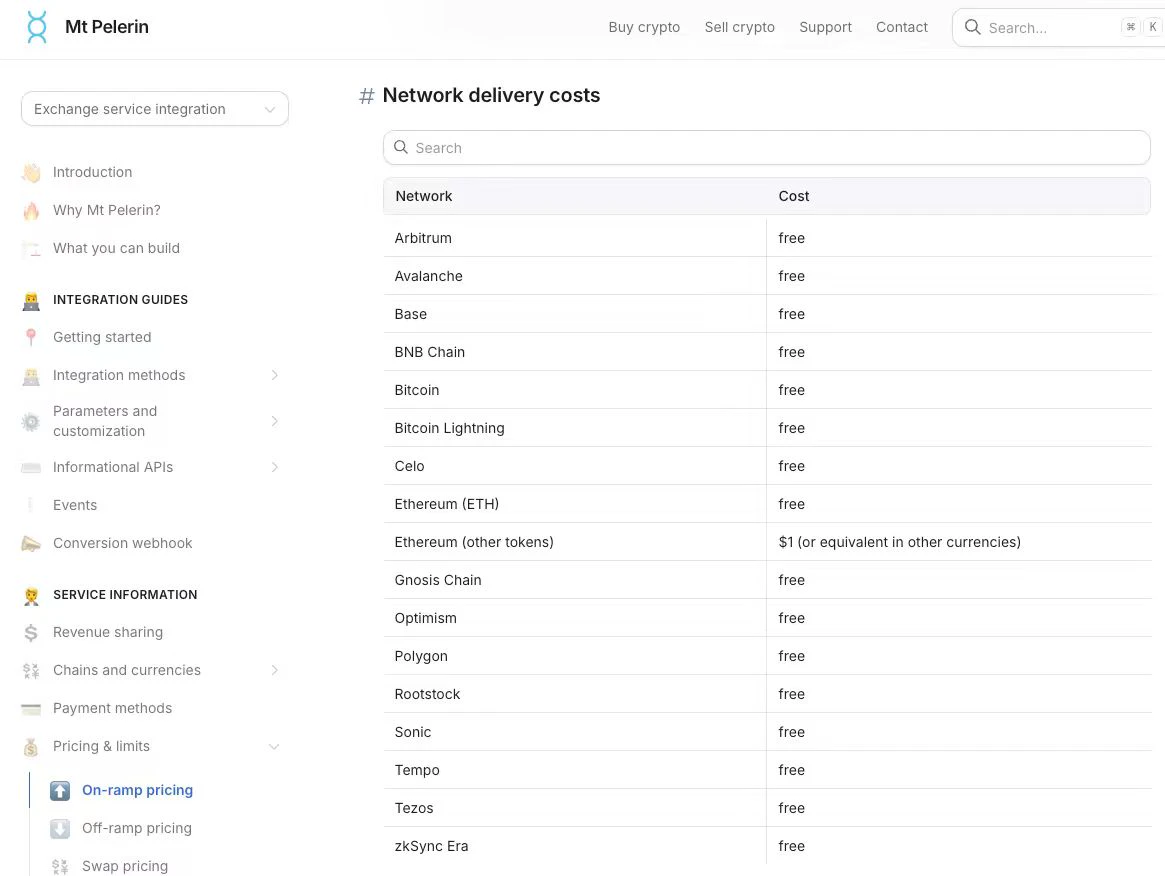
f(x) Protocol @protocol_fx's fxUSD can connect directly to bank accounts through Mt Pelerin, but completing an actual fiat on-ramp or off-ramp involves several separate steps.
When buying, users send fiat to Mt Pelerin via bank transfer or another method. Mt Pelerin converts it into fxUSD at the prevailing exchange rate, then sends it to the wallet specified by the user.
The official page says buying fxUSD by bank transfer has a 0% conversion fee, while the card FAQ lists a 2.5% fee. Selling works in reverse: users send fxUSD from their wallet to the service provider, which converts it to fiat
post-image
ETH-1.26%
BTC-0.67%
Trenches
ZIG
Z
bade
b
ZIG
0x8c...1145
Market Cap
$.
Change
.
24h Vol
$.
Holders
STONK
S
bade
b
STONK
6GmA...UNgx
Market Cap
$.
Change
.
24h Vol
$.
Holders
.
IDOL
I
bade
b
IDOL
0x3b...ab07
Market Cap
$.
Change
.
24h Vol
$.
Holders
.
BTC
B
bade
b
BTC
C5xp...pump
Market Cap
$.
Change
.
24h Vol
$.
Holders
.
FLOAT
F
bade
b
FLOAT
Bv1a...BMmr
Market Cap
$.
Change
.
24h Vol
$.
Holders
.
Support and resistance levels are among the most fundamental and practical concepts in technical analysis. Many traders study candlesticks and indicators every day, yet overlook an important question: at which price levels are buying and selling pressure likely to shift?
First, a support level is an area where buying pressure may increase as the price falls. When the price approaches this level, some buyers may start entering the market, slowing the decline. But a support level does not mean the price definitely won’t break below it.
Next, a resistance level is an area where selling pressure m
BTC-0.67%
$CLAUDIA One quote tweet pushed it back to a 7 million market cap, $JOSE and riding the same person's meme sent it soaring to 1.8 million. That's the entire logic of meme coins: money goes wherever the attention is. Don't ask why. Before the halving, while the market is trading sideways, we'll see even more of this kind of thing. Decide for yourself whether to follow along. What do you think? $BTC If you're watching, follow along.
post-image
MEME-0.94%
BTC-0.67%
#StakeOnLaunchpoolToShare450KVLX Yield Optimization Protocol: Allocating Capital to the 450,000 VLX Staking Pool

The structural mechanics of wealth preservation during periods of high macroeconomic volatility require a disciplined shift toward non-directional, cash-flow-generating asset classes. As global equity indices navigate intense valuation resets and data-center sector adjustments, maximizing the capital efficiency of idle digital assets becomes a primary operational mandate. Recognizing this need, the official deployment of the Velas (VLX) Launchpool initiative introduces a high-viabi
VLX+0.00%
  • 4
  • 1
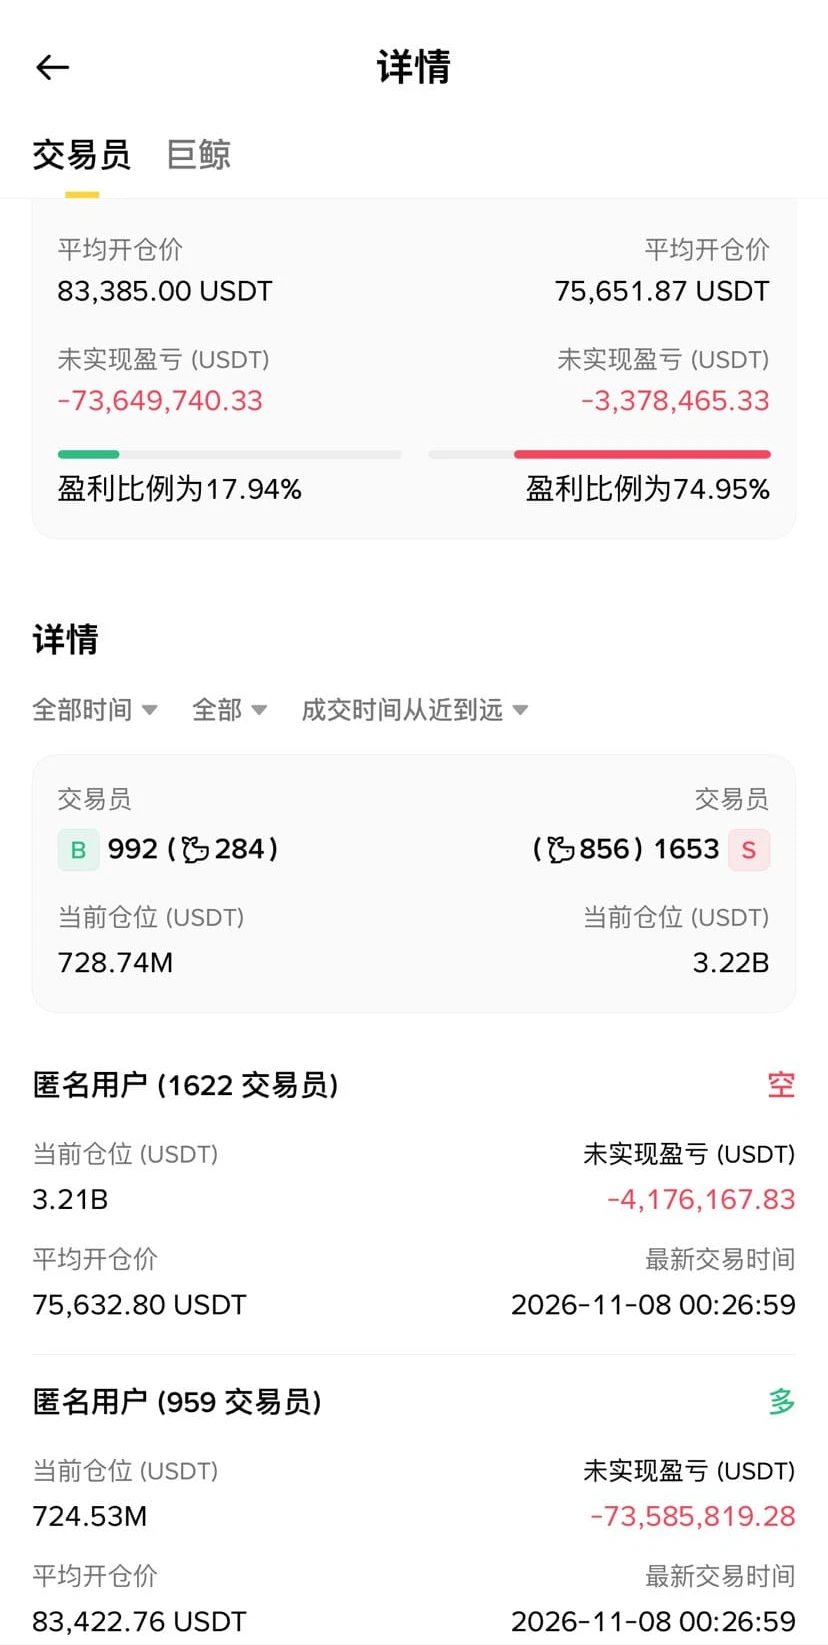
Who is it, which big shot opened a 3.2 billion Bitcoin short position? $BTC ‌#BTCETF资金持续流出 #Gate安全卫士免费开通 #BTC
post-image
BTC-0.65%
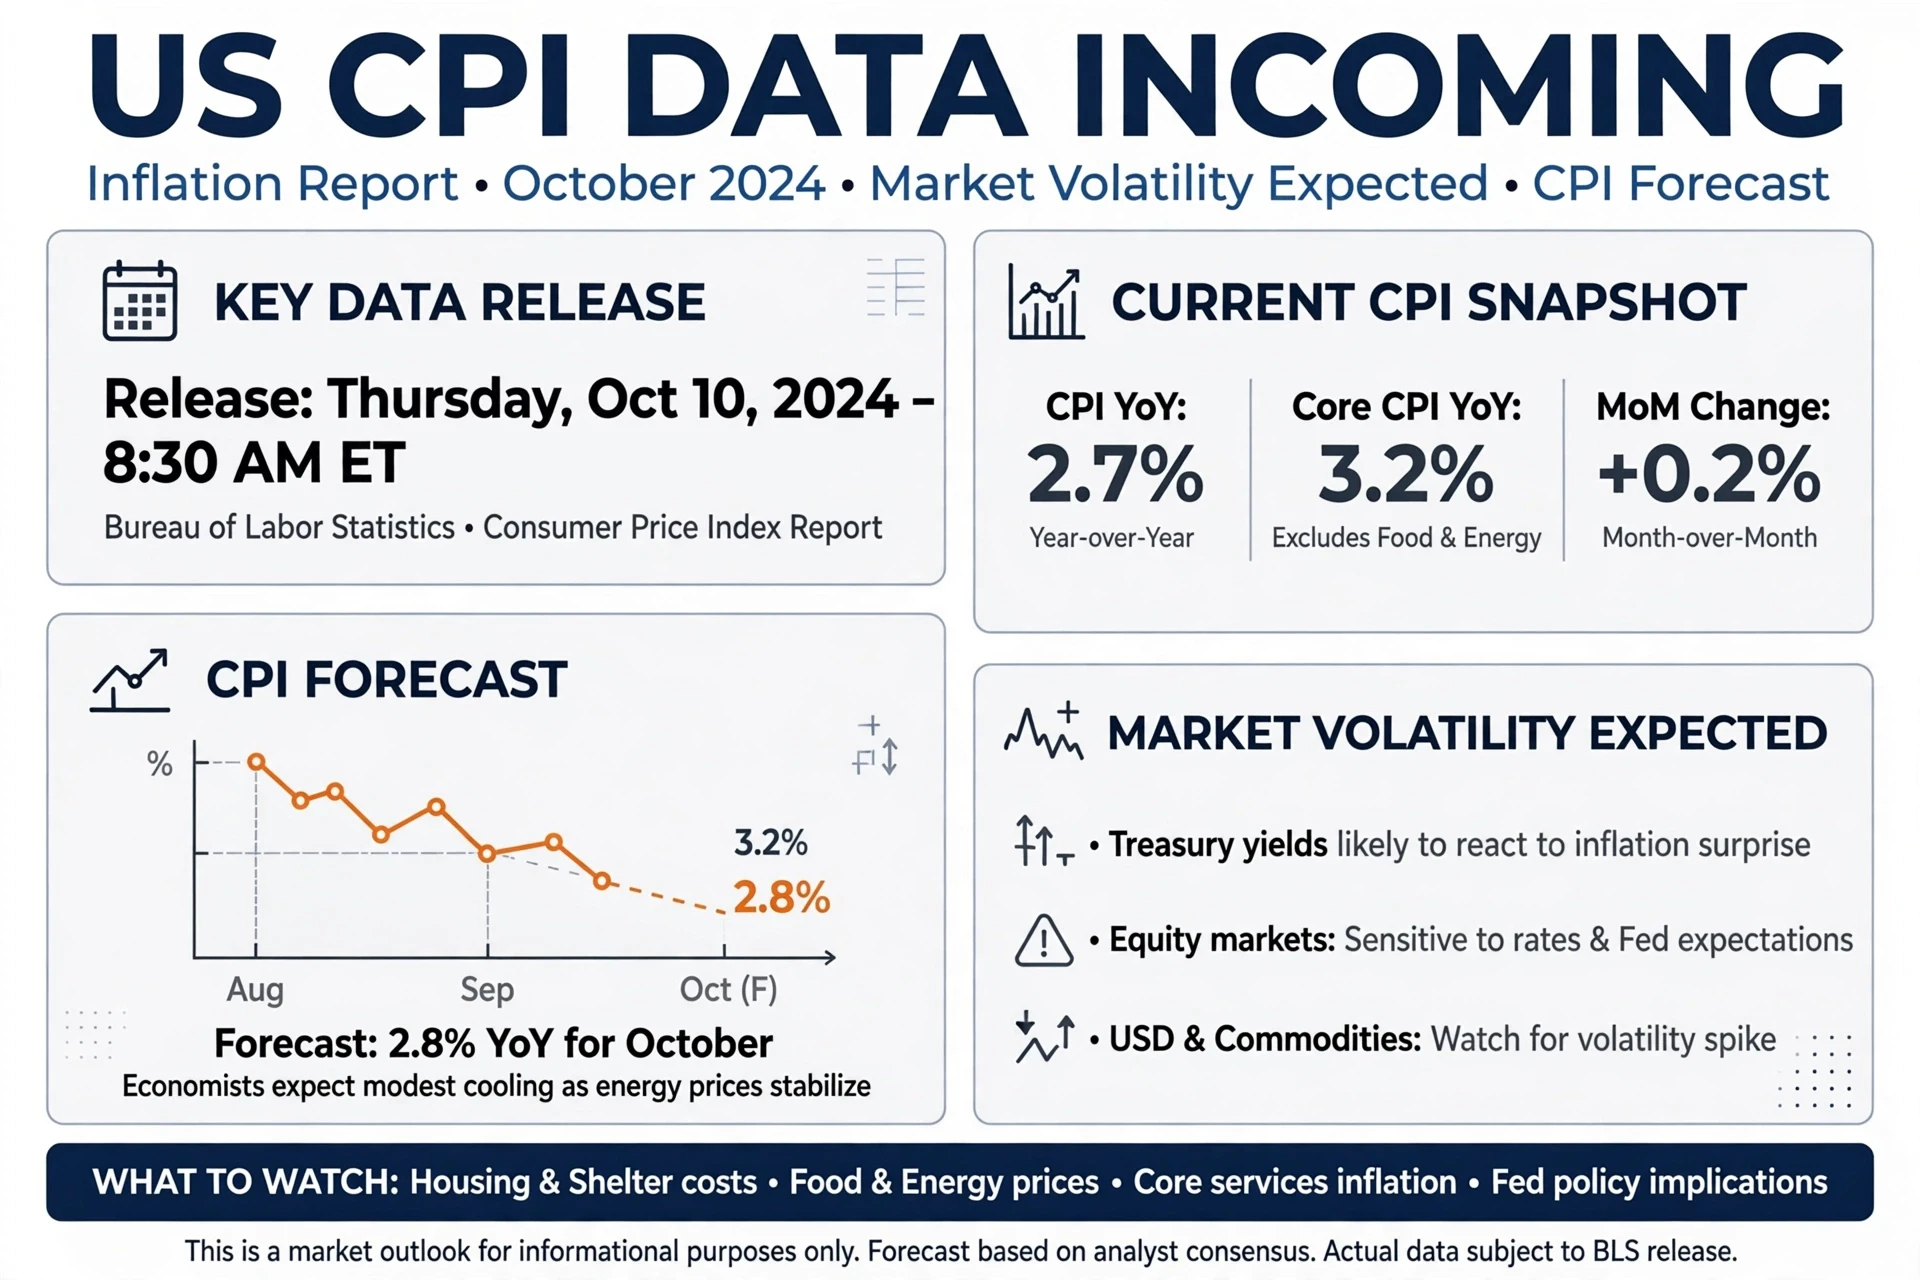
*#USCPIDataIncoming — Markets Brace for Key Inflation Report*

All eyes on inflation — *US CPI data drops Thursday, Oct 10, 8:30 AM ET.*

Current snapshot: Headline CPI YoY *2.7%*, Core CPI YoY *3.2%* (ex-food & energy), and MoM *+0.2%*. Forecast for October: *2.8% YoY*, as economists expect modest cooling with stabilizing energy prices.

Why it matters: CPI will directly impact Fed rate expectations, Treasury yields, and risk assets. A hotter-than-expected print could push yields higher and pressure equities, crypto, and USD. A cooler print may fuel rate-cut optimism.

Market volatility expec
post-image
SPX500+0.19%
BTC-0.67%
XAU+0.38%
Ten years of childhood sweethearts showing off their love.
A classmate dropped a major bombshell.
post-image
Sony China unveiled its in-vehicle passenger motion sickness detection technology globally at the 9th China International Import Expo: AI analyzes both the road ahead and content on rear-seat screens to predict passengers’ motion sickness levels, and can account for individual sensitivity. The assessment can prompt drivers to avoid sudden braking and sharp turns, and help content platforms recommend content with less visual movement. The system reuses the vehicle’s existing forward-facing ADAS camera, so no additional rear-seat camera is needed.

This isn’t about giving passengers medication;
post-image
SONY-1.99%
BTC-0.67%
The wick down to 0.0759 definitely swept the stop-loss orders. $UAI now looks more bullish, as highly leveraged shorts have been cleared out. Take profit: 0.0950 Stop loss: 0.0728 Hot names: $AIOT : Current price 0.11723 - 24-hour change: +14.65%$ETH : Current price 2,232.52 - 24-hour change: -0.64%
post-image
UAI-7.58%
AIOT-2.28%
  • 1
Six dead and 15 injured at Krakow’s Old Town Main Square; three bodies still lay in the killer’s home—the case is even more chilling than the shooting itself!
Poland’s Prime Minister’s Office counted the suspect among the injured, reporting 6 dead and 16 injured, which doesn’t match the Associated Press’s figure of 15 injured. Do we have to reconcile the casualty figures before we can get at the truth?
The first report came in at 15:00:15 on November 7. No one can say how long the gunfire lasted or when the first shot was fired; with so many people at Old Town Main Square, the response time is
post-image
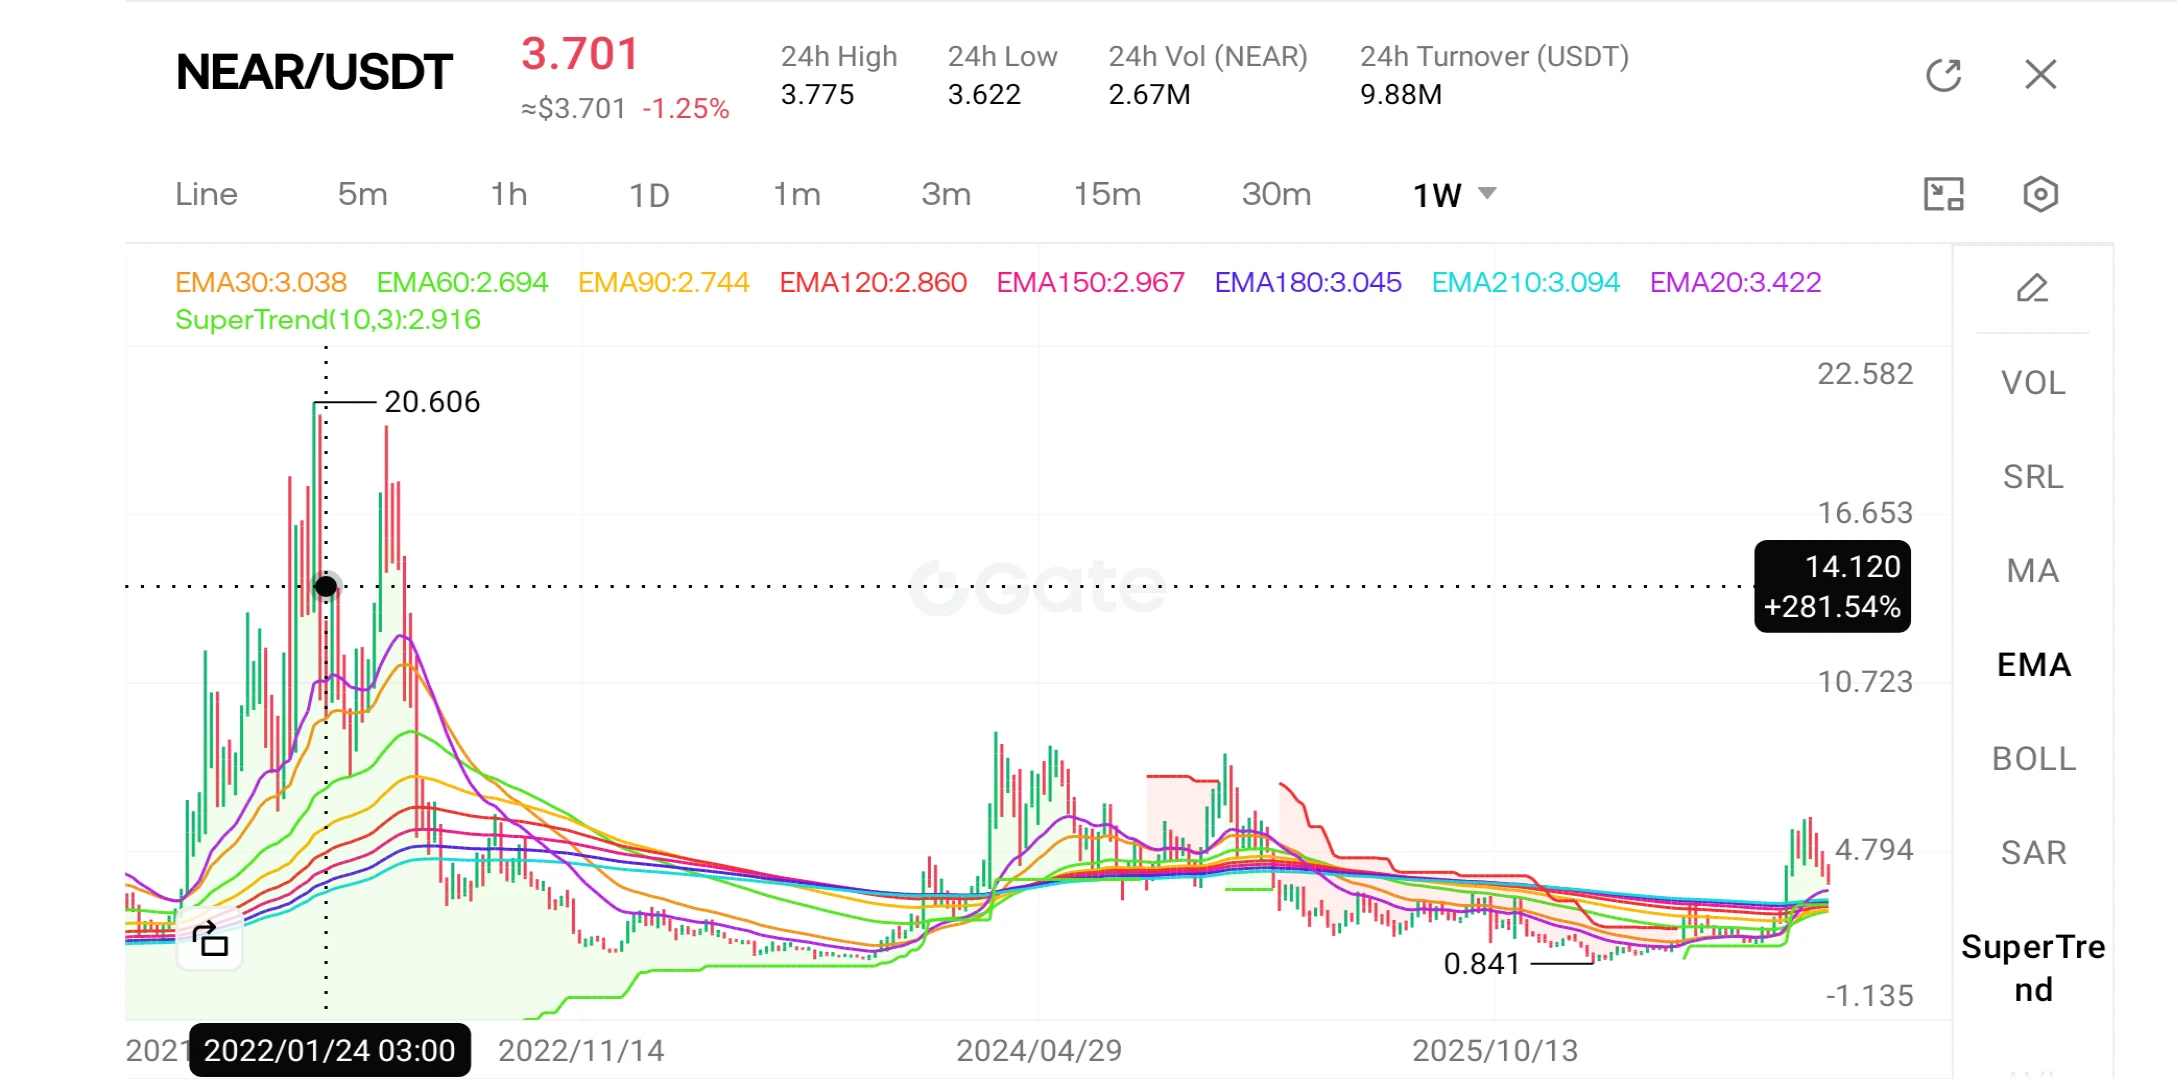
$NEAR 🔬

The native token of the NEAR Protocol is trading at approximately $3.65, having lost over 35% of its value since reaching a peak of $6 in early October. The price currently sits below its short- and medium-term moving averages but remains above its long-term moving average, with the $3.50–$3.60 range serving as a critical support level. Furthermore, it has been confirmed that the governance body has approved a proposal to gradually reduce the token supply, and new platforms focused on AI agents are being launched on the NEAR network.

What does this journey from peak to trough tell u
post-image
NEAR+1.17%
  • 2
  • 2
BTC, go long around the current price of 75,700, stop-loss at 74,800, target around 78,000. $BTC
post-image
BTC-0.67%
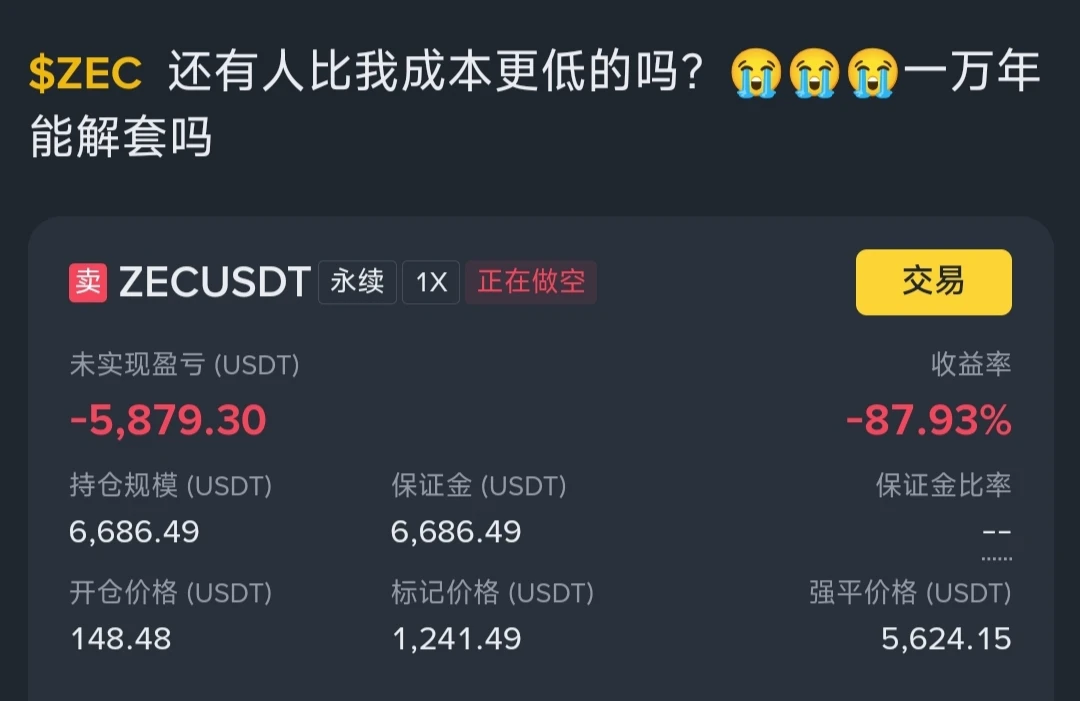
$ZEC The thing I find most curious about this coin is that no matter when you short it, you can always find someone who shorted at a lower price than you!#$ZEC ‌# ‌
post-image
ZEC+1.29%
  • 3
A brief analysis of BTC’s short-term trend through Dow Theory, Chan Theory, Elliott Wave Theory, volume-price relationships, order flow, and price action
The ultimate test at 74,791 is imminent! After the 80,838 bull-trap top #2 on November 5 (a historic sell-off of 4.716 billion/36 billion), the price broke below the psychological 75,000 level on November 6, dropping to 74,791 (a six-week low), before buyers stepped in with 988 million/2.32 billion, triggering a rebound to 76,278. On November 7, only 3.7 billion traded all day (+267 million Delta), with volume down to 10% of capitulation leve
BTC-0.67%
Epic Sell-Off in U.S. StocksTech stocks are facing a wave of heavy selling. Will this correction con
live-cover
LIVE2,149
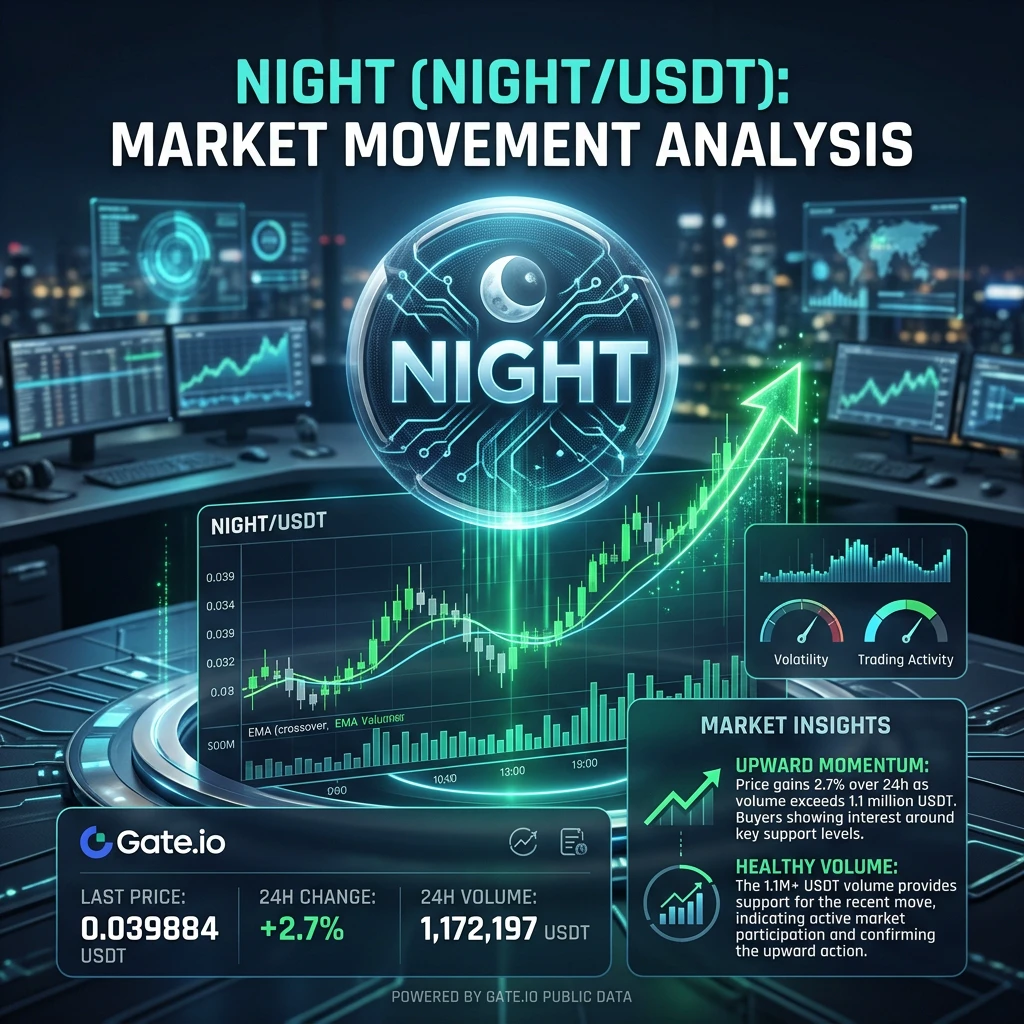
#NIGHT

NIGHT Edges Higher: A Beginner’s Guide to Its Price Movement and Midnight Network Developments

A Common Myth

A common mistake in crypto is thinking that whenever a coin rises, its project must be growing rapidly. Price movement alone cannot prove that. A market can move higher because of short-term buying interest, changing sentiment, new developments, or temporary trading activity. NIGHT’s latest movement is a useful example of why understanding the numbers matters more than simply watching the price.

The Latest Numbers

At 01:30 UTC on November 8, 2026, NIGHT/USDT was trading at
post-image
NIGHT-3.10%
  • 1
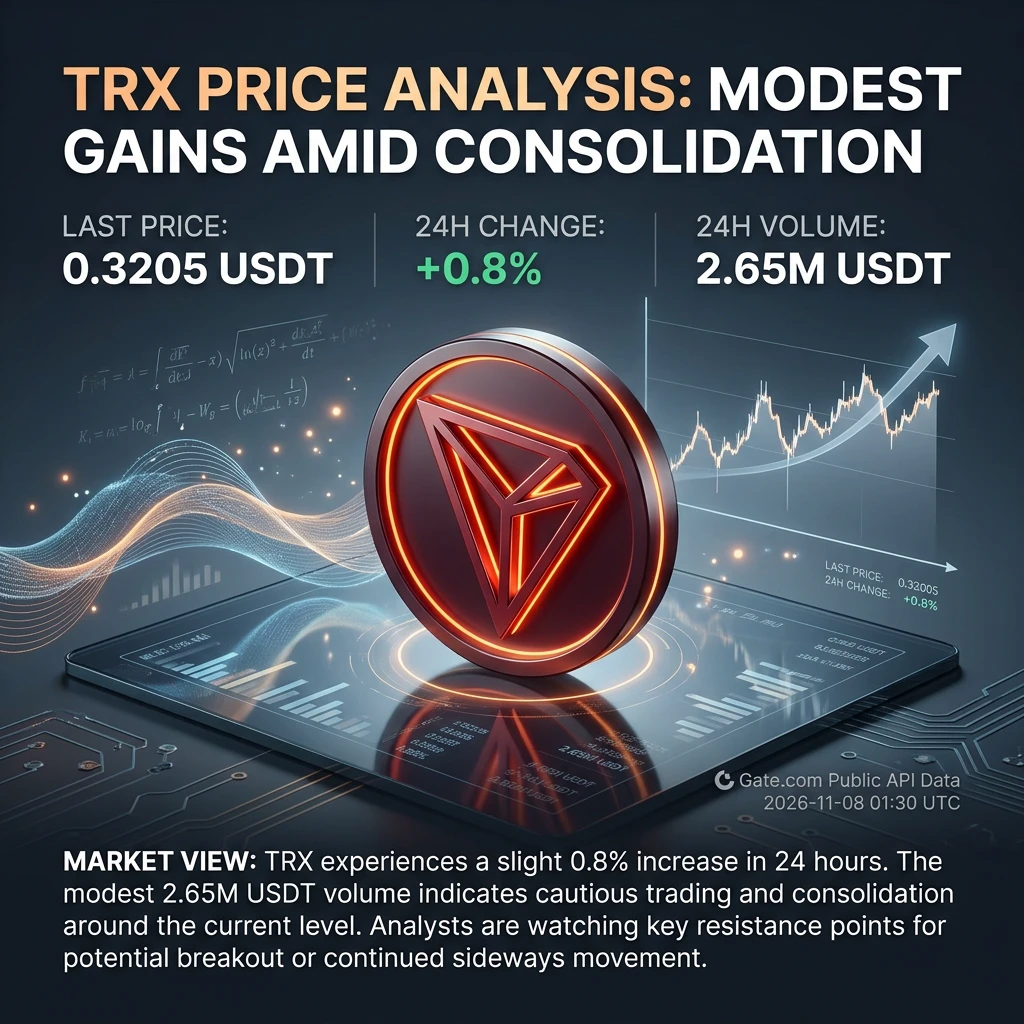
#TRX

TRX Holds Near $0.32: What Is Supporting the Price, and What Could Change the Picture?

A Small Move, but What Does It Tell Us?

Imagine checking your crypto portfolio in the morning and seeing TRX slightly higher than the previous day. The price has not made a dramatic jump, but it is moving in a positive direction. Is this the beginning of a stronger recovery, or simply a period of normal market movement?

As of November 8, 2026, at 01:30 UTC, TRX/USDT was trading at $0.3205, recording a 24-hour increase of 0.8%. Its 24-hour trading volume was approximately $2.65 million USDT.

This i
post-image
TRX+0.42%
BTC-0.67%
  • 1
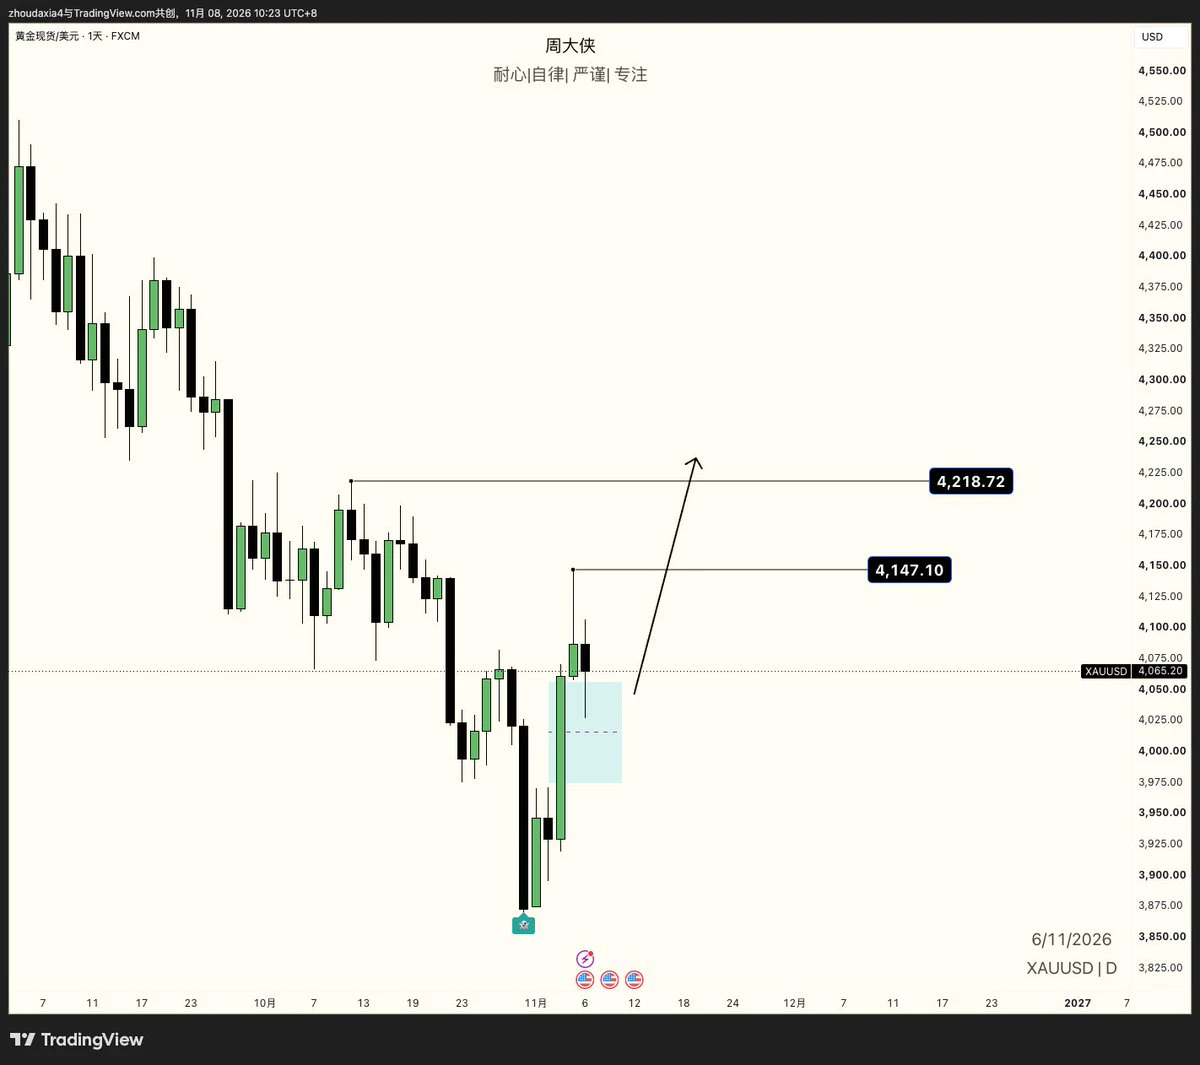
Gold daily chart bullish bias vs. weekly chart bearish bias. #XAU
post-image
GLDX-0.40%
PAXG+0.37%
XAU+0.38%
  • 1
🔹 Bitcoin Doesn’t Need Banks, but Strategy Wants to Become a Bitcoin Bank
live-cover
LIVE2,561
Load More

Join 40 M users in our growing community

⚡️ Join 40 M users in the crypto craze discussion

💬 Engage with your favorite top creators

👍 See what interests you

Trending Topics

USCPIDataIncoming

1.04k Views1.47k Discussing

The U.S. October CPI report will be released on November 10 at 8:30 a.m. ET. September CPI came in at 3.7% year over year, and markets will be watching closely for signs that inflation is cooling, especially in core CPI. A softer-than-expected reading could strengthen rate-cut expectations, while hotter inflation may pressure risk assets through higher Treasury yields and a stronger dollar. How do you think this CPI print will move $BTC, U.S. stocks and gold?

USAIStocksHitHard

23.56k Views3.69k Discussing

USNonfarmPayrolls

40.34k Views4.38k Discussing

View More