Square
Following
Hot
News
Notifications
Profile
Share your thoughts
placeholder
Article
People who get sent flying by cars often know that having to get up and delete their browser history before passing out every time is a hassle.

So we could write a script. Since Chrome stores browsing history locally in plain-text SQLite, we can use SQL to find and delete it directly.

Then we can set the script up as a scheduled system task.

But if you’re signed in to a Google account, I don’t know whether this method will sync automatically.
post-image
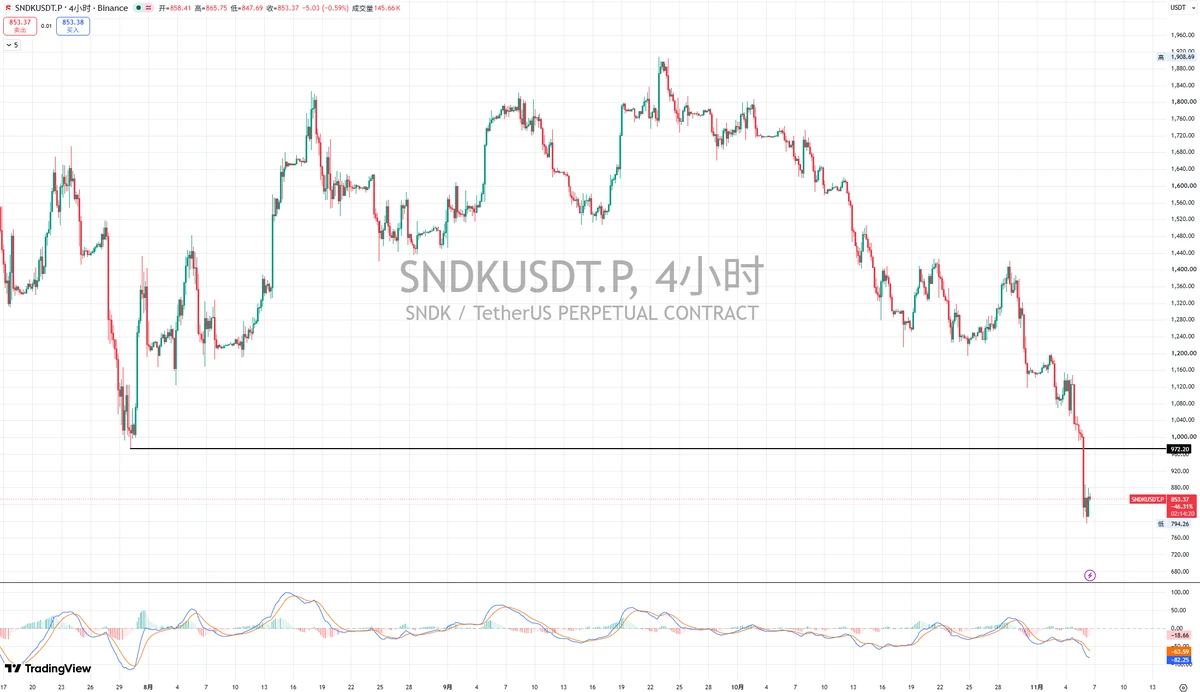
$SNDK
SanDisk SNDK
This sharp move lower has broken directly below the previous low. The difference this time is that the breakdown is valid, and there has been no recovery above that level, so this does not constitute a false breakdown.
The short-term level to watch is around 720. Watch how price reacts when it reaches that level!
post-image
SNDK-22.24%
Trenches
ZIG
Z
bade
b
ZIG
0x8c...1145
Market Cap
$.
Change
.
24h Vol
$.
Holders
.
BTC
B
bade
b
BTC
C5xp...pump
Market Cap
$.
Change
.
24h Vol
$.
Holders
.
STONK
S
bade
b
STONK
6GmA...UNgx
Market Cap
$.
Change
.
24h Vol
$.
Holders
.
DESSA
D
bade
b
DESSA
npz2...pump
Market Cap
$.
Change
.
24h Vol
$.
Holders
Diamond
D
bade
b
Diamond
5VCE...pump
Market Cap
$.
Change
.
24h Vol
$.
Holders
.
What Is Maximum Drawdown? Why Can a Profitable Long-Term Trading Strategy Still Experience Unbearable Consecutive Losses?

In cryptocurrency trading, some strategies may be profitable over the long term but experience significant losses along the way. If traders do not assess in advance how far their account could fall, they may be forced to exit before the strategy has a chance to recover. Maximum drawdown is an important metric for measuring this risk.

First, what is maximum drawdown?

Maximum drawdown (MDD) is the largest percentage decline in an account’s net asset value from a previous p
post-image
ETF outflows of $430 million in a single day are more worth watching than the price itself. U.S. spot Bitcoin ETFs saw net outflows of $430.2 million in one day, while Ethereum ETFs lost $99.97 million over the same period, nearly $100 million. More than $400 million in withdrawals in a single day is no small amount for any thematic ETF, especially when it comes from spot Bitcoin ETFs, which makes the signal even more significant. Coincidentally, the Nasdaq fell 5.52% that same day. Tech stocks broke down first, and crypto followed with outflows. A 5.52% single-day drop is among the steeper pu
post-image
BTC-5.05%
ETH-7.19%
NAS100+1.18%
  • 4
  • 1
Could one of the pros who likes writing tutorials teach me how to apply for a minor refund?
What I mean is:
Two weeks ago, my 2-year-old son used my phone to buy two BTC at a price of 8.2.
I only discovered it today when I opened my phone.
Could someone please tell me how to apply for a minor refund? 😭😭😭
post-image
BTC-0.67%
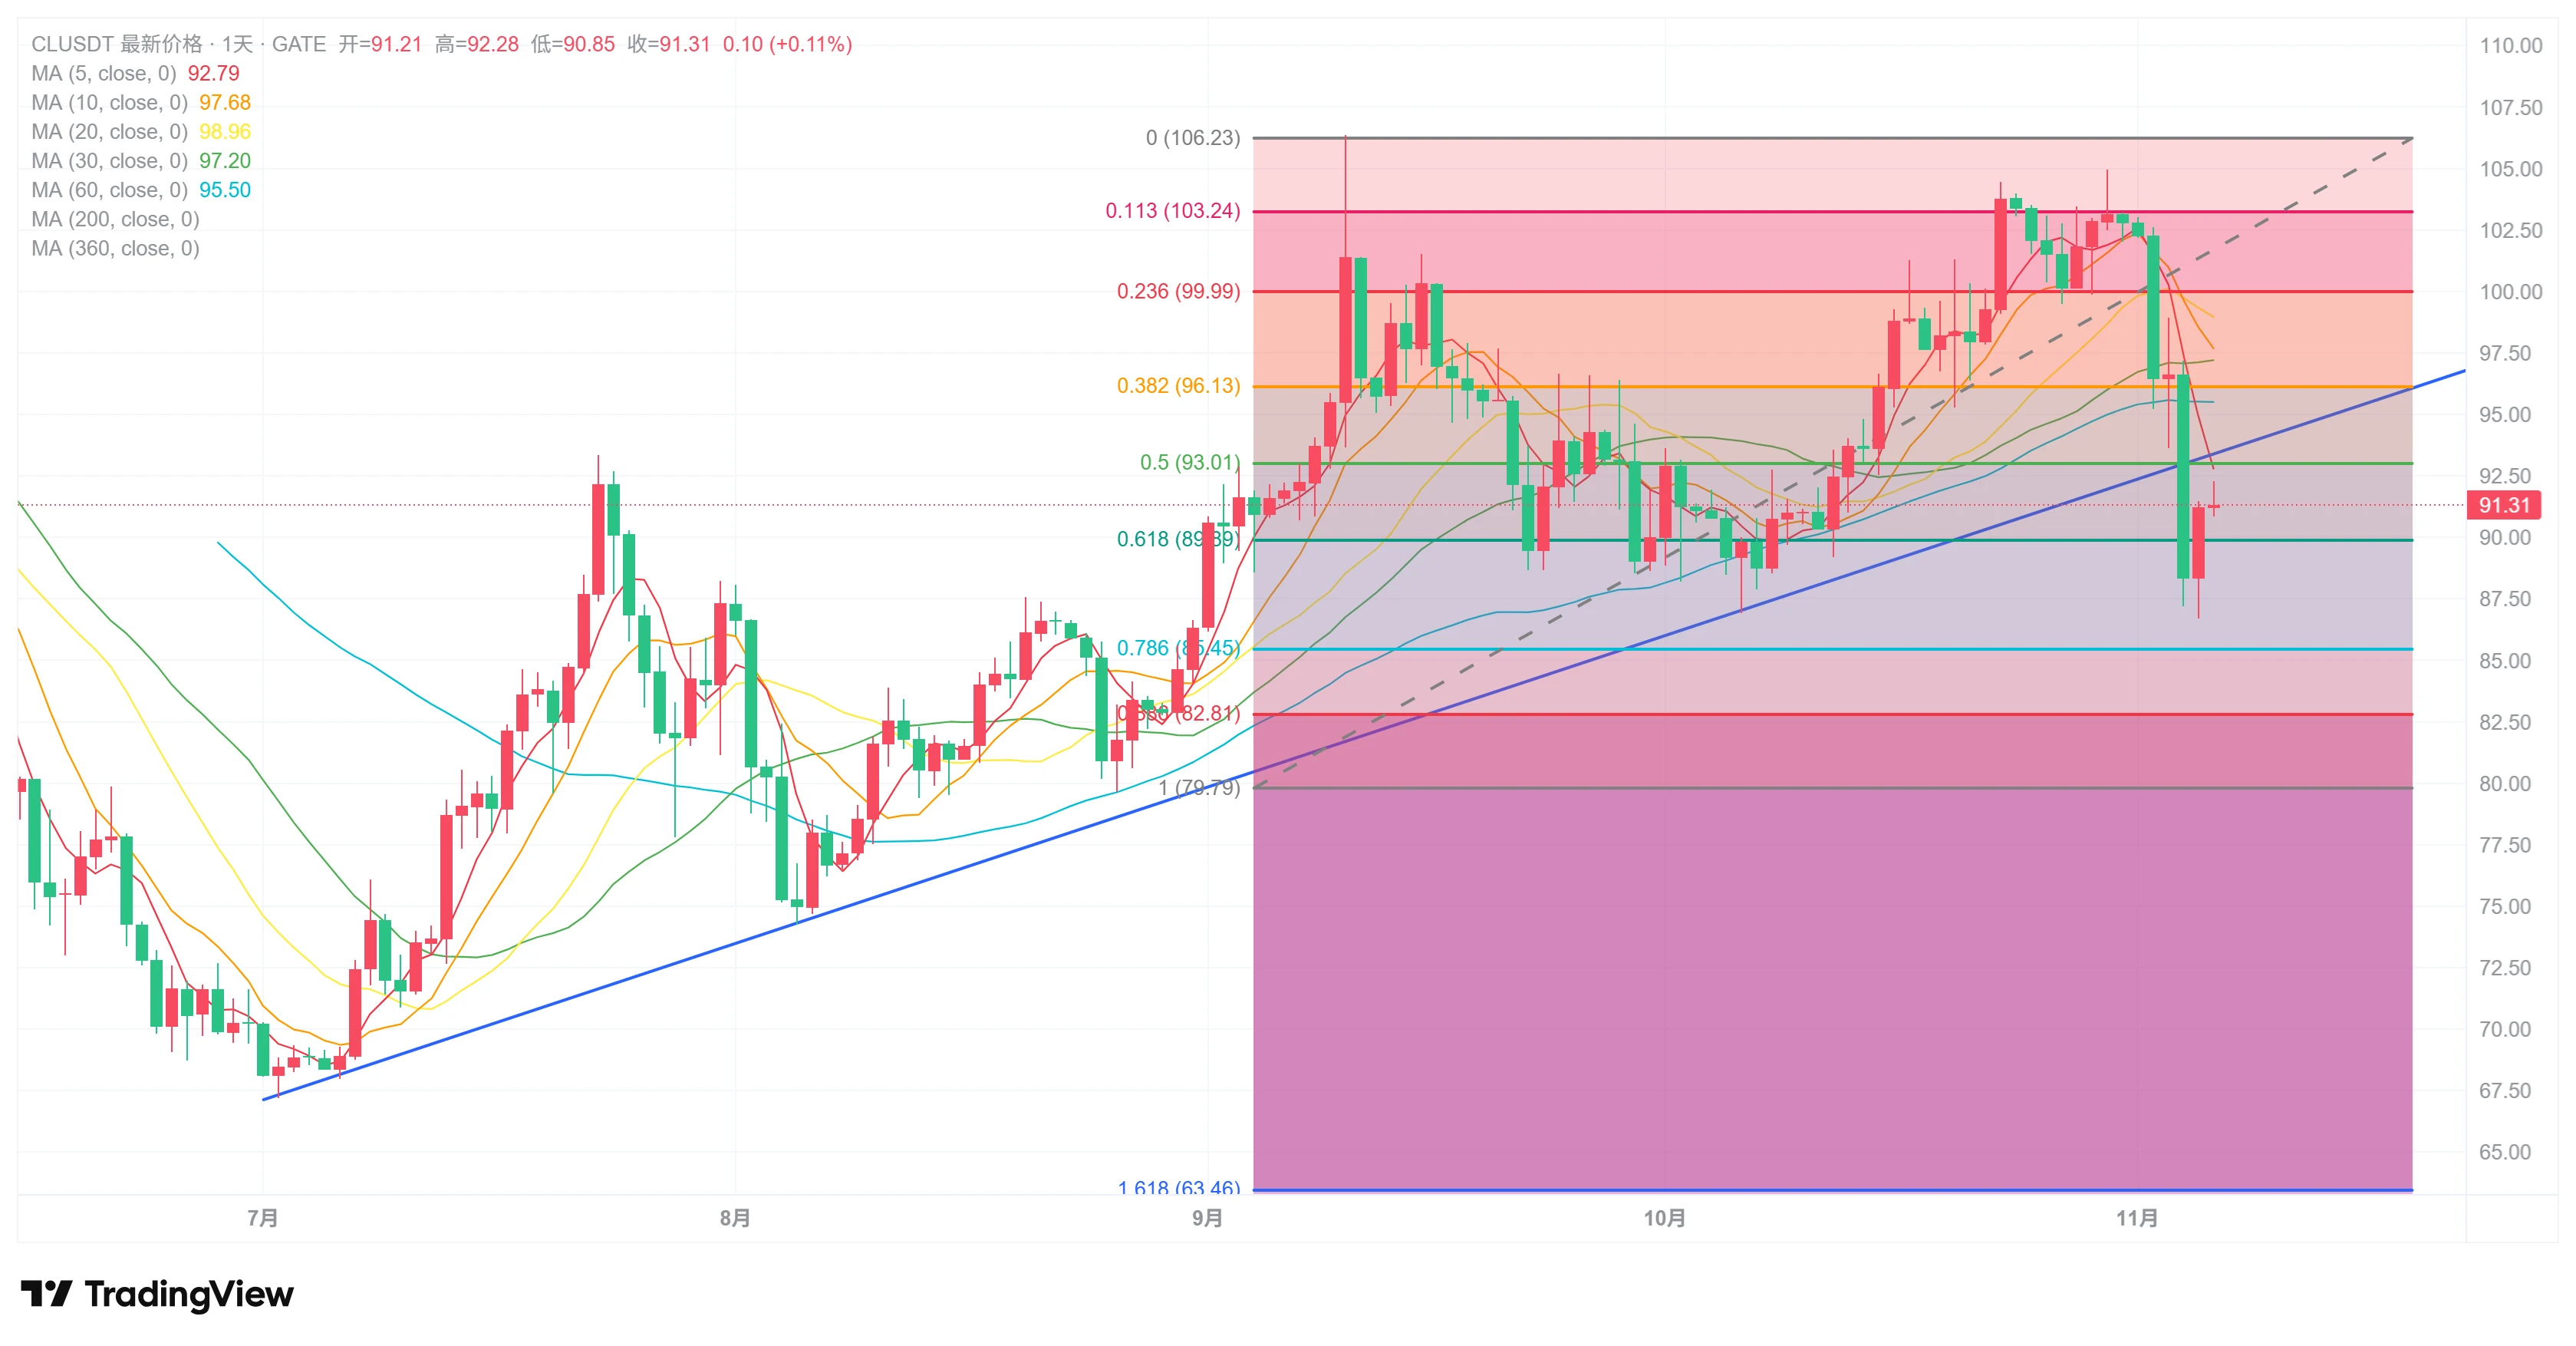
Bad Boy Watch: CL, Update 11.6

US stocks plunged yesterday, but the bad boy's CL long position turned out to be a safe haven.

Of course, the bad boy still plans to close out around 94
post-image
CL-1.83%
#GateLiveNewStreamerRewardsAre Live!

🎁 Go live and unlock exclusive rewards!
🔹 Earn up to 100 USDT cash for quality livestreams
🔹 Invite a friend to join, and both earn 10 USDT
🔹 Meet streaming requirements to unlock VIP5 Trial Benefits
🔹 Enjoy Fan Giveaways + Red Packet Rain support

🔥 Start streaming and earn more!
⏰ Event Period: Nov 1 – Nov 30
🔗 Go Live: gate.com/live
🔗 Details: gate.com/announcements/…
#GateLive #StreamerRewards
post-image
  • 1
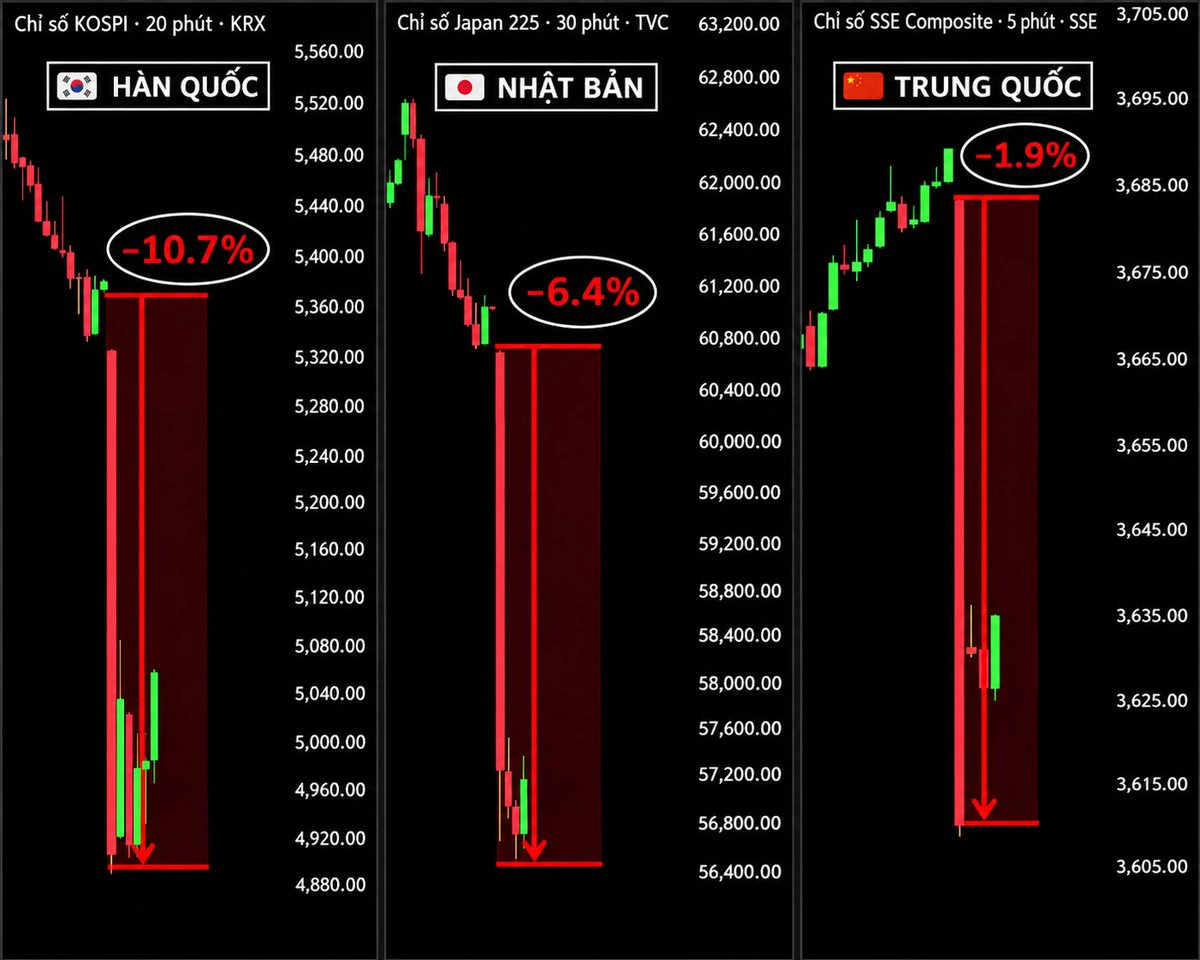
Nowhere to Run: Asia’s 3 Largest Stock Markets Suffer the Same Fate as US Stocks
Asian stocks lost more than $1 trillion in market capitalization after the Philadelphia Semiconductor Index in the US plunged 12.2%.
- KOSPI and Nikkei both fell 6%.
- Japan fell to its lowest level in nearly 7 months.
- Taiwan fell 5%.
- China’s SSE Index lost 1.5%.
AI and semiconductor stocks also plunged. Kioxia fell 13%, SK Hynix and SoftBank both fell 12%, and Samsung and TSMC both fell 8%.
post-image
SK Hynix-10.44%
$MSTU Down 21.67% in a day—this isn’t a pullback; someone just flipped the table.
Last night, the group was still shouting “to 33”; today, it hit a low of 23.69, with the price now at 25.63 and 24-hour trading volume at $11.1 million. What does that mean? It’s like the entire day’s sales of a medium-sized mall being crammed into this one coin, with everyone rushing for the exits. From a high of 33.02 to a low of 23.69, the range was nearly 40%. Anyone who chased the price higher this morning now has an account that feels like it’s on a drop tower ride.
In plain English: it’s like cabbage going
MSTU-3.61%
  • 6
  • 1
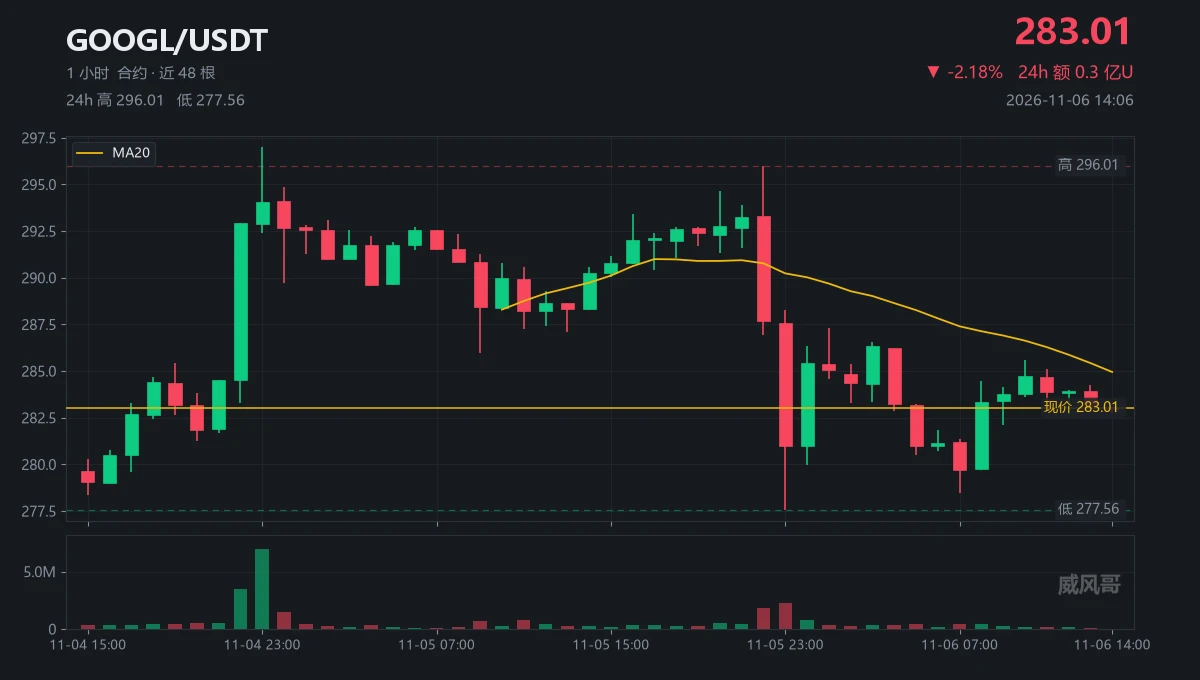
$GOOGL is down 2.38% now; don’t be too quick to read this as a U.S. stock move.
The U.S. stock market closed at 5 a.m.; it opens again at 10:30 tonight.
Who is the token price being set for during these eight-plus hours?
Market makers, not the company.
Q: Where does this price come from while the market is closed?
A: $31 million—that’s its total trading volume over 24 hours.
Q: Can that little money price a stock with a $2 trillion market cap?
A: No. It can only set a shadow price.
Q: Then what does it mean that it fell to 277.56 overnight?
A: Someone placed an order in a thin market; the six
post-image
GOOGL+0.11%
  • 7
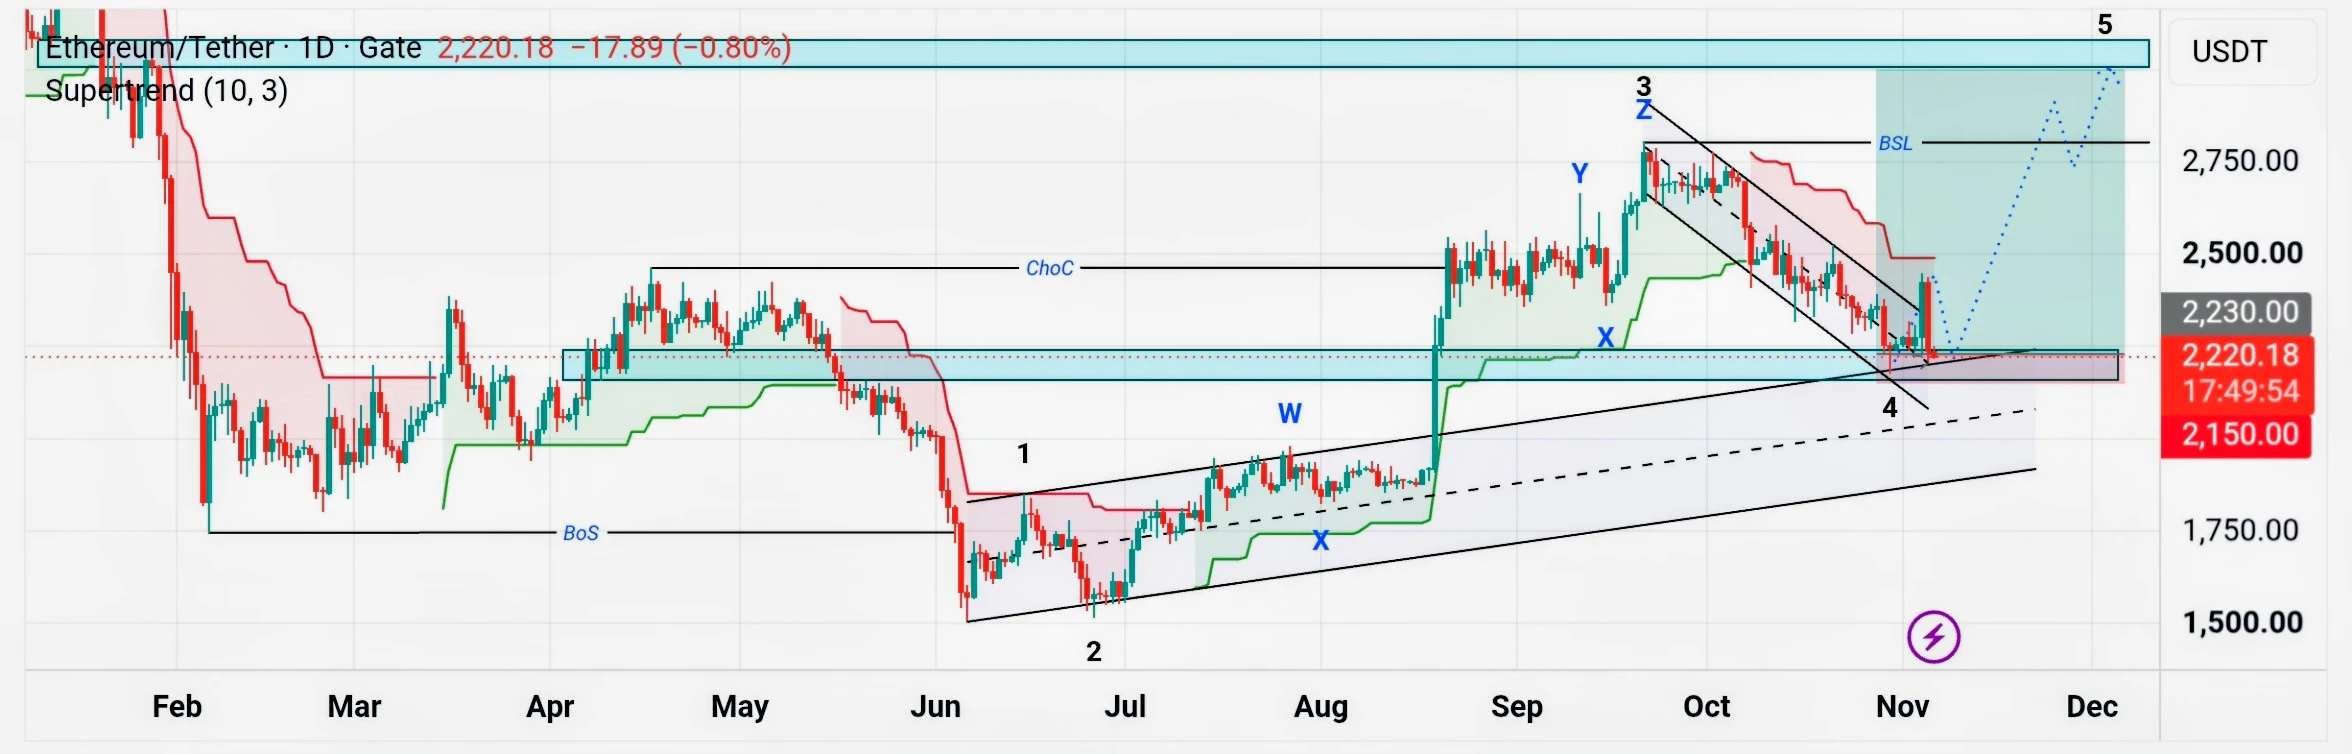
$ETH ‌-After the price broke out of the wave 4 channel shown in the chart, it immediately reversed back inside. Interpreting the price action this way, it could potentially be the formation of a micro wave 2, setting up for a bullish wave 5.
-Those with a bearish outlook might view this as a "false break."
-Therefore, using the most recent low (wave 4) as an invalidation level is a prudent risk management step for any long positions.
post-image
ETH-1.26%
💰 Your stock insights deserve rewards—and recognition

What signals make you bullish on a company? What concerns keep you on the sidelines?

Join Gate Square Stock Talk Season to share your views and the reasoning behind them.
🌟 Each day, 3 outstanding creators are selected to receive 5 USDT + an official feature, bringing their insights to a wider audience.

It’s not about predicting prices correctly or posting the most. Well-supported views, valuable observations, and thoughtful recaps all have a chance to get featured.

Register first, then post original content with #GateStockTalkSeason
post-image
  • 16
  • 4
#每周来晒 #美股史诗级抛售 Deleveraging or the Start of a Deeper AI Correction? What Thursday's Tape Tells Us
Thursday's sell-off was the kind of session that makes investors ask whether the AI trade is breaking. The Nasdaq 100 fell about 6.4% and erased roughly $2.5 trillion in market value, its deepest one-day drop since "Liberation Day" in April 2025, according to Reuters. Chip stocks posted their second-biggest one-day fall on record. The question is whether this is a forced reset or the first leg of a longer unwind.

The numbers from the close

From the Gate feed's closing prints on 5 November: NVIDI
post-image
NAS100+1.18%
QQQ-6.34%
US500+0.22%
NVDA-9.33%
AMD-17.64%
  • 2
  • 1
#ETHDrops5.5%
My initial take: The 5.5% drop in ETH appears to be a combination of a broader market trend toward risk aversion and weaknesses specific to Ethereum, rather than just a sell-off driven by tech stocks.

Instead of viewing this decline as an immediate buying opportunity, I would prefer to wait for some form of confirmation.

The critical distinction here is: Is ETH simply tracking the broader market downturn, or is capital actively flowing out of Ethereum?

1. To what extent is the sell-off driven by tech stocks?

Strong macro pressure

The sell-off in U.S. markets on November 5th
post-image
ETH-1.26%
BTC-0.67%
NVDA-9.33%
TSLA-10.84%
  • 8
  • 1
Crypto Market Updates
live-cover
LIVE1,875
$SOXL It's nearly matching Ethereum's transaction volume—just how many people are buying the dip
post-image
SOXL-1.16%
KOL View: Tom Lee Remains Bullish on the AI Trade! With Tech Stocks Facing Repeated Sell-Offs, Is Th
live-cover
LIVE2,948
Bitcoin Faces Fifth Weekly Loss as US Midterms Weigh In
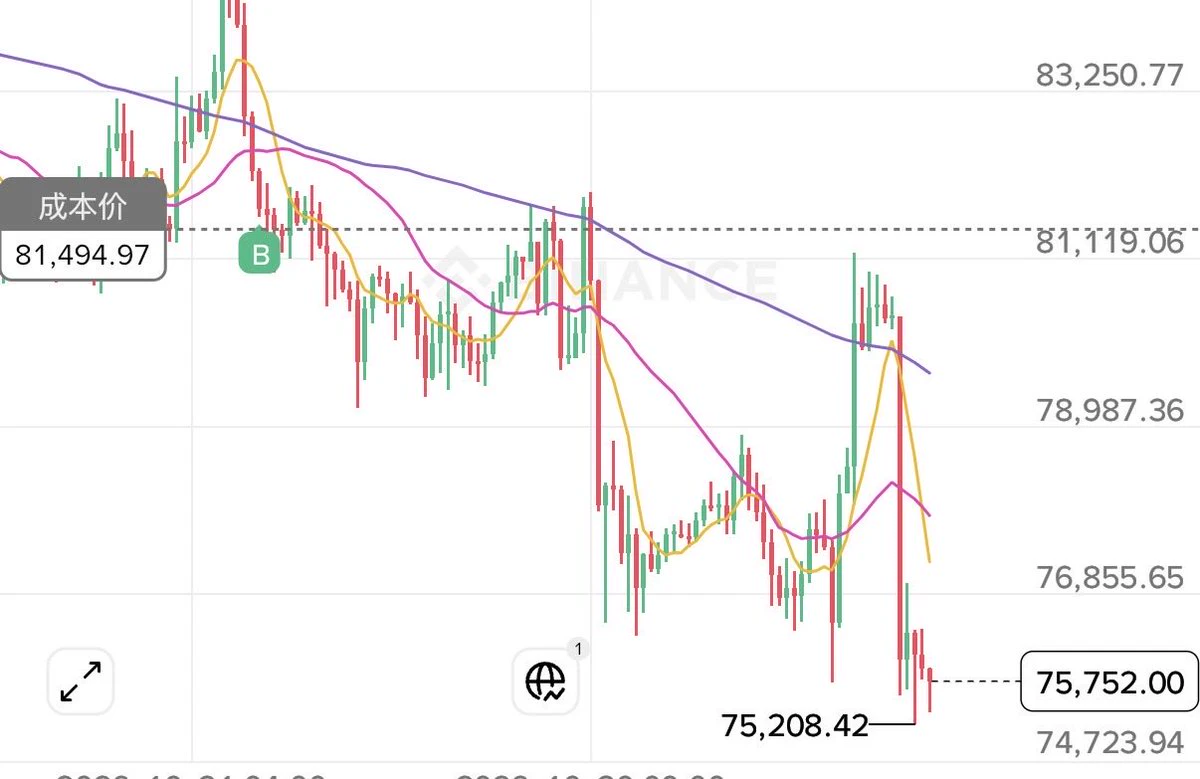
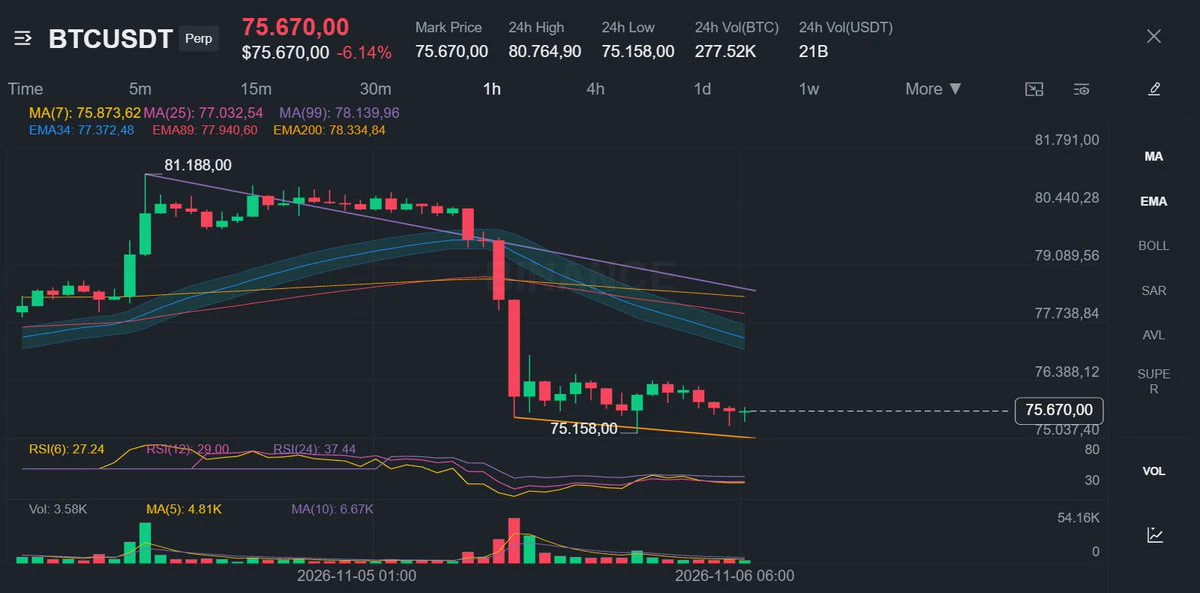
Bitcoin is heading toward a fifth consecutive weekly decline, sliding from around $87,000 to near $76,500. The leading cryptocurrency remains under pressure as political uncertainty, weakening tech stocks, and renewed geopolitical tensions weigh on investor sentiment.
The price weakness comes as traders reassess exposure to risk assets ahead of the US midterm elections. The outcome could shape the direction of economic policy and the regulatory environment facing the crypto industry. Investors are focused on whether the results will suppo
post-image
BTC-0.67%
🔥【Nonfarm Preview】U.S. tech stocks take a beating. What’s next for BTC?

📌 Tonight at 20:00 (UTC+8), join us to discuss the markets ahead of the nonfarm payrolls report:
• With the midterm elections over, why have U.S. stocks and BTC plunged?
• A preview of the nonfarm data: Will Fed policy change?
• Which will bottom out first, tech stocks or BTC? What signals should we watch?

🎁 Join us for two lucky draws
100 USDT position experience vouchers ×3|Gate soccer balls ×3

🎙️ Special guests: @JoJo揪揪, @独领风骚必暴富, [@野狼独行](gt://
post-image
BTC-0.67%
  • 5
  • 2
Load More

Join 40 M users in our growing community

⚡️ Join 40 M users in the crypto craze discussion

💬 Engage with your favorite top creators

👍 See what interests you

Trending Topics

USStocksFaceHistoricSelloff

3.32k Views3.59k Discussing

U.S. stocks suffered a sharp selloff on Thursday, with the Nasdaq closing down more than 5% and the Philadelphia Semiconductor Index falling over 12%. AI and chip stocks including $NVDA and $AMD were hit especially hard. Markets are reassessing AI valuations, data-center spending and future returns. Is this just short-term deleveraging, or the start of a deeper correction in the AI trade? Which sectors are you watching next?

GateLaunchesPoSECProofOfSecurity

13.75k Views580 Discussing

USNonfarmPayrolls

11.98k Views4.03k Discussing

View More