







Square
Following
Hot
News
Notifications
Profile
Share your thoughts
placeholder
Article
$JCT $JCT has seen several consecutive waves of sharp drops, all suddenly plunging more than 40%! This 🐶 market maker is playing rapid dumps and pumps—hold tight to your 🈳 positions!
post-image
JCT-3.26%
$EVAA Down 16% in a day—this isn’t a pullback, it’s a slaughter. It’s currently at 1.2460, with a 24h low of 1.2224 and trading volume of 26.1M. The selloff on high volume suggests some are scrambling for the exits, while buyers are putting real money in.
First, let’s clarify the macro picture. This crypto pullback isn’t happening in isolation: hawkish Fed minutes have pushed back rate-cut expectations, and rising real interest rates are directly weighing on risk-asset valuations. Quantitatively, BTC’s correlation with the Nasdaq has held in the 0.6–0.7 range over the past three months, while
EVAA-0.49%
BTC-0.67%
NAS100+1.90%
  • 3
Trenches
ZIG
Z
bade
b
ZIG
0x8c...1145
Market Cap
$.
Change
.
24h Vol
$.
Holders
.
STONK
S
bade
b
STONK
6GmA...UNgx
Market Cap
$.
Change
.
24h Vol
$.
Holders
.
CLAUDIA
C
bade
b
CLAUDIA
2j5S...W2ZM
Market Cap
$.
Change
.
24h Vol
$.
Holders
.
IDOL
I
bade
b
IDOL
0x3b...ab07
Market Cap
$.
Change
.
24h Vol
$.
Holders
.
FLOAT
F
bade
b
FLOAT
Bv1a...BMmr
Market Cap
$.
Change
.
24h Vol
$.
Holders
.
#INJ

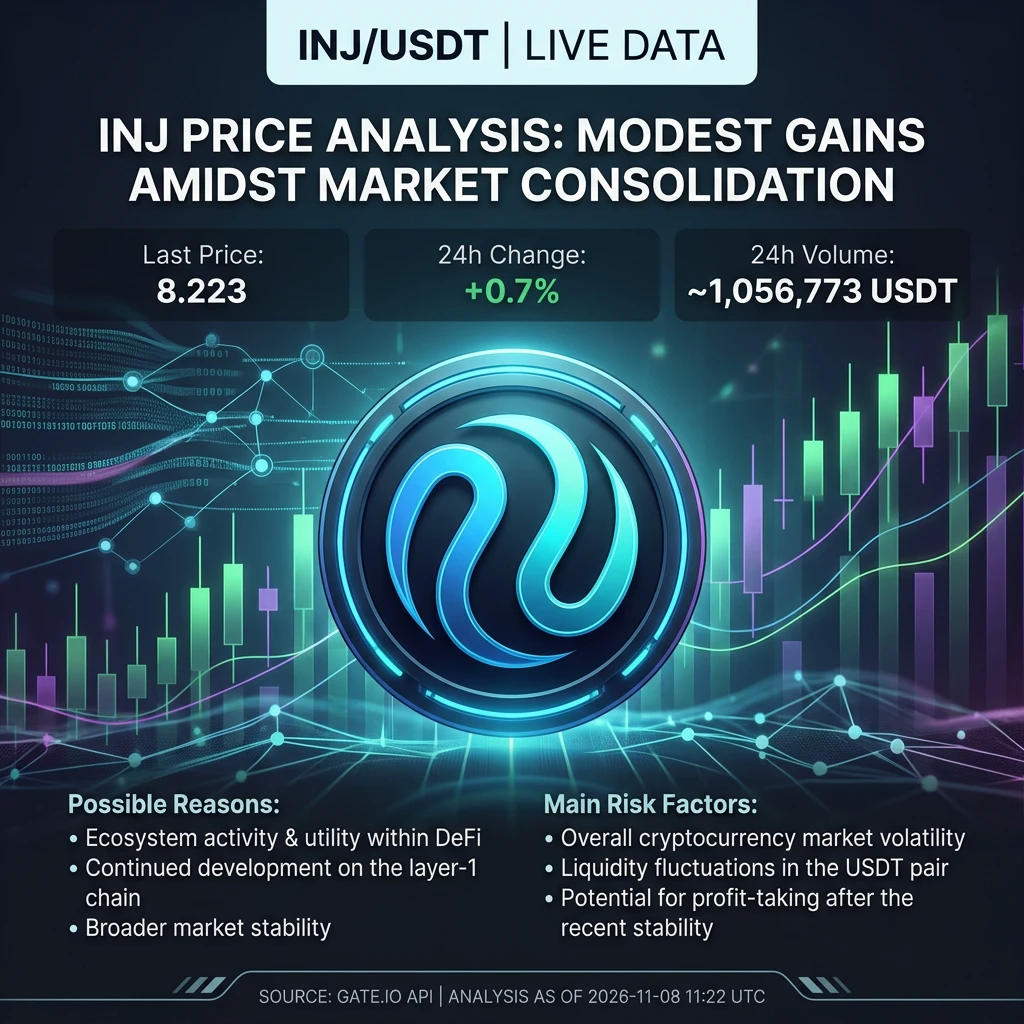
INJ Gains 0.7%: Can Injective’s Growing Institutional Activity Support Its Next Market Move?

What Does the Latest Price Tell Us?

INJ is showing a positive move, but the more interesting story is developing around the Injective ecosystem. As of November 8, 2026, at 11:22 UTC, INJ/USDT was trading at $8.223, recording a 24-hour increase of 0.7%. Trading volume reached approximately $1,056,773 USDT.

The price movement indicates modest buying strength over the measured period. However, a gain of less than 1% does not establish a strong bullish trend. It shows that buyers have maintained
post-image
INJ-1.67%
Grok Bot seems to be getting lazy
Doesn't finish some tasks to completion as it did before and gives me artificial blockers ("you're right, I do have access to that")
I remember Claude doing the same thing earlier this year, likely intentional to reduce compute usage
post-image
$NVDA ‌Let’s gooooo! Love you, mwah!😘😘😘😘😘😘😘😘😘😘😘😘😘😘😘😘😘😘😘😘😘😘😘😘😘😘😘😘😘😘😘😘😘😘😘😘😘😘😘😘😘😘😘😘😘😘😘😘😘😘😘😘😘😘😘😘😘😘😘😘😘😘😘😘😘😘😘😘😘😘😘😘😘😘😘😘😘😘😘😘😘😘😘😘😘😘😘😘😘😘😘😘😘😘😘😘😘😘😘😘😘
post-image
NVDA+2.80%
crypto future market updates
live-cover
LIVE1,976
#ARIA

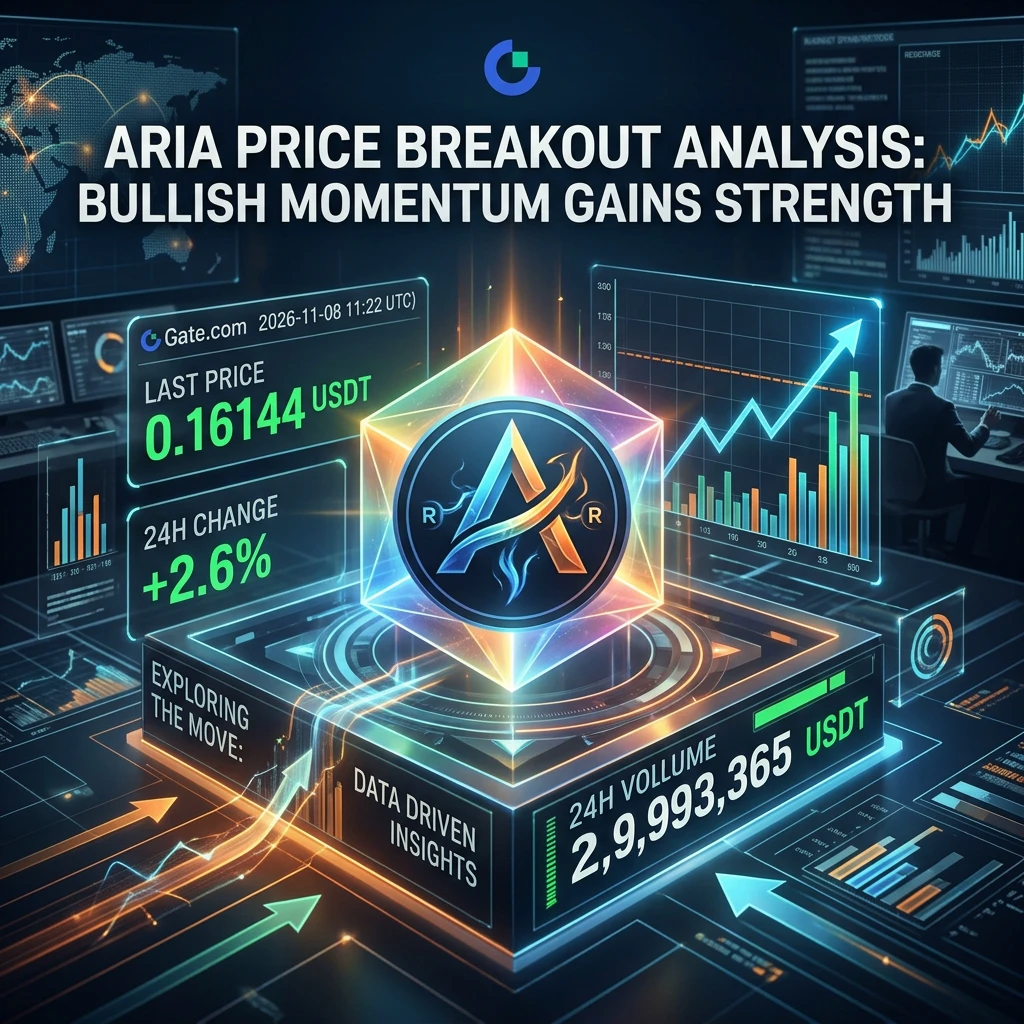
ARIA at $0.16144: Is This a Sign of Stronger Demand or Just a Short-Term Move?

What Is Happening With ARIA?

Is ARIA building genuine buying momentum, or is the latest price increase simply a short-term market move? That is the important question traders should consider before making a decision.

As of November 8, 2026, at 11:22 UTC, ARIA/USDT was trading at $0.16144, showing a 2.6% increase over 24 hours. Its 24-hour trading volume was approximately $2,993,365 USDT.

These figures show positive price movement alongside meaningful trading activity. However, they do not automatically c
post-image
ARIA+22.03%
CRYPTO MARKET
live-cover
LIVE1,521
#WCTCS9 #广场交易达人 Gold bulls and bears battle; crude oil consolidates and recovers

Spot gold: Gold formed a volatile pattern this week, rebounding from its lows before rallying and then pulling back. The weekly candle had a long upper wick, showing that buying support remains at lower levels, while selling pressure overhead is also significant.
Spot gold is currently consolidating near $4,070/oz. After dipping to around 4,029 intraday on Friday, it rebounded, with bulls and bears locked in a short-term tug-of-war.
Gold remains driven in the short term by interest rate expectations and the dolla
CL-1.83%
  • 3
#RITUAL

RITUAL Surges 102% in 24 Hours: Is This a Real Recovery or a Short-Term Market Rally?

The Myth: A 100% Price Increase Means a Strong Project

Does a cryptocurrency become a stronger investment simply because its price doubles in one day? Not necessarily. A sharp price increase shows that buying activity has become stronger, but it does not automatically prove that the project has achieved long-term success.

RITUAL is an interesting example. Its latest market movement deserves attention, but understanding the reason behind the rally is just as important as watching the price.

Q1: W
post-image
RITUAL
RITUALMoney Ritual
Pump.Fun
MC:$2.65KHolders:1
0%
If I've fallen in love with this kind of life
$HYPE The liquidation map for the past 30 days shows:
If HYPE rises to $85.15, cumulative short liquidation intensity on major exchanges will reach $69.48 million.
If HYPE falls to $73.9, cumulative long liquidation intensity on major exchanges will reach $66.09 million.

Trading strategy:
Conservative traders can place limit orders to go long on HYPE at $74; aggressive traders can buy in increments below $80.$HYPE ‌
HYPE+0.33%
#WCTCS9 #广场交易达人 Down 16% in one week! War premium collapses: three oil price scenarios for next week

WTI settled at $90.83 and Brent at $98.32—the daily gain last Friday was only 0.34%, but that doesn't mask the brutal week: WTI fell about 12.8% for the week, while Brent dropped about 16.4%, its biggest weekly decline since 2020.

One week ago, the market was still pricing in a premium for the situation in the Middle East; one week later, oil prices had shed a full $20.

【Why the collapse: three forces combine】

First, progress in U.S.-Iran talks caused the war premium to collapse instantly.
GAS-0.57%
  • 4
French bank resumes transfers after $133M hack, crypto loss still unconfirmed
Arkéa says attackers used its own account through a provider's platform, while a separate $108.8 million USDC trail leaves the bank-to-crypto link unproven.
Quick Take
⚠️ Personal market analysis only. NFA — manage risk and DYOR.
Educational content, not investment advice or a recommendation to buy, sell, deposit, or withdraw any asset. No paid promotion or referral/affiliate links.
post-image
USDC+0.01%
$JCT Up nearly 400%… short sellers get crushed

JCT’s move is truly wild. The price surged from 0.002512 to 0.011798, up nearly 370% from its low! As the rally continued, our earlier short strategy failed, and the stop-loss at 0.0100 was hit. Buying pressure was tremendous, and the price kept climbing, inflicting heavy losses on early short positions. JCT is now pulling back from its recent high, but volatility remains extreme. The sharp rally and devastating blow to short sellers are another reminder of how unpredictable the crypto market can be. $JCT
post-image
JCT-3.26%
💰 Your stock insights deserve rewards—and to be seen
What signals do you look for when you’re bullish on a company? What concerns make you decide to keep waiting?

Join Gate Square’s stock discussion season to share your views and the reasoning behind them.
🌟 Each day, 3 quality creators will be selected to receive 5 USDT each, plus official featured placement to help more people see their valuable content.

Selection isn’t based on correctly predicting price movements or the number of posts. Well-supported opinions, valuable observations, and thoughtful reviews all have a chance to be selec
GateSquare
💰 Your stock insights deserve rewards—and to be seen
What signals do you look for when you’re bullish on a company? What concerns make you decide to keep waiting?

Join Gate Square’s stock discussion season to share your views and the reasoning behind them.
🌟 Each day, 3 quality creators will be selected to receive 5 USDT each, plus official featured placement to help more people see their valuable content.

Selection isn’t based on correctly predicting price movements or the number of posts. Well-supported opinions, valuable observations, and thoughtful reviews all have a chance to be selected.

Sign up first, then #Gate股票畅聊季 publish original content👇
👉 Sign up now:
https://www.gate.com/campaigns/6898
📄 Event details:
https://www.gate.com/announcements/article/102611
repost-content-media
  • 1
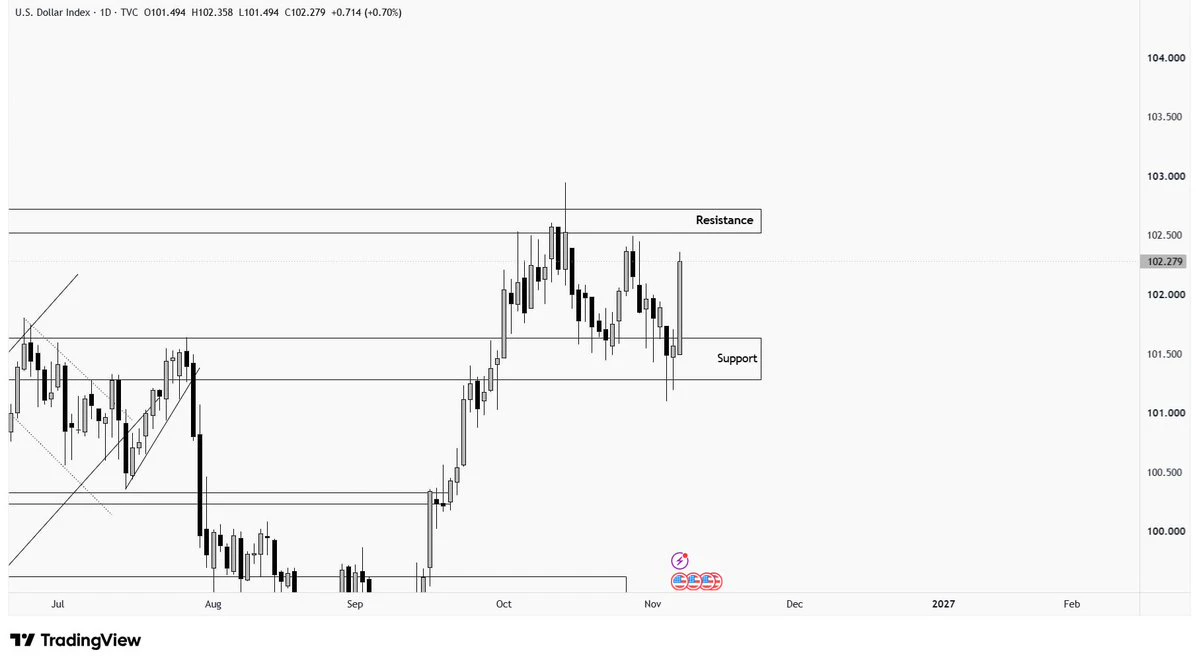
#DXY wicked below the support zone and eventually moved up near the resistance area. The Dollar Index is ranging, and next week we need to watch out for the breakout.
#ShareWeekly
$BTC $SOL $AAPL
post-image
BTC-0.67%
SOL-0.77%
AAPL-0.57%
$JCT Short setup update:

Entry: 0.007554 Defense level (stop-loss): 0.008600 First target: 0.007000 Second target: 0.006000 Third target: 0.005000
JCT has recently surged +182.09%, and short-term sentiment is overheated. The current level is suitable for trying a short with a small position; be sure to set a strict stop-loss.
Risk warning: The above is solely a personal trading idea and does not constitute investment advice. Contract leverage carries extremely high risk. Please manage your position size and risk accordingly.
post-image
JCT-3.26%
  • 4
$SOL ‌
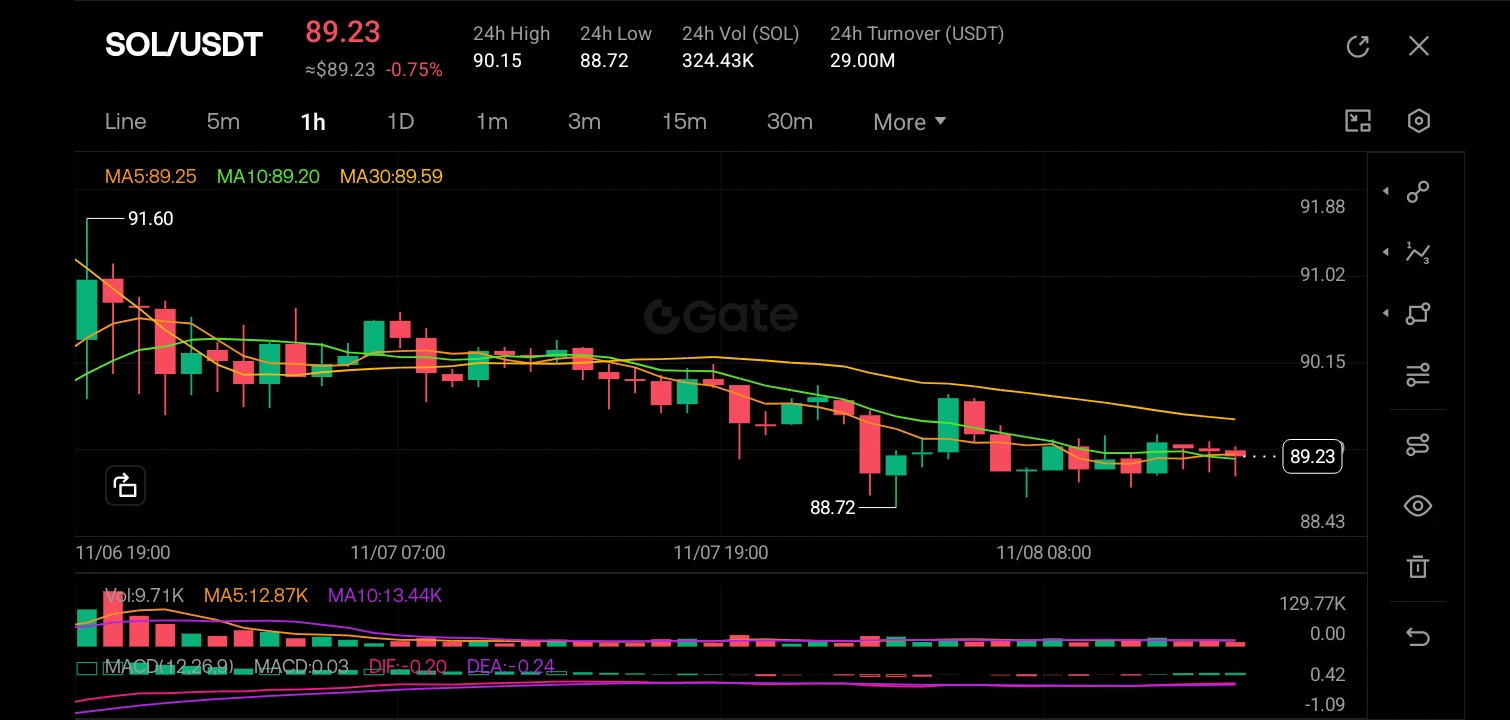
The SOL/USDT 1H chart reveals a prevailing downtrend that has recently hit a floor, currently trading at 89.23 with a -0.75% loss for the session; the price is trading below the long-term MA30 (89.59) which acts as dynamic resistance, while the shorter MAs (MA5 at 89.25 and MA10 at 89.20) have flattened out and are crossing, suggesting the aggressive selling pressure has exhausted itself. The MACD is displaying a potential bullish convergence, with the DIF (-0.020) crossing above the DEA (-0.024) and the histogram turning positive (green), indicating that despite the price being low, d
post-image
SOL-0.77%
  • 2
#Gate股票畅聊季 #美股AI板块遭遇重挫 #作手分析 #WCTCS9
US AI Stocks Face a Major Sell-Off: Is This a Temporary Correction or a Bigger Warning for the Technology Market?
The US stock market has recently faced increased pressure, with artificial intelligence-related stocks attracting particular attention due to significant selling pressure and changing investor sentiment. AI has been one of the strongest investment themes in recent years, attracting enormous capital from institutional investors, technology companies, and retail market participants. However, even the most popular sectors can experience correctio
Load More

Join 40 M users in our growing community

⚡️ Join 40 M users in the crypto craze discussion

💬 Engage with your favorite top creators

👍 See what interests you

Trending Topics

USCPIDataIncoming

7.61k Views1.57k Discussing

The U.S. October CPI report will be released on November 10 at 8:30 a.m. ET. September CPI came in at 3.7% year over year, and markets will be watching closely for signs that inflation is cooling, especially in core CPI. A softer-than-expected reading could strengthen rate-cut expectations, while hotter inflation may pressure risk assets through higher Treasury yields and a stronger dollar. How do you think this CPI print will move $BTC, U.S. stocks and gold?

USAIStocksHitHard

26.63k Views3.72k Discussing

USNonfarmPayrolls

49.41k Views4.46k Discussing

View More