Square
Following
Hot
News
Profile
Share your thoughts
placeholder
Article
#每周来晒 #USSeptemberPPIDataRelease
US SEPTEMBER PPI: INFLATION PRESSURE, FED POLICY, AND BITCOIN’S NEXT MOVE
The September US Producer Price Index (PPI) report is an important event for financial markets because it offers another look at inflation before the Federal Reserve’s upcoming policy decisions. For me, the key question is not simply whether producer prices rise or fall. What matters most is whether inflation is cooling sufficiently to give the Fed confidence to consider future rate cuts.
My approach is cautious: I want to understand the data first, observe the market’s initial reaction,
BTC+0.78%
USIDX+0.09%
$ADA A slight pullback is likely to be followed by a rise
Buy 0.2285–0.2255; targets 0.2310, 0.2335, 0.2360; stop loss 0.2210
post-image
ADA+0.01%
crypto market update
live-cover
LIVE2,153
#晒出我的持仓收益 Should we all play it safe today? Are you bullish or bearish today
post-image
Good morning!
U.S. CPI and PPI both came in hotter than expected, putting a rate hike this year back in focus!
With inflationary pressure picking up again, the Fed’s room to cut rates is limited, and the market has started reassessing the risk of a rate hike this year.
For Bitcoin, the key issue is not just whether rates are raised, but whether the U.S. dollar and Treasury yields will continue to strengthen. Once expectations for liquidity tightening take hold, BTC could come under pressure, while altcoins face even greater volatility risk.
However, a single upside inflation surprise is still
post-image
BTC+0.78%
It fell from 14.948 to 10.094 in 26 hours.
$KORU The sharpest stretch in the past two days, wiping out nearly one-third.
The 13:00 wick ranked third in volume among the past 48 candles.
Three consecutive candles rose from 21:00, reaching 12.16 at 4:00 a.m.
It is now at 11.552, with the 20-day moving average at 11.25465, just 2.6% below.
12.16 overhead is the wall, while 10.094 below is the only support.
The bounce is sharp, and the retreat is quick.
There is little to do in the middle unless one of these two levels breaks.
I’ll note this down and wait for it to choose on its own.
(Not investme
post-image
KORU-0.24%
$INJ Short setup… price is testing a strong resistance zone
INJ has risen sharply from around 7.05 to the 8.50–8.56 resistance zone. This rebound is strong, but this is exactly where I would stop chasing longs. Short entry: 8.30–8.60 (filled) Next target price: 8.20Take-profit 1: 8.00Take-profit 2: 7.80Final target: 7.65Stop-loss: 9.00
After the rapid rebound, the move is beginning to look somewhat overstretched, while the price is currently below resistance. If buyers fail to break through 8.56 effectively, I expect the price to first pull back toward 8.20 for a test, followed by a possible f
post-image
INJ+12.44%
📊 USDT/VES is moving at two speeds: the P2P Radar shows 1,018.80 Bs with a 15.89% premium over the BCV (879.12 Bs), but the order book trades at 1,006.75 Bs.
More than 12 bolivars per USDT difference depending on where you look—and the book is 37.31% weighted toward buyers. Banesco, BDV, and Bancamiga explain the rest.
👉
#P2P #USDTVES #Venezuela
post-image
Mantle's treasury holds $2,278,697,265 as of October 14. Beyond MNT, it includes $289,957,751 in ether, $241,777,567 in bitcoin and $111,168,809 in stablecoins.
@Mantle_Official
MNT+1.64%
BTC+0.78%
What is the easiest trap to fall into during this $WAL move?
When I looked at $WAL again, I first covered up the 24-hour -16.51%. It is not that this number is unimportant, but it is too easy for it to seize attention. What really needs explaining right now is that $WAL moved first on the 1-hour chart, while the 4-hour chart has not acknowledged it yet. I will treat the short-term trend as a reminder, not directly as a conclusion; if the larger timeframe does not follow, the direction can still reverse.
Laying out the chart, the current price is 0.05048, and over 24 hours it has moved through
post-image
WAL-14.07%
Layout: Bitcoin, Ethereum, Dogecoin
live-cover
LIVE880
  • 4
No talent? Then repeat!
Good morning, my world❤️
post-image
$PNC This breakout is most likely a false breakout. Revenue rose 15% and net profit rose 19%, which is indeed a solid performance for a regional bank. Net interest margin was lifted by both volume and interest rates, but the unfinished sentence in the original text made one thing clear: the way this thing operates is backward. It looks strong now, but it could easily revert to its original form once the holiday effect fades. Let’s wait until the weekend to look at the results and compare notes then. #Under the Fed’s watch
post-image
PNC-0.27%
Short $AGT
now. Entry range: 0.03532 - 0.03610Take profit 1: 0.029963Take profit 2: 0.025365Stop-loss: 0.039710After a sharp vertical rally, AGT has shown clear signs of weakness. The 15-minute chart failed to reclaim the 0.0352 MA25 resistance level. As RSI retreats from the overbought zone and the price struggles to hold the key 0.0350 level, the risk of further mean reversion is high. Trade 👇👇👇Other active signals:$AKE : Current price 0.03267 - 24-hour gain: +19.29%$SOL : Current price 105.54 - 24-hour gain: +1.08%
post-image
AGT+107.75%
AKE+19.19%
SOL+1.01%
Meeting six of these conditions means you live with clarity
1. Don’t attend class reunions.
2. As long as your phone isn’t broken, it’s fine as long as it works.
3. Hardly ever drink milk tea or soft drinks; only drink plain water.
4. Buy clothes out of season, and only eat seasonal fruit.
5. Never perm or dye your hair.
6. When leaving, turn off the lights.
7. When supermarkets run promotions, stock up on some cost-effective household essentials.
8. Choose classic styles when buying clothes; they don’t easily go out of fashion.
9. Walk for 20 min
post-image
#AnthropicTurnsProfitablebutGrowthSlows
ANTHROPIC’S PROFITABILITY MILESTONE: THE AI RACE IS SHIFTING FROM RAPID GROWTH TO SUSTAINABLE RETURNS
The artificial intelligence industry may be entering a new phase where profitability, operational efficiency, and realistic valuations matter just as much as technological innovation. Anthropic’s reported financial performance highlights this transition, with adjusted profitability for a second consecutive quarter alongside continued revenue expansion.
However, the changing growth rate raises an important question: Can AI companies maintain their moment
$ICP ICP/USDT: Key Support Holds the Potential for a Recovery Toward
ICP is approaching a critical support zone between $2.83 and $2.90, where horizontal support aligns with the rising trendline on the 4H chart.
If buyers defend this area and bullish momentum strengthens, the price could recover toward the following resistance levels:
• $3.20
• $3.28
• $3.45 - $3.47
The RSI is showing signs of recovery, but further confirmation is needed before expecting a stronger upward move.
A breakdown below $2.83 could invalidate this bullish scenario and expose ICP to further downside.
Key zone to watch:
post-image
ICP-0.16%
The bot is drawing a candlestick chart—what a beautiful arch. Now we just sit back and watch the show, and see whether the market maker paints the motherland’s mountains and rivers red, with the splendid landscape covered in fluttering maple leaves!
post-image
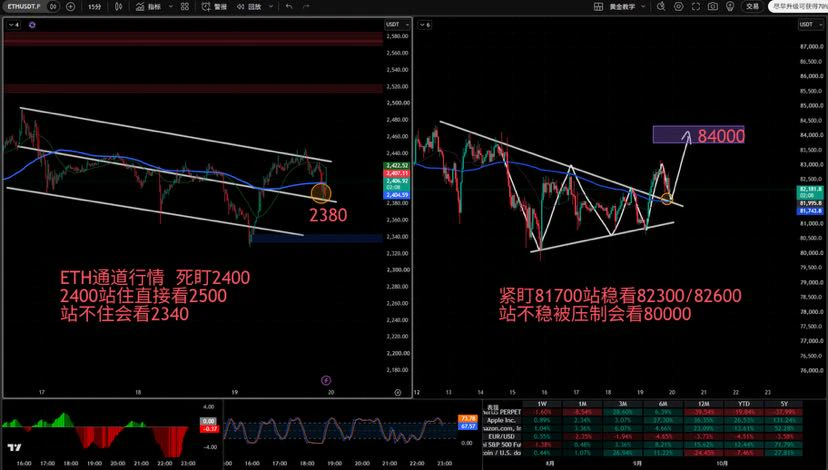
Yang Guang bit | October 16 $BTC CPI-triggered V-shaped rebound after an unexpectedly sharp plunge, short at 82700 resistance and long at lower levels
【Today's Plan】
Short on rebound (main strategy): Lightly short at 82700–83000 on a rebound, stop-loss at 83400, targets 82000–82200 and 81300–81500
Long on pullback (secondary): Enter a short-term long at 82000–82200 on a pullback, stop-loss at 81600, targets 82700–82900
【Key Conclusion】
BTC plunged to a low of 79725 yesterday after CPI exceeded expectations, then rebounded sharply to around 82500, driven by a rebound in U.S. stocks and a pullba
post-image
BTC+0.75%
Touched 1253.76 and pulled back again—just missing that final push?
$ZEC Here’s the move from overnight, laid out by time
20:00 Dipped to 1065.5, with volume nearly three times the previous candle
23:00 A candle at 1180.15, with the strongest volume of the rebound
05:00 Touched a high of 1253.76, then pulled back from the long upper wick
Now stuck at 1221.5, moving sideways on declining volume
Two hurdles above: 1253.76 and 1285.14
One line below: the 20-day moving average at 1160.65
Scenario one: Only a high-volume reclaim of 1253.76 creates a chance to break through 1285.14
Scenario two: If
post-image
ZEC+7.52%
Load More

Join 40 M users in our growing community

⚡️ Join 40 M users in the crypto craze discussion

💬 Engage with your favorite top creators

👍 See what interests you

Trending Topics

USSeptemberPPIBeatsExpectations

91.35k Views1.89k Discussing

US September PPI came in at 6.3% YoY, well above the 5.3% market expectation, pointing to renewed producer-side inflation pressure. Weekly jobless claims were 199K, broadly in line with forecasts. Could hotter inflation further reduce room for rate cuts, and what does it mean for $BTC, US stocks, and gold?

DrLinHanSpeaksAtOxfordUnion

135.63k Views1.86k Discussing

JapanAndKoreaStocksPlunge

47.27k Views1.76k Discussing

View More