Square
Following
Hot
News
Notifications
Profile
Share your thoughts
placeholder
Article
Here’s the question: Which feels more jarring—an older husband with a younger wife, or a younger husband with an older wife?
No be statistics we go chop, but before you collect ₦10,000 to vote for Tinubu next year, make I help you do small calculation.
Let me use FEEDING as an example.
Assuming you spend just ₦1,500 per meal:
- Daily: ₦1,500 × 3 = ₦4,500
- Weekly: ₦4,500 × 7 = ₦31,500
- Monthly (4 weeks): ₦126,000
- Yearly: ₦1,512,000
- 4 Years: ₦6,048,000
And this is just feeding o!
We never add transportation, rent, school fees, healthcare, electricity, clothing and other basic cost of living.
So, my brothers and sisters, please, don't allow anybody to shortchange you.
If you must sell your vote, make sure the of
post-image
Trenches
mihao
m
bade
b
mihao
4Cxj...pump
Market Cap
$.
Change
.
24h Vol
$.
Holders
.
Snoopy
S
bade
b
Snoopy
7mEh...47Cn
Market Cap
$.
Change
.
24h Vol
$.
Holders
.
AGT
A
bade
b
AGT
0x5d...e274
Market Cap
$.
Change
.
24h Vol
$.
Holders
.
PIEVERSE
P
bade
b
PIEVERSE
0x0e...25a9
Market Cap
$.
Change
.
24h Vol
$.
Holders
.
IDOL
I
bade
b
IDOL
0x3b...ab07
Market Cap
$.
Change
.
24h Vol
$.
Holders
.
BTC PREDICTION MARKET UPDATE
live-cover
LIVE1,520
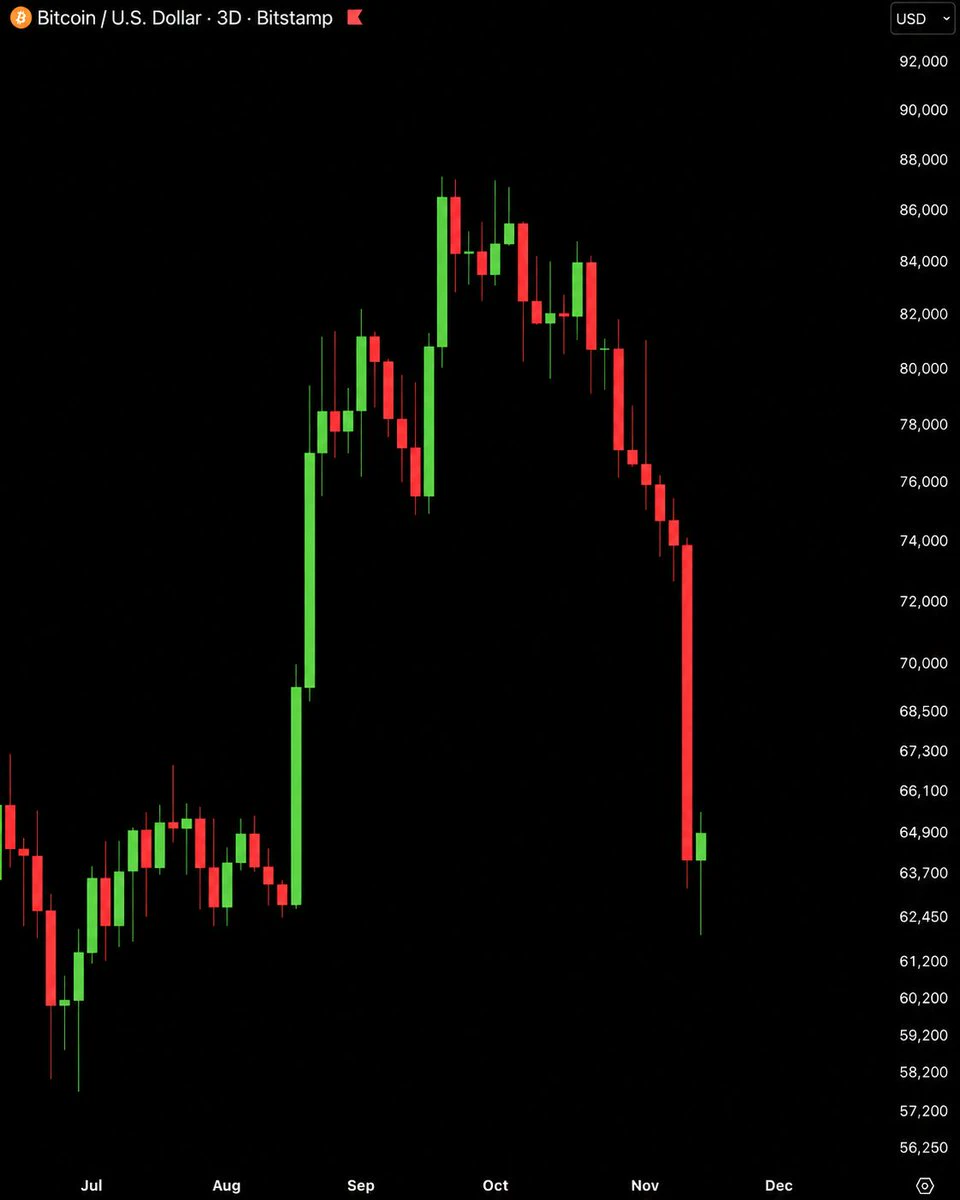
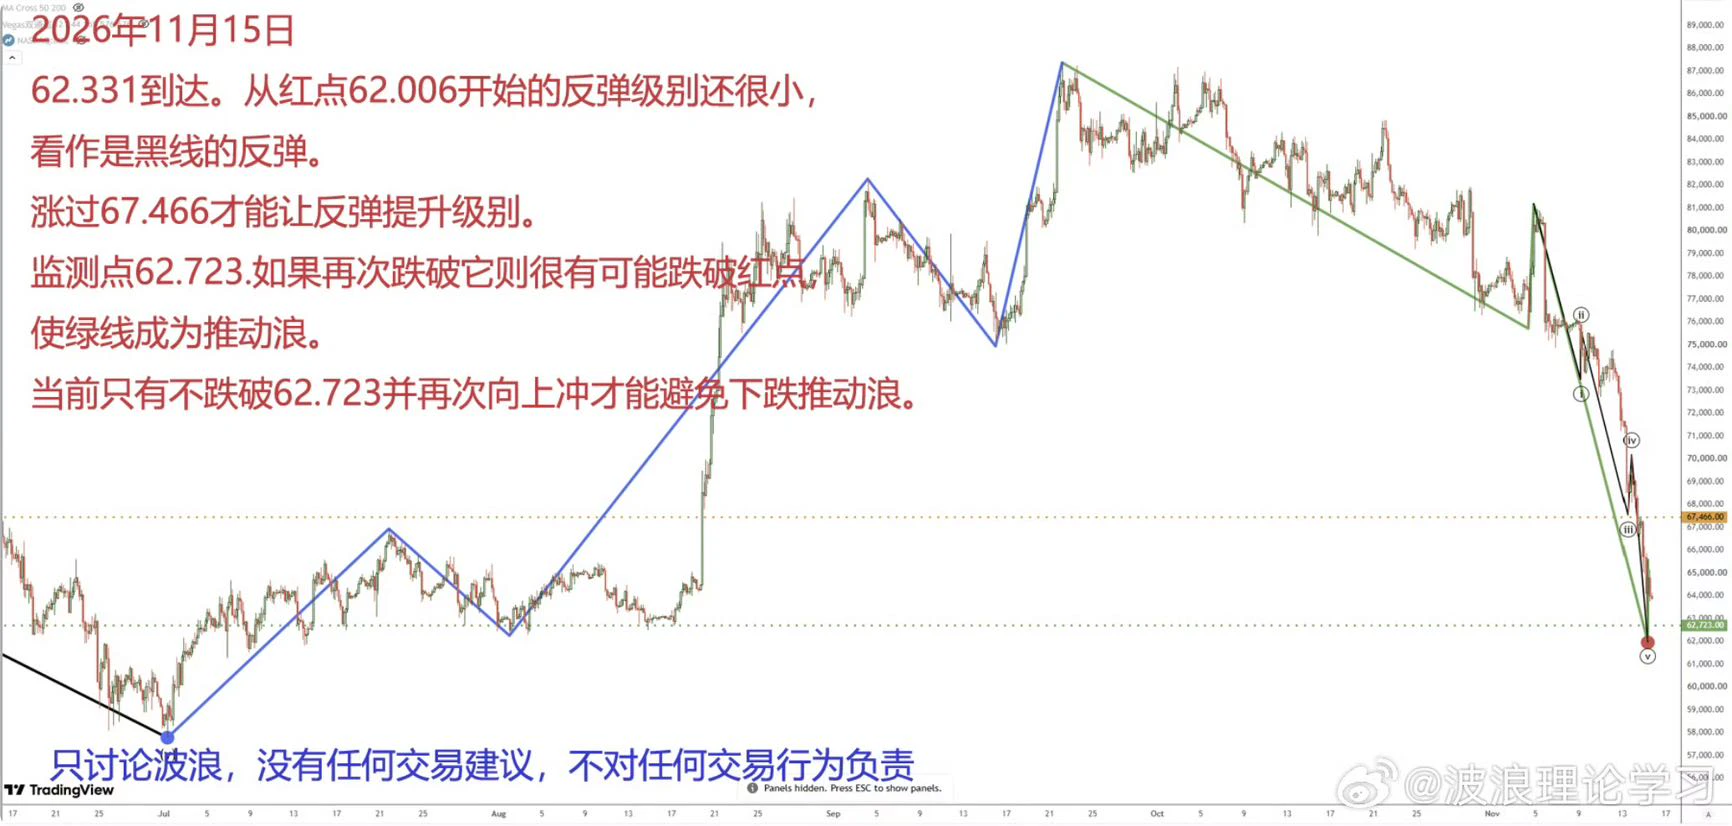
$BTC is back near $62K, wiping out almost its entire August rally.
Nearly $2B liquidated in 24 hours, mostly longs.
Everyone is turning bearish, but what if this is the trap before the next big move up?
Don't get shaken out.
post-image
BTC-0.65%
  • 2
  • 1
Halfway through November, the short-side thesis continues to play out, and the window for a year-defining trend is wide open!

No need to say much about this week’s action—the charts speak more honestly than words—

BTC came under pressure near its 81188 high, with a low of 61956 and a maximum pullback of 19231 points during this phase;

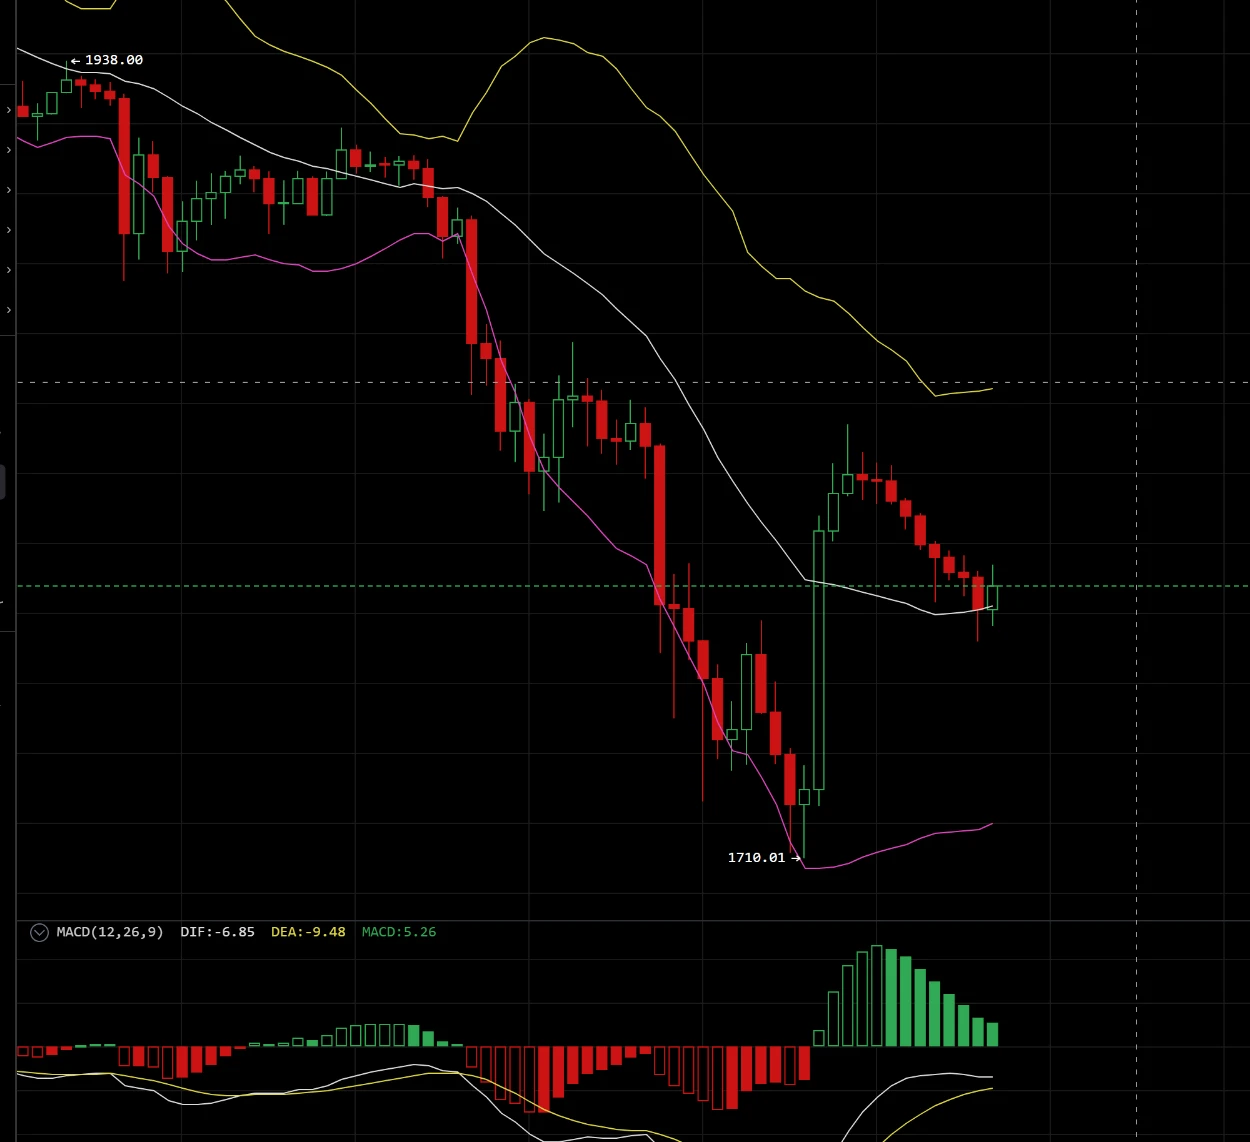
ETH weakened from its 2449 high, dropping to a low of 1710, with a maximum pullback of 739 points during this phase;

Rebounds were capped progressively lower, and multiple coins weakened in sync—the short-side confluence is clear.

Don’t mistake every bounce
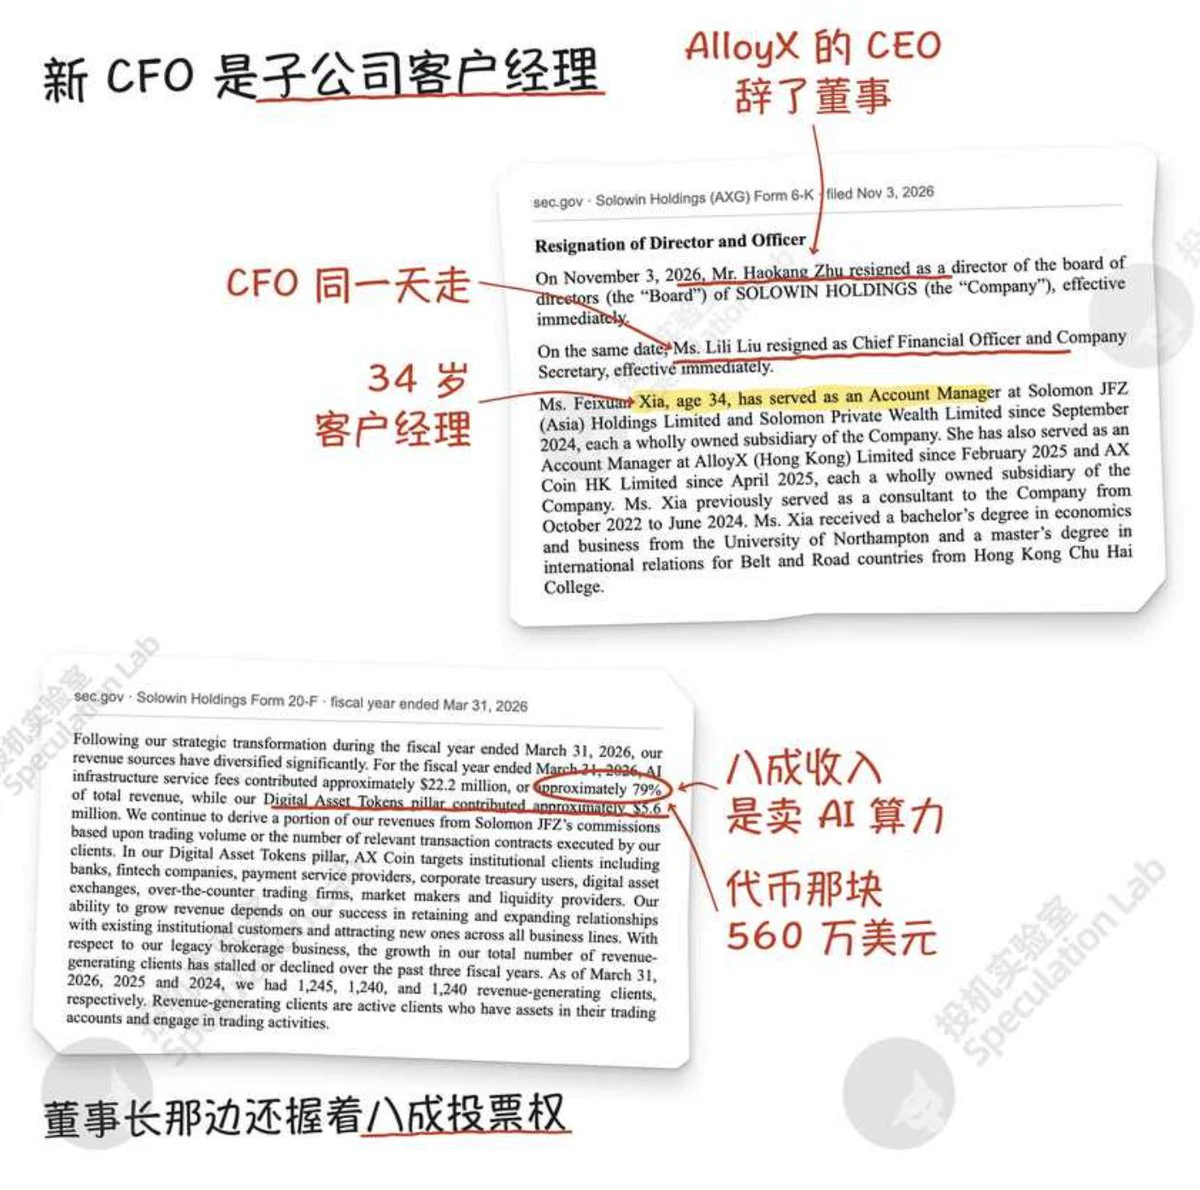
Huaying Holdings’ newly appointed CFO is 34 and previously worked as an account manager at one of its subsidiaries. The CFO took office on November 3, and two days later the company signed a share placement larger than its own market cap😂
Leaving on the same day were director Haokang Zhu and CFO Lili Liu.
Zhu’s résumé is the strongest credential behind the company’s RWA pitch: co-founder and CEO of AlloyX. He previously managed digital assets at China Asset Management (Hong Kong), and in 2025 led the launch of Asia’s first approved retail tokenized money market fund.
But he only resigned as a
post-image
RWA-0.39%
market update
live-cover
LIVE1,107
GM Everyone
Whether the market moves or not, we keep pushing forward.
post-image
🚨 STRATEGY IS DOWN $6.85 BILLION ON ITS BITCOIN INVESTMENT!
It owns 850,364 BTC, bought at an average price of $75,456. With BTC below $67K, the losses are mounting! 📉🔥
post-image
BTC-0.67%
$KAVA Recovery alert... If the 0.025 support holds, the next target is 0.043$KAVA suffered a brutal decline of over 52%, but buyers are finally showing signs of activity near the 0.025 support zone. The price has rebounded to around 0.03234, suggesting a possible short-term recovery. Current price: 0.03234 Key support: 0.02500 First target: 0.03700 Next target: 0.04300 As long as the 0.025 support holds, the price could still rebound to 0.043. However, the overall trend remains bearish, and losing this support could trigger another wave of selling. KAVA: Is this the start of a strong rebound
post-image
KAVA-0.56%
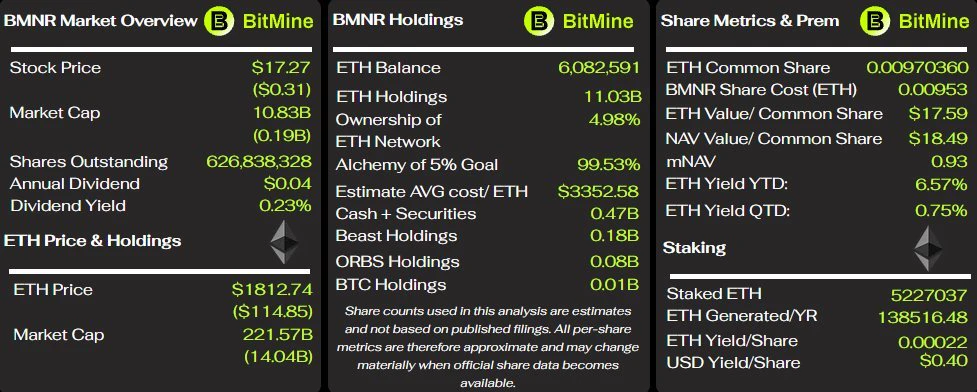
🚨 BitMine is sitting on a $9.7B unrealized loss on its 6.08M $ETH treasury!
Average buy price: $3,352 per $ETH.
Paper loss, but no selling plans reported.
Conviction or risk?
post-image
BMNR-4.82%
ETH-1.26%
GM degens!
A little broken, a little tired, but still building.
post-image
11.15 ETH Positioning Strategy

  ETH is currently in the oversold rebound correction phase of a downtrend. The Bollinger Bands remain bearish, opening downward, and the overall bearish market structure is unchanged. Key resistance levels are concentrated at 1785-1790 (the Bollinger Bands middle line) and 1800-1803 (the high of this rebound). Key support levels are 1755-1760 (the previous consolidation platform during the decline) and 1710-1715 (the low before this decline). For short-term trading, prioritize waiting for a clear sign of resistance during the rebound, with trend-following short
post-image
ETH-1.23%
This kind of Chinese-style education is heartbreaking.
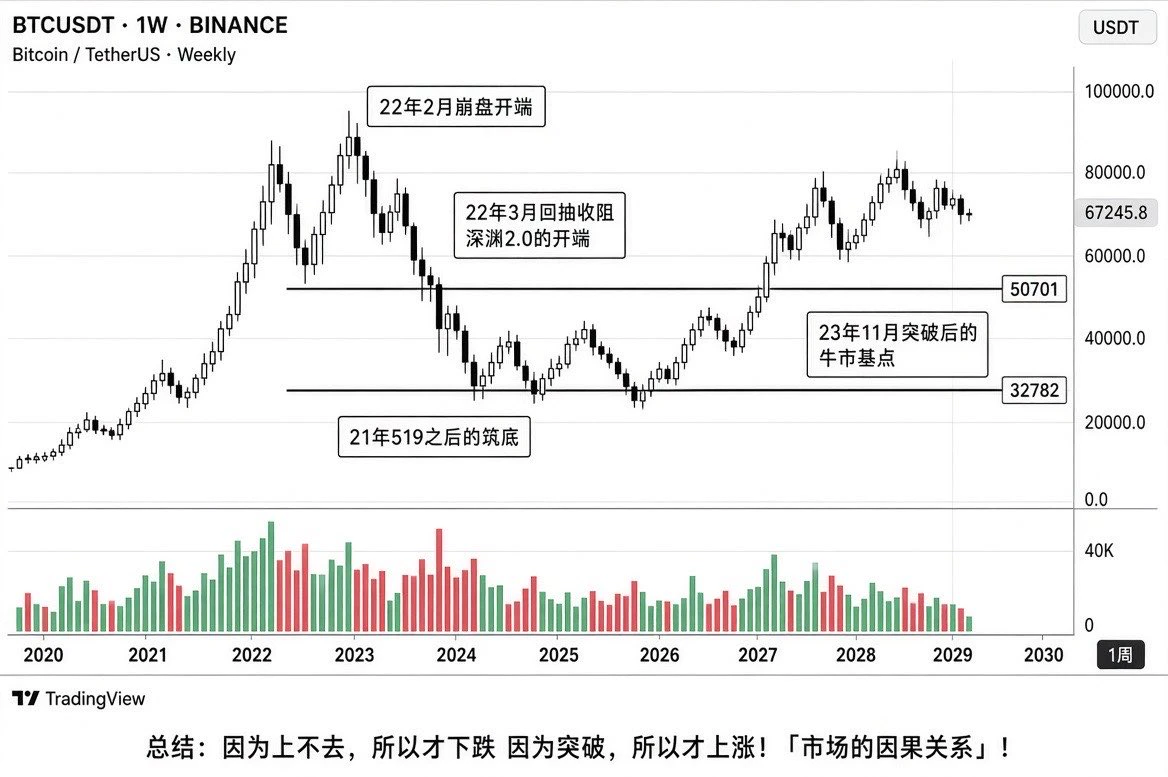
Breaking Down the Market’s Mainstream Bearish Levels

Actually, who can really know how far the market will fall?

When prices rise, people turn bullish; when they fall, people turn bearish. Day in and day out, it’s the same recycled fearmongering.

When the bull market arrives, you may not be able to hold on. When the bear market arrives, you may not dare to enter.

So simply debating whether we’re in a bull or bear market isn’t all that meaningful.

What really matters is this: When prices reach your target, can you take profits? If they break below a key level, can you cut your losses?

Wit
post-image
BTC-0.67%
Case closed! The reason behind Bitcoin’s plunge has been found—it’s because of this! Will it fall further?
1. No more beating around the bush this time; let’s go straight to the chart. This crash is very likely due to a massive liquidity drain caused by Anthropic’s IPO! The amount drained reached $400 billion! Let’s take a look at the details:
2. According to currently disclosed figures, Ant plans to raise nearly $64.4 billion, while IPO subscriptions have already reached 6 times the offering size, or nearly $400 billion! Retail investors and institutions alike are subscribing to Ant’s IPO, pu
BTC-0.67%
SPCX-0.63%
$BTC After a sharp drop, price bounced back—and liquidation zones above and below have lit up! BTC quickly rebounded from around 62,000. Around 66,700 above, shorts face a test! Around 61,600 below, leveraged positions are still clustered. Whether this rally can continue depends on how far the rebound can go! Our 24-hour liquidation heatmap shows BTC quickly recovering to around 65,000 after dipping near $62,000. The selected points on the chart show estimated liquidation leverage of about $63.86 million around $66,691 and about $32.14 million around $61,571. Both are potential liquidation zon
post-image
ZEC+1.16%
$JUP Today finally broke out of that range with strong momentum. Seeing the intraday highs continually tested always makes me wonder—is this the real breakout we've been waiting for, or another trap luring impatient traders out before the next move? Either way, the strong volatility on the 15-minute chart cannot be ignored. Take profit: 0.2741 Stop loss: 0.2530 Market watch: $ZEC : Current price 922.43 - 24-hour change: +1.88%$BLESS : Current price 0.009847 - 24-hour change: +17.48%
post-image
JUP-1.73%
ZEC+1.16%
BLESS-2.00%
Load More

Join 40 M users in our growing community

⚡️ Join 40 M users in the crypto craze discussion

💬 Engage with your favorite top creators

👍 See what interests you

Trending Topics

GateIPOAccessAnthropic

345.1K Views2.7K Discussing

Gate IPO Access Phase 3 features Anthropic (ANT), with USDT subscription interest starting from 100 USDT. Successful allocations will be delivered as real shares to Gate Stock Accounts. Indicative price: $70–$78/share Subscription: Nov 12–17 (UTC+8) Allocation is not guaranteed. Please manage risk accordingly.

Dr.HanOxfordUnionSpeech

151K Views510 Discussing

USOctoberPPIBelowExpectations

479.7K Views1.4K Discussing
View More