Share your thoughts
placeholder
Article
U.S. Treasury yields are too high right now; interest rates will most likely be cut next year, and 2027 will be a super bull market. $SNDK
post-image
SNDK+10.06%
  • 1
🔥 U.S. August NFP Beats Expectations: What It Means for Macro & Crypto Markets
The U.S. Bureau of Labor Statistics released the August Nonfarm Payrolls (NFP) report, delivering a major upside surprise across key metrics:
📊 Headline NFP: +162K jobs added (vs. 56K consensus estimate)
📈 Prior Revisions: July revised up to +21K (from an initial -23K), resulting in a +55K two-month net upward revision.
🇺🇸 Unemployment Rate: Unchanged at 4.1%
💰 Wage Growth: +0.3% MoM / +3.1% YoY
👥 Labor Participation: Rose to 61.6% from 61.4%
Where the Growth Came From
Top Drivers:
• Hospitality & food servic
post-image
NFP-6.21%
BTC-2.21%
  • 6
  • 2
$Q 24 hours surged from 0.0214 to 0.0292, with $31 million in trading volume—this counts as a massive move among small-cap coins. BTC hasn’t moved, the broader market is quiet, yet Q has rallied 26% independently, indicating that capital is deliberately making a move rather than simply following rising sentiment. The short-term support is at 0.0255; if it holds on a pullback, that’s a second-entry point. Set the stop-loss at 0.0238, with an initial target of 0.0312, and keep the position within 20% as a test. I’ve been monitoring the on-chain data: transfer volume is 3 times yesterday’s level,
BTC-2.21%
  • 1
Layout for Bitcoin, Ethereum, and Dogecoin
live-cover
LIVE1,703
How it feels trading on solana rn 🚶🏾‍♂️
post-image
SOL-3.47%
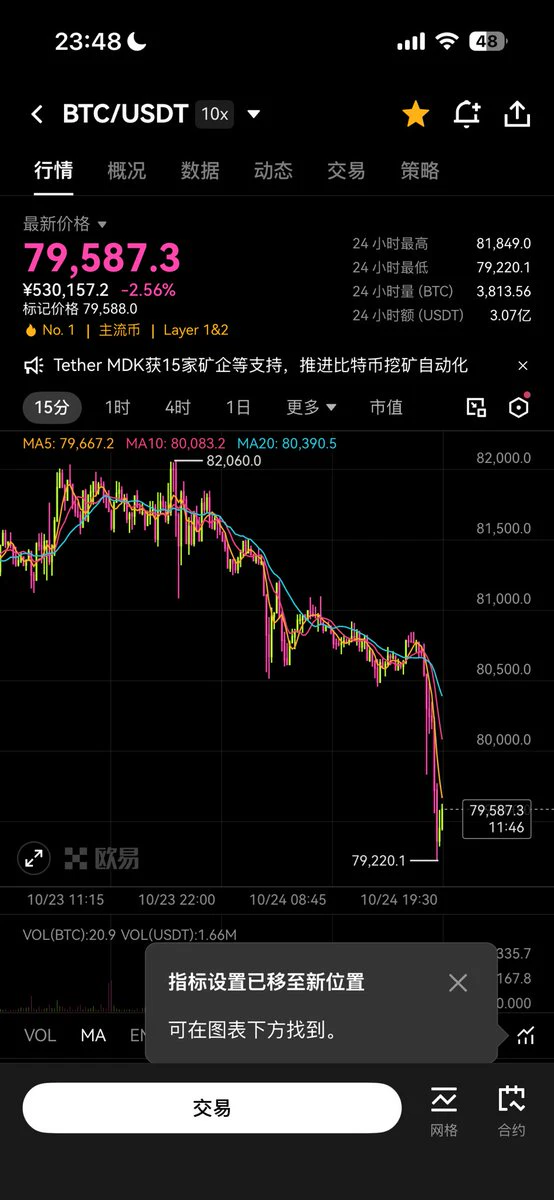
Even when raging waves batter the traveler’s oar, hold firm—when the clouds clear, the time will come.
Many of you have probably experienced this kind of pain:
You identified support, decisively entered a long position, and eagerly awaited an upward move.
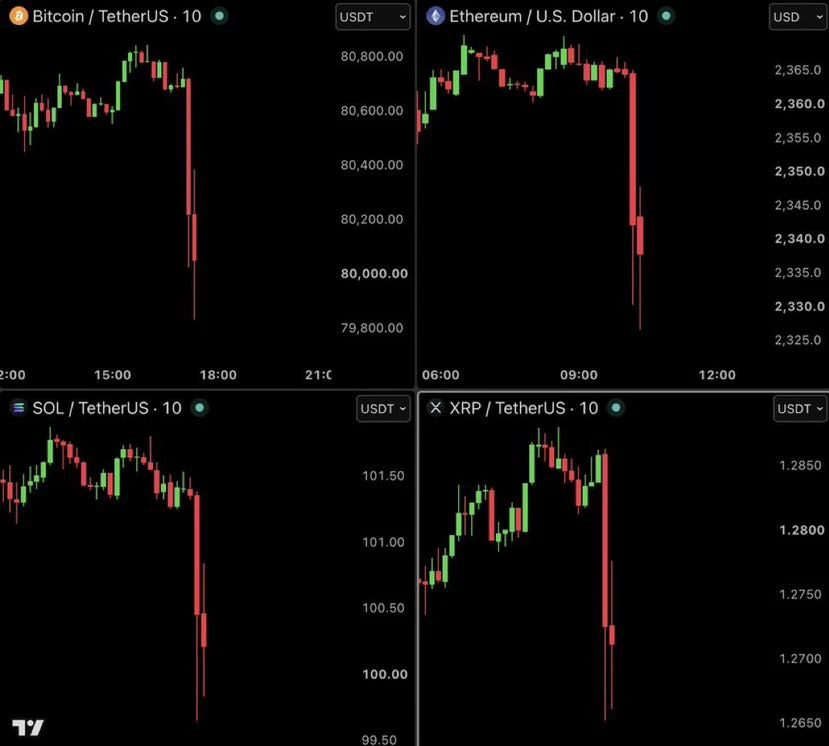
Who could have expected the market to suddenly plunge vertically without warning, with the candlestick quickly moving lower and the position instantly becoming trapped.
$BTC
Before entering, the logic seemed perfectly sound, but a sell-off driven by capital plays by no rules, and expectations can turn out completely different from the market
post-image
BTC-2.18%
Everyone’s staring at NEAR’s breakout, but the real trade is hiding in the 4h candle that just armed itself.

$NEAR /USDT - LONG

Trade Plan:
Entry: 2.0117 – 2.0319
SL: 1.9247
TP1: 2.0946
TP2: 2.1432
TP3: 2.2161

Why this setup?
Why now? The 1D trend is bullish, and the 4h MTF just triggered a LONG with 95% confidence.
- RSI 15m at 67.96—momentum is hot but not exhausted.
- Entry zone: 2.0117–2.0319, with TP1 at 2.0946 and TP2 at 2.1432.
- Stop at 1.9247 keeps risk tight while the ATR (0.0405) supports a clean move.
- Alt setup? Only if price flips below 1.8680—that’s your invalidat
post-image
NEAR+3.65%
I was just about to go to the forum and rant, but then I saw my balance and thought, forget it—the market is always right. A few days ago, I was still lying in bed before sleep, struggling over whether to cut losses on $SIREN . When I woke up this morning, I found that the candlestick chart had figured out the direction on its own.

When the market was dumped early in the session, I watched for a while. The resistance above was obvious, and the rebound was weak—every upward push fell just short. Isn't this a textbook bull trap? While everyone else was sitting on the sidelines, I directly place
post-image
SIREN-2.82%
SNDK+10.83%
ETH-2.39%
With this kind of price action, I don’t even need to think—the account is dancing on its own.
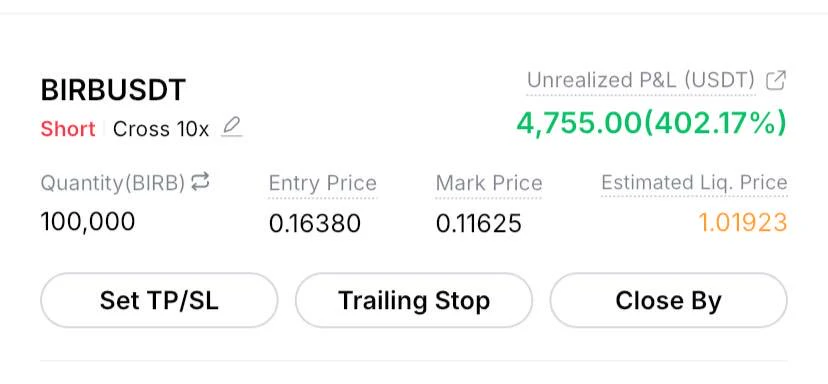
When it plunged intraday, I watched the chart. The rebound was weak, and every push upward fell just short, while volume failed to follow through. With this kind of move, if no one is buying on the way up, I might as well open a short. Sure enough, I caught the rhythm, riding the short from 0.21896 all the way to 0.12559. A +1046% return says it all.
Don’t lose your patience in the range, only to try to win back your dignity in a one-way move. The prerequisite for compounding is staying alive; the sho
post-image
BNB-0.43%
SNDK+10.83%
I was just about to go to the forum and rant, but then I saw my balance and thought, never mind—the market is always right. 😤 I was still debating whether to cut the position after seeing the bearish news, but the chart gave me the answer itself. I didn’t need to worry about it at all.

The logic for shorting it isn’t complicated: insufficient support, with every rebound feeling staged. No one is taking it higher, and the volume is even lower than a few days ago—the bull-trap smell is stronger than coffee from a few days ago. If you don’t short this kind of structure, what do you short? Ente
post-image
ETH-2.39%
DOGE-5.19%
Gm everyone ☀️
post-image
This week also wrapped up perfectly. Time to sleep, time to sleep.
$ZORA (Zora) – Strong Uptrend, Holding for Continuation
I'm holding ZORA because it is up +15.13% at $0.00875, riding a strong uptrend from a 24h low of $0.00735. The Bollinger Bands show the price above the Middle Band (MB at $0.00854), with the Upper Band (UB at $0.00938) acting as resistance. The 24h high is $0.00978, and MACD is deeply positive. **I am holding** this with a stop-loss below the Middle Band ($0.00854), looking for a break above $0.00938.
ZORA+13.22%
  • 4
I originally only planned to test the waters with a small position, but it turned out to be underwhelming? No, it delivered a huge move! As prices repeatedly fluctuated intraday, I watched the order book for a long time. Every dip held above support, while the price-volume action actually grew healthier and healthier. My intuition told me this move had potential. I went with the pullback during the day and entered at 4.828. When I opened the app again after lunch, it had already reached 6.208, pushing the return to +2022.22%. My account was dancing on its own—I was worried it might fall over.
post-image
XRP-4.50%
ADA-4.01%
$BASECAT ready for new highs
post-image
BASECAT+12.00%
BITCOIN'S GOLDEN CROSS IS HERE. 👀🔥
Historically, this setup has preceded some HUGE moves.
But is $100K guaranteed?
Absolutely not.
The Golden Cross has appeared 12 times since 2012. Some produced massive rallies:
📈 2012: +306%
📈 2020: +312%
The average 3-month gain across nine signals was 24.9%.
But there's a catch…
Only 3 of 12 signals remained intact for a full year without a Death Cross.
WHY $100K IS BACK ON THE TABLE:
🔹 Strong institutional ETF demand
🔹 $3.5B+ in August Bitcoin ETF inflows
🔹 USDT dominance potentially forming a Death Cross
🔹 Capital potentially rotating into risk a
post-image
BTC-2.21%
No trading, no analysis, just sheer luck—this result is embarrassing to even talk about.
A few days ago, $ICP was the last thing I looked at before bed. The key level above was pressing down hard, and every rebound was weak and sluggish—a textbook case of a feeble rebound. I said at the time that with this kind of structure, there was no need to rush into a position; instead, you could try taking a small short position. So I set my entry at 2.963, placed a stop-loss, and went to sleep. When I opened my eyes this morning, the price had already ground down to 2.472.
+798.02%—feels damn good, bro
post-image
ICP-2.05%
DOGE-5.19%
ZEC+5.36%
When I make money, I’ll have an ordinary meal to remind myself not to forget my roots.
When I lose money, I’ll have a good meal to keep myself from losing confidence.
Load More

Join 40 M users in our growing community

⚡️ Join 40 M users in the crypto craze discussion

💬 Engage with your favorite top creators

👍 See what interests you

View More