#CanETHStabilizeAfterThePullback
#WCTCS9 ETH at $2,321: RSI Near Oversold, $2,280 Support and $2,371 Recovery Trigger
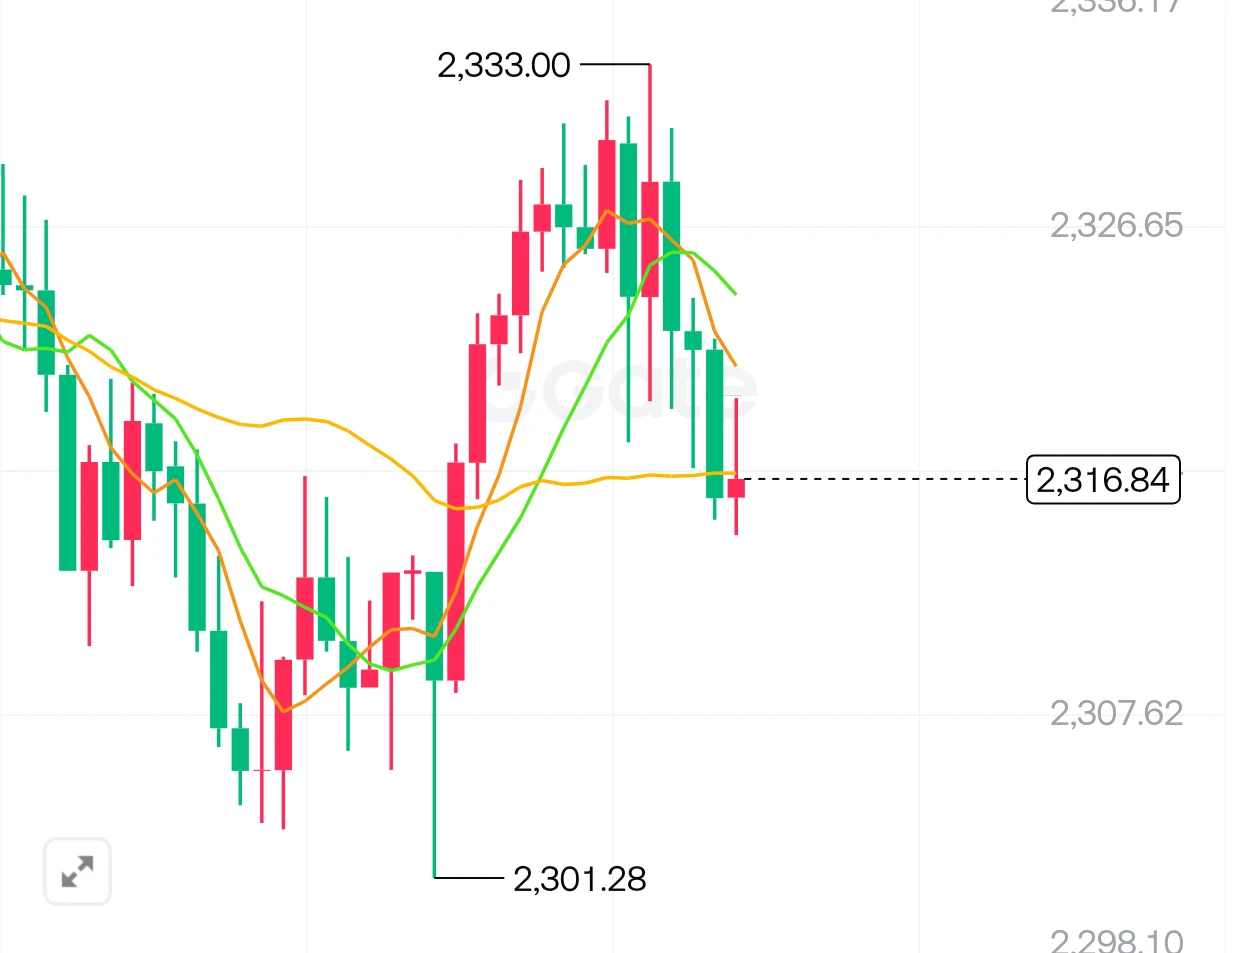
Ethereum is trading near $2,321, and the chart is approaching a critical short-term decision zone. My focus is on price structure, momentum, volume and liquidation pressure not simply whether ETH looks cheap after the pullback. My view is that ETH may stabilize temporarily, but further downside remains possible, while a sustained recovery could be difficult without stronger buying pressure and a clear technical breakout.
Support structure: $2,303–$2,280
ETH is trading close to the $2,300 psychological level. The first support zone is $2,303–$2,280. If buyers defend this area and ETH closes back above $2,303, a short-term recovery attempt becomes possible. A wick below support followed by a quick reclaim would suggest rejection of lower prices. However, a decisive breakdown followed by a failed retest would signal that former support is turning into resistance. In that case, $2,200 becomes the next downside reference not a guaranteed target.
Resistance levels that can change the structure
The first recovery trigger is $2,371. ETH needs to reclaim this level and hold it on a retest, preferably with increasing spot volume. The next resistance band is $2,400–$2,438. Rejection there would indicate that sellers remain active above the current price. A sustained break above $2,438 would provide stronger evidence of a short-term trend improvement, while the daily moving-average area near $2,436 and $2,541 remains important overhead resistance based on the available technical snapshot.
RSI and MACD: momentum still needs confirmation
The reported daily RSI near 32.5 places ETH close to oversold territory. That can precede a relief bounce, but oversold conditions can persist during strong downtrends. I would watch for RSI to turn upward and move back above 35–40 while price reclaims resistance.
Daily MACD remains bearish in the supplied technical snapshot, with the MACD line below the signal line. The key change to watch is whether the negative histogram starts contracting. That would indicate weakening bearish momentum, although a bullish crossover would still need price and volume confirmation.
Volume and candle confirmation
A move above $2,371 on weak volume is less convincing than a breakout supported by strong spot buying. I would look for a decisive candle close above resistance, followed by a retest that holds. On the downside, expanding sell volume below $2,280 would strengthen the breakdown case. A long lower wick alone is not enough; the following candles must show that buyers can maintain control.
Liquidations, open interest and funding
Recent market analysis identified leveraged long liquidations as a source of ETH selling pressure. The technical question is whether forced selling is easing. If ETH stabilizes while open interest declines, excessive leverage may be leaving the market. If price drops alongside rising sell pressure and fresh liquidations, downside risk remains elevated. Positive funding can also indicate that long positions are still paying to stay open, leaving them vulnerable to another sharp move. These indicators should be checked against current exchange data because readings differ by platform and update time.
Important: 😶😶
Geopolitical uncertainty and the midterm-election outlook
My personal view is that uncertainty surrounding the Iran–US conflict could keep risk sentiment fragile. I also expect the approach to the US midterm elections to remain an important political backdrop for markets. Under this scenario, ETH may stabilize at certain levels but still face further downside before a durable recovery develops. A temporary pause in selling does not necessarily mean that the market is ready to move higher. This is my market outlook, not a confirmed outcome; changes in the conflict, economic data or policy expectations could alter the picture.
The macro trigger: October 28–29
The Federal Reserve decision on October 28 and US PCE inflation release on October 29 could increase volatility. I would watch the dollar and Treasury yields alongside ETH rather than assume that any single economic result automatically sends crypto higher or lower. A supportive macro reaction could help ETH test resistance; an adverse reaction could put the $2,280 zone under renewed pressure.
My technical decision map is straightforward: above $2,371, watch for continuation toward $2,400–$2,438; between $2,303 and $2,371, expect an unresolved range; below $2,280 with a failed reclaim, watch the $2,200 area. These are conditional scenarios, not predictions.
At approximately $2,321, the chart has not confirmed a reversal yet. I would wait for the support reaction, RSI improvement, MACD stabilization and stronger spot volume to align. In my view, ETH could remain under pressure and fall further before a convincing recovery appears. The decisive signal is not how far ETH has already fallen it is whether buyers can reclaim broken levels and hold them. @Gate_Square