Square
Following
Hot
News
Notifications
Profile
Share your thoughts
placeholder
Article
#黄仁勋辞职 🔥Breaking! After 33 years at the helm, Jensen Huang suddenly steps down as NVIDIA CEO

NVIDIA’s official announcement on November 12, U.S. Eastern Time:
Jensen Huang has resigned from all positions as president, CEO, and board director, effective immediately.

✅Transition arrangements:
▪CFO Colette Kress will serve as interim CEO while continuing as CFO
▪Harvey Jones appointed as the first chairman in NVIDIA’s history
▪The board has begun the search for a new CEO, considering both internal and external candidates

Following the news, NVIDIA shares fell nearly 14% at their steepest intr
NVDA-4.49%
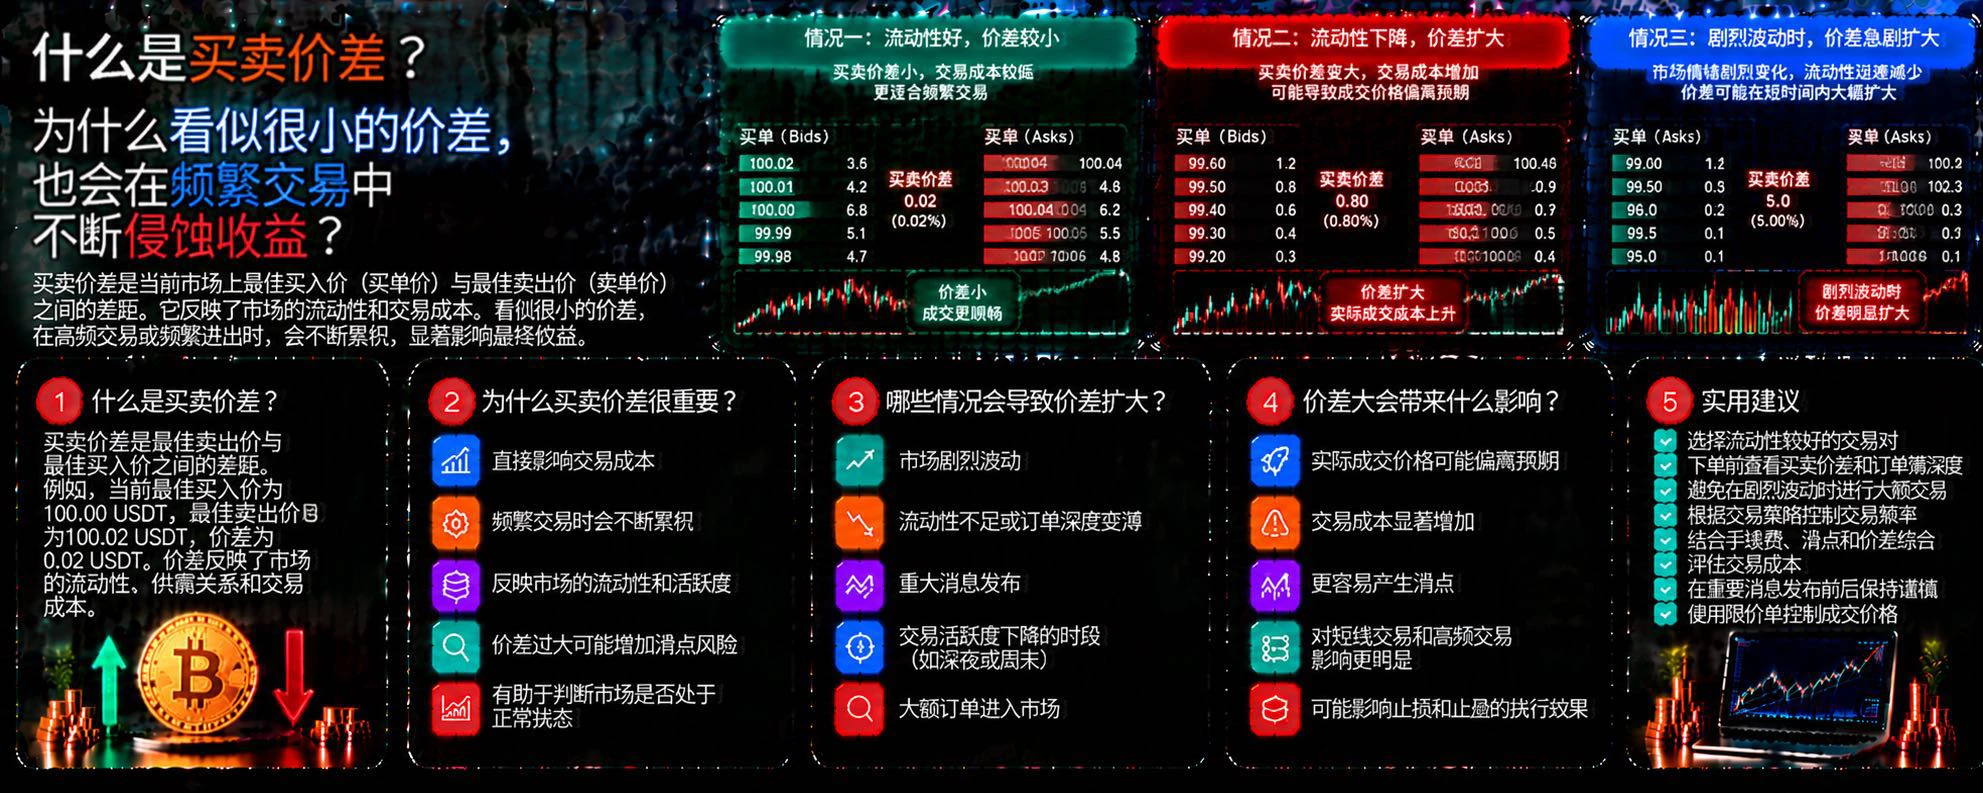
What Is the Bid-Ask Spread? Why Can a Seemingly Small Spread Keep Eating Into Returns Through Frequent Trading?

In crypto trading, many people focus only on price movements and overlook the spread between buying and selling. Even when the market price does not change significantly, frequent trading can incur ongoing costs from spreads and fees, ultimately affecting actual returns.

First, what is the bid-ask spread?

The bid-ask spread is the difference between the market’s best ask price and best bid price. For example, if an asset’s best bid is 100 USDT and its best ask is 100.10 USDT, the
post-image
Trenches
mihao
m
bade
b
mihao
4Cxj...pump
Market Cap
$.
Change
.
24h Vol
$.
Holders
.
AGT
A
bade
b
AGT
0x5d...e274
Market Cap
$.
Change
.
24h Vol
$.
Holders
.
FOOD
F
bade
b
FOOD
FTu5...pump
Market Cap
$.
Change
.
24h Vol
$.
Holders
IDOL
I
bade
b
IDOL
0x3b...ab07
Market Cap
$.
Change
.
24h Vol
$.
Holders
.
AI
A
bade
b
AI
2T56...pump
Market Cap
$.
Change
.
24h Vol
$.
Holders
.
What Is the Difference Between Mark Price, Last Traded Price, and Index Price? Why Do They Affect Contract Trading?

In crypto contract trading, some people see that the last traded price has not yet reached their expected level, but their account is already showing a large unrealized loss or even nearing liquidation. Others find that the price on the candlestick chart does not exactly match the price the platform uses to calculate risk.

One important reason is that the last traded price, index price, and mark price are not the same thing.

First, the last traded price: the price of the marke
post-image
BTC falls below $71k, hitting its lowest level since September! The $70k level is under threat—where
live-cover
LIVE4,465
Why Isn't the Execution Price Shown by an Exchange Necessarily the Price You Actually Get?

In crypto trading, you may see Bitcoin fluctuating around a certain price. But after clicking buy, you may find that the average execution price is higher than expected. The same goes for selling: the price shown on screen may look good, but the amount you ultimately receive may be less than you imagined.

This doesn't necessarily mean there's a problem with the exchange. The latest trade price, bid and ask quotes, and your actual execution price can naturally differ.

First, the latest trade price isn'
post-image
BTC-0.67%
Am I the person who knows zec best
ZEC+1.29%
#BTCDown4% #ShareWeekly
Bitcoin's $70,000 Battle: Breakdown, Recovery or a Bigger Market Reset?

Bitcoin is no longer simply approaching the $70,000 support zone. The market has tested and briefly traded below that psychological level, making the next daily and weekly closes extremely important. After struggling around $80,000 earlier in November, BTC fell toward $69,000–$70,000. The latest market snapshot showed BTC near $69,270, down approximately 6.10% over 24 hours and 8.55% over seven days. Its reported 24-hour range was roughly $68,900–$73,858. Market capitalization was around $1.40 tri
  • 2
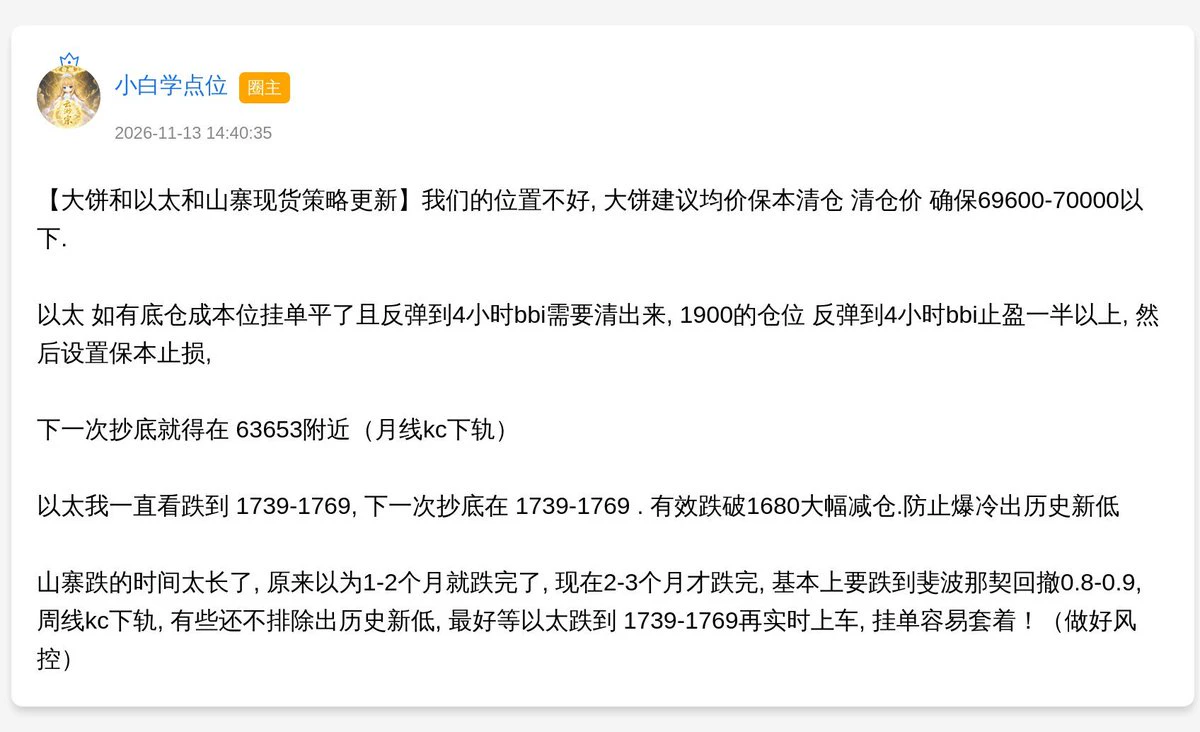
The beginner just called out these levels: sell the Bitcoin at break-even based on its average cost; look to fully exit around 69,600–70,000, buy the dip at 63,700, and watch ETH at 1,739–1,769.

BTC is now at 68,800, already in the sell-all zone. ETH is at 1,934 after plunging to 1,896 during the day. It couldn’t even hold 70,000. If prices keep dropping, 63,700 and 1,739 really could be hit.
post-image
BTC-0.67%
ETH-1.26%
🔥 Start live trading with 100U daily and double your account in a week

✅ Copy trades at a fixed ratio, with a clear profit multiplier
✅ Recommended copy-trading funds: 110u, 210u, etc., increasing proportionally (keep a few extra u to avoid falling behind on trades due to platform slippage)
✅ No oversized positions, no going all-in, no holding losing positions
✅ Day trading; recommend ending copy trading at the end of each day to lock in profits
✅ Strictly follow trading discipline and control trading risk

For every 1 point I earn, the copy-trading account scales up accordingly at the prese
post-image
What Is the Funding Rate? Why Can Holding Perpetual Contracts Also Incur Ongoing Additional Costs?

In the cryptocurrency market, some traders get the direction right but find that their final returns are lower than expected. Besides fees and slippage, there is another easily overlooked factor: the funding rate.

The funding rate is a mechanism in perpetual contract markets that helps keep contract prices linked to spot market prices. It can affect holding costs and whether traders are willing to hold a position in a particular direction over the long term.

First, what exactly is the funding
post-image
More and more traders are using AI and quantitative models to predict cryptocurrency market trends. Some models can even give an 80% probability of a price rise. But here’s an interesting phenomenon: even when trading signals seem highly accurate, many people still end up losing money.

Why is that?

First, a probability forecast is not a guarantee of profit. An 80% probability of a rise means the model estimates that the market is more likely to go up under specific conditions. It does not mean the next trade is guaranteed to make money.

Second, markets can change at any time. Breaking news,
post-image
KGEN | Long 🟢 | Bullish | 15m24h: +1.57% | Volume: 92.7M USDT Long rationale: Price is above EMA200; EMA20/50/200 are in bullish alignment; RSI14 is 63.5; MACD histogram is positive; ADX14 is 37.3; volume is 0.76 times the 20-candle average; trend pullback/continuation. Entry: 0.0847 Stop-loss: 0.0771184 Take-profit 1: 0.094177 | Take-profit 2: 0.0998632 | Take-profit 3: 0.107445 Entry price for reference only; do not chase the price. The trade setup is invalidated if the stop-loss level is reached. Technical setup only; not financial advice. $KGEN
post-image
KGEN-5.46%
What Is a Mean Reversion Strategy? Why Do Prices Sometimes Return After Deviating From Their Historical Mean, but Sometimes Keep Moving Further Away?

In cryptocurrency trading, prices often fluctuate around a certain range. When a price deviates significantly from its recent mean, some traders look for opportunities to trade in the opposite direction, hoping the price will return to its normal range. But mean reversion is not a guaranteed market rule, especially when trends are strong or fundamentals change; prices may continue moving further away from the mean.

First, what is mean reversion
post-image
eth market
live-cover
LIVE1,931
It's currently hitting yesterday's 402
post-image
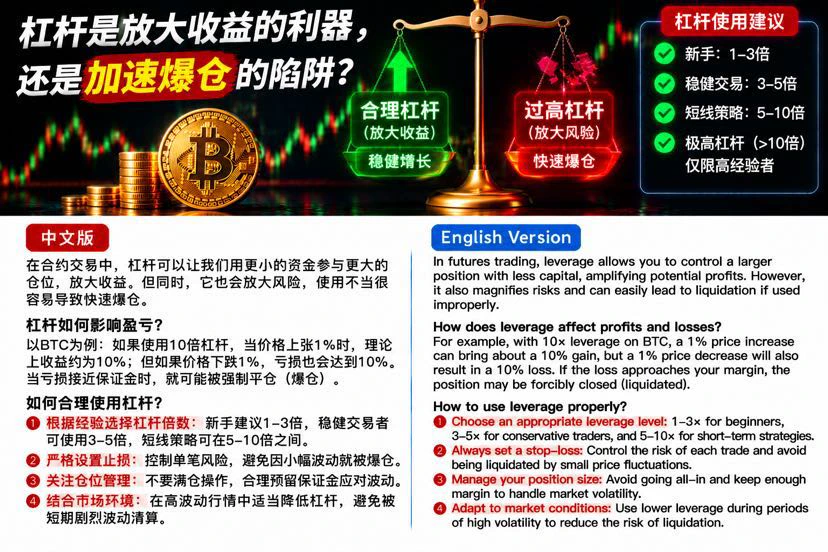
In crypto futures trading, leverage has always been one of the most exciting tools—and one of the easiest ways to pay a price.

Many people think that with 10x leverage, if BTC rises 1%, they can earn a 10% return. But they often overlook another fact: if the price moves 1% in the opposite direction, their losses are amplified just as much.

So how should leverage be understood?

First, leverage amplifies position size, not trading ability. Even if you correctly predict the market direction, an unreasonable entry point could still lead to heavy losses due to short-term volatility.

Second, the
post-image
BTC-0.65%
Why Can Prices Still Fall When the Order Book Shows a Large Number of Buy Orders?

In cryptocurrency trading, many people watch the order book and try to judge market direction based on buy and sell orders. When a large number of buy orders appear on the screen, some traders assume there is strong support below and that the price should not fall easily.

But reality is often more complicated. A large number of buy orders does not mean the price will necessarily rise; a large number of sell orders does not mean it will inevitably fall.

First, placed orders are not the same as executed trades.
post-image
What Is Multi-Timeframe Analysis? Why Doesn’t a Bullish Short-Term Trend Mean the Long-Term Trend Is Also Rising?

In crypto trading, the same asset can show completely different price movements across different timeframes. The 15-minute chart may be rising while the 4-hour chart is still in a downtrend, and the daily chart may show the market moving sideways. Looking at just one timeframe can easily lead you to mistake a brief bounce for a trend reversal.

First, what is multi-timeframe analysis?

Multi-timeframe analysis means observing price movements across different timeframes at the same
What Is Trading Expectancy? How Can Win Rate, Average Profit and Loss, and Trading Costs Help Determine Whether a Strategy Has a Long-Term Edge?

In cryptocurrency trading, making money with a strategy in the short term does not mean it will work over the long term. One lucky big trade can mask problems with the strategy itself. Trading expectancy helps us evaluate a strategy as a whole, rather than judging it based on just a few wins or losses.

First, what is trading expectancy?

Trading expectancy is the average profit a strategy may generate per trade when used repeatedly. It takes into ac
post-image
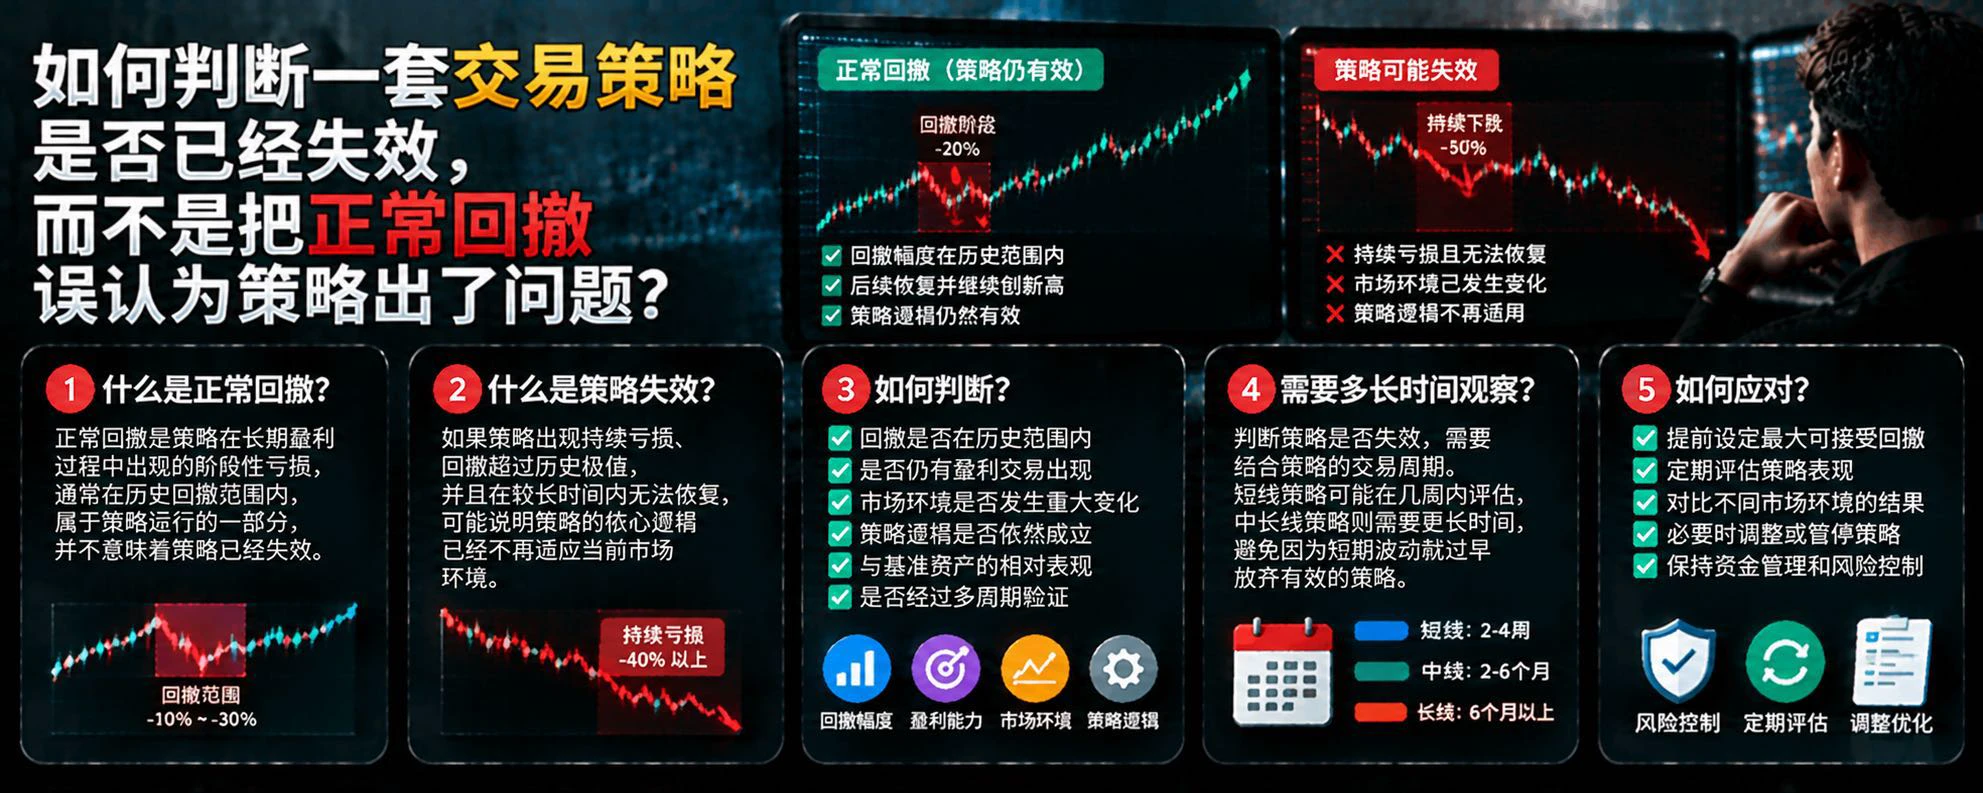
Consecutive losses are when many futures traders are most likely to lose confidence.

Some people start doubting their trading system after two or three losses. After a string of losses, others rush to change indicators and entry conditions, or even keep increasing their position sizes, hoping to quickly make back their losses.

But the question is: Do consecutive losses really mean a strategy has failed?

Not necessarily. To determine whether a trading strategy has failed, you need to look at at least five things.

First, examine the trade sample. Three to five losses do not prove a strategy
post-image
Load More

Join 40 M users in our growing community

⚡️ Join 40 M users in the crypto craze discussion

💬 Engage with your favorite top creators

👍 See what interests you

Trending Topics

JensenHuangResigns

514.6K Views8.1K Discussing

Jensen Huang has resigned as NVIDIA CEO and stepped down from the board. CFO Colette Kress will serve as interim CEO while NVIDIA considers internal and external successors. $NVDA fell more than 10% in premarket trading following the announcement. With one of AI’s most influential leaders stepping aside, markets are now reassessing NVIDIA’s leadership stability, AI strategy, and long-term valuation.

GateIPOAccessAnthropic

279.6K Views2.6K Discussing

Dr.HanOxfordUnionSpeech

144.5K Views450 Discussing

View More